Managing electricity purchasing without clear performance visibility often results in rising costs, missed savings opportunities, and weak supplier control. Because electricity procurement involves high-value contracts, volatile market prices, regulatory pressure, and long-term commitments, organizations need a reliable system that tracks performance continuously and accurately.
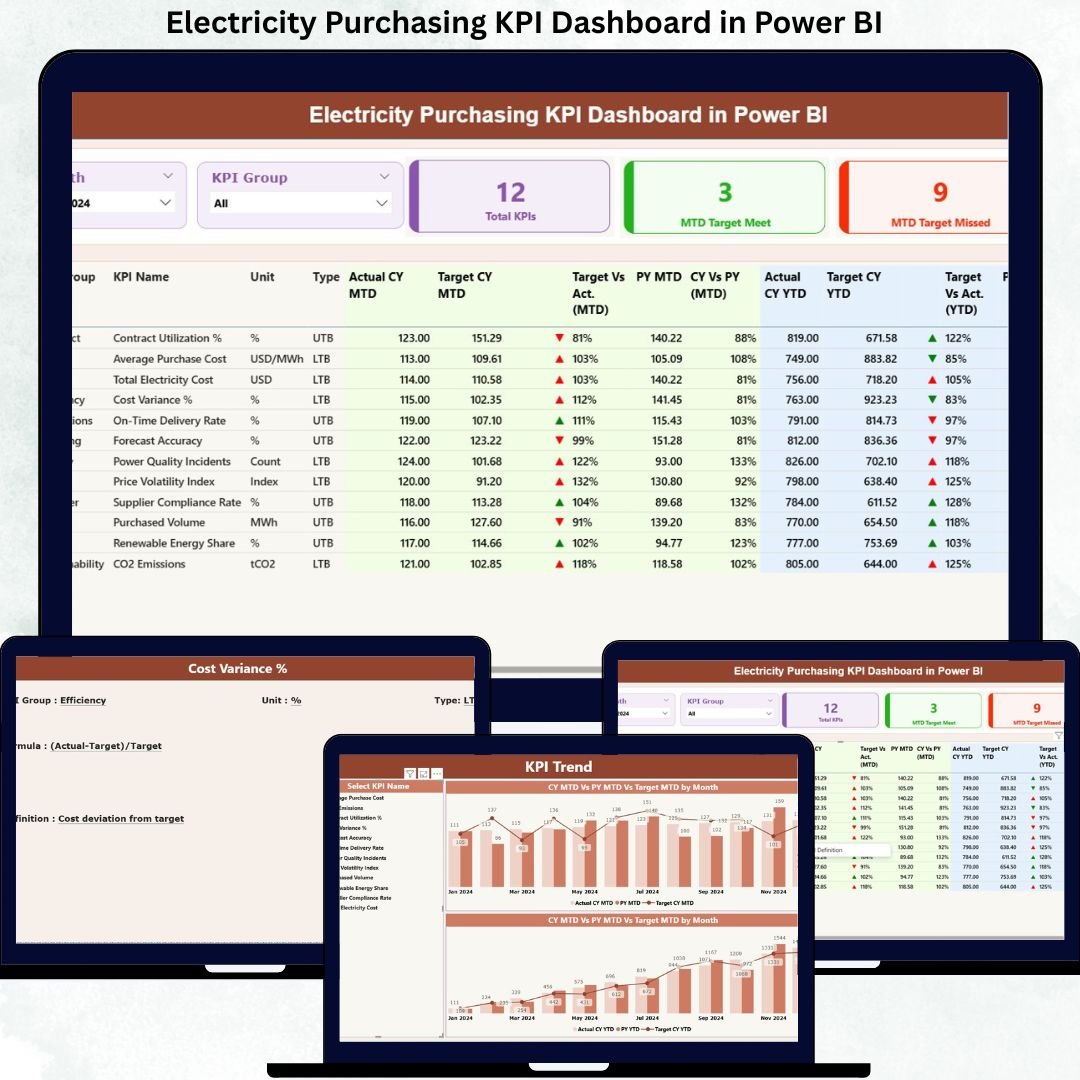
That is exactly why the Electricity Purchasing KPI Dashboard in Power BI is designed as a powerful, ready-to-use analytical solution. This dashboard transforms raw electricity purchasing data into meaningful KPIs, visual indicators, and actionable insights. Instead of juggling multiple Excel files and manual reports, procurement teams gain a single, centralized performance view that drives confident decision-making.
Built with Excel as the data source and Power BI as the visualization engine, this dashboard offers clarity, accountability, and control over electricity purchasing performance—month after month.
⚡ Key Features of Electricity Purchasing KPI Dashboard in Power BI
🚀 Centralized KPI Monitoring
Track all electricity purchasing KPIs from one structured Power BI dashboard instead of scattered spreadsheets.
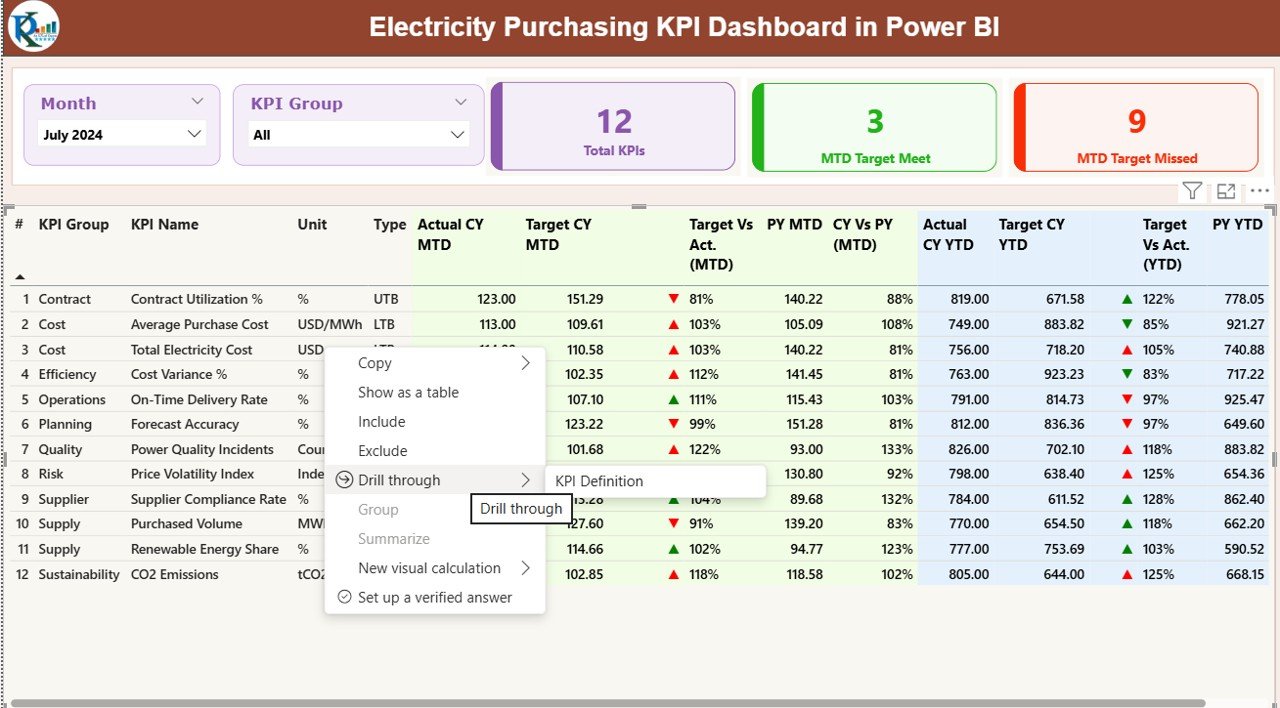
📅 Dynamic Month & KPI Group Slicers
Filter performance instantly by reporting month or KPI category for focused analysis.
🎯 MTD & YTD Performance Tracking
Monitor Month-to-Date and Year-to-Date results to identify short-term issues and long-term trends.
📊 Target vs Actual Analysis
Clearly identify whether purchasing KPIs meet or miss targets using calculated ratios and visual indicators.
📈 CY vs PY Comparisons
Compare current-year performance against previous-year values to measure improvement or decline.
🟢🔴 Visual Status Indicators
Green and red arrows instantly highlight KPI success or failure without manual interpretation.
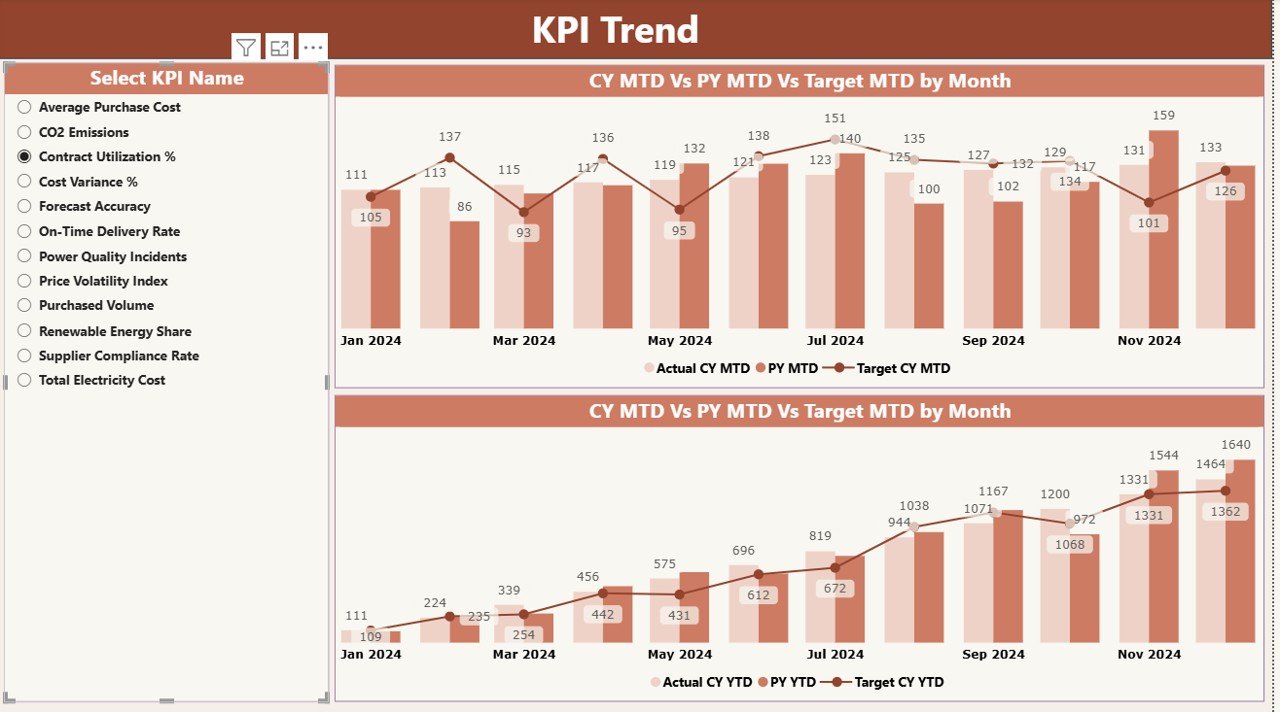
📉 Trend Analysis with Combo Charts
Analyze purchasing behavior over time using dynamic MTD and YTD trend visuals.
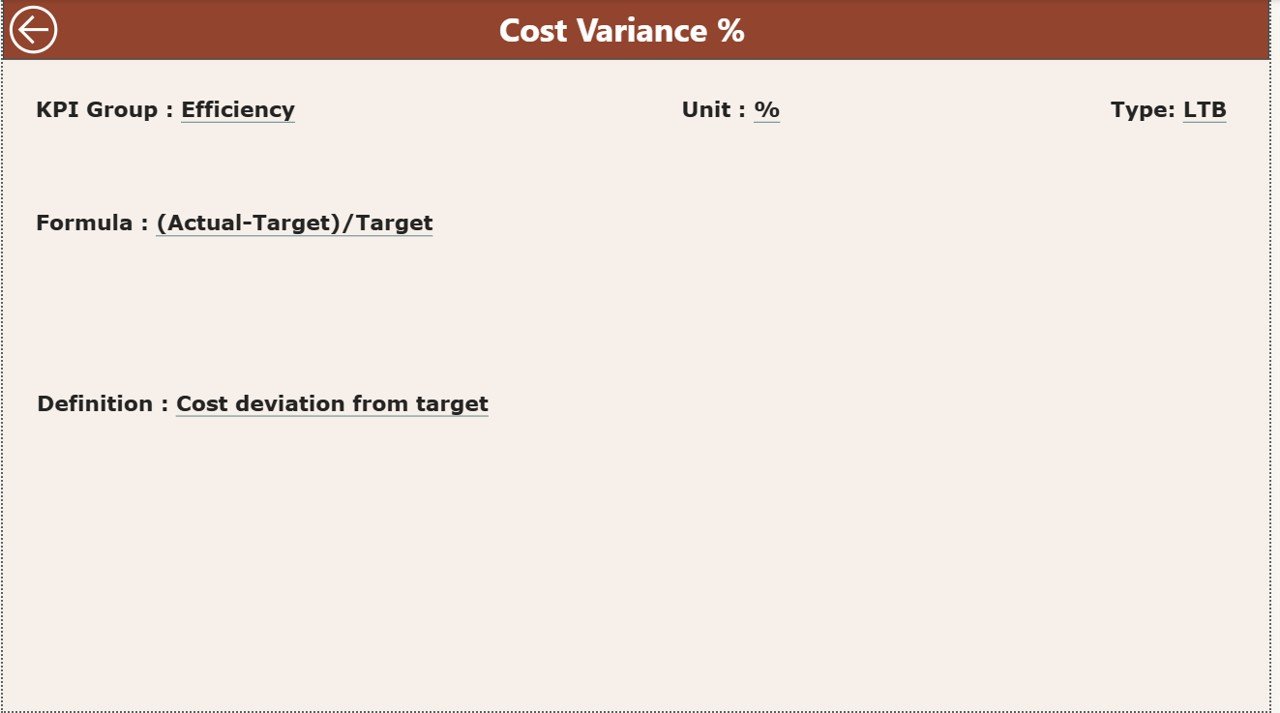
🔍 Drill-Through KPI Definitions
Understand every KPI clearly with built-in definitions, formulas, and purpose descriptions.
📦 What’s Inside the Electricity Purchasing KPI Dashboard
This digital product includes a fully structured Power BI dashboard with three dedicated analytical pages:
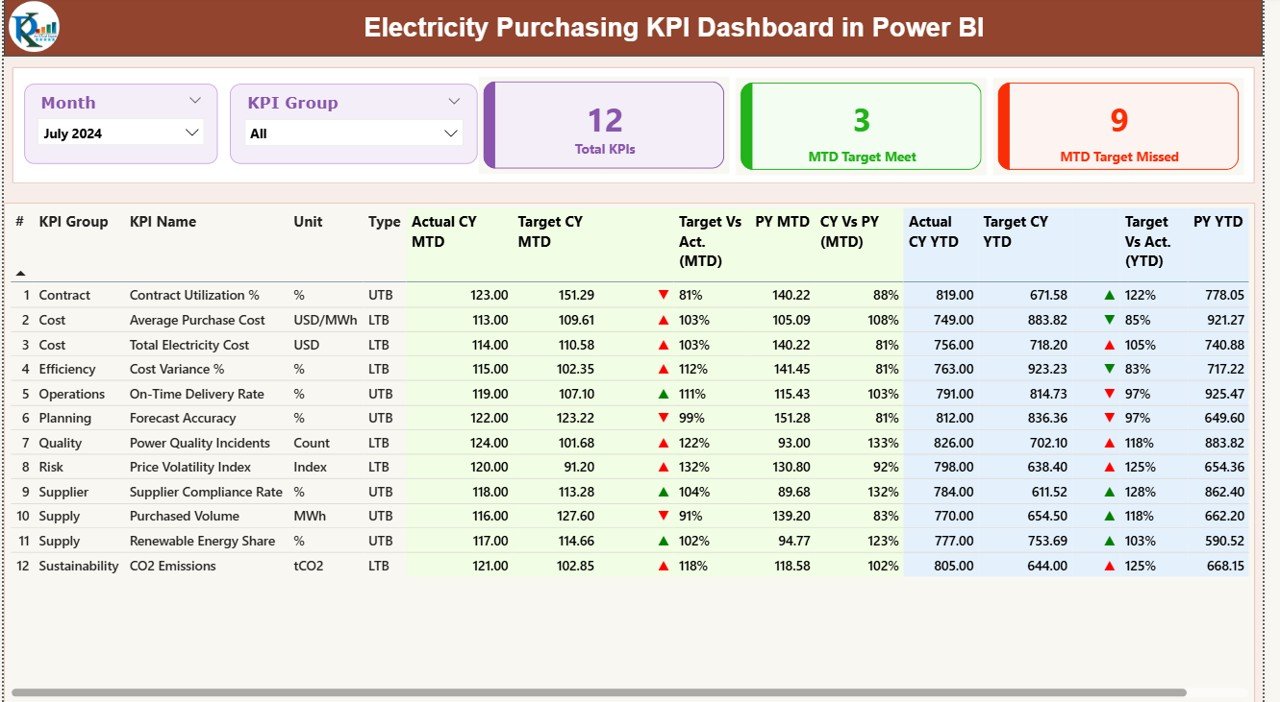
📌 Summary Page
Acts as the main control center with KPI cards, slicers, and a detailed KPI performance table.
📌 KPI Trend Page
Displays MTD and YTD trends using combo charts that compare actuals, targets, and previous-year values.
📌 KPI Definition Page
A hidden drill-through page that explains KPI formulas, definitions, purpose, and KPI type (LTB or UTB).
Additionally, the dashboard is powered by a clean Excel data model with:
-
Actual performance input sheet
-
Target benchmark input sheet
-
KPI definition master sheet
This structure ensures accuracy, scalability, and consistency.
🛠️ How to Use the Electricity Purchasing KPI Dashboard
Using this dashboard is simple and user-friendly:
1️⃣ Update actual purchasing values in the Excel input sheet
2️⃣ Enter target values for MTD and YTD
3️⃣ Refresh the Power BI report
4️⃣ Instantly view updated KPIs, trends, and indicators
5️⃣ Drill through KPIs for deeper understanding
Because Excel handles data entry and Power BI handles analysis, both technical and non-technical users can operate the dashboard with ease.
👥 Who Can Benefit from This Electricity Purchasing KPI Dashboard?
This dashboard is ideal for:
⚙️ Electricity procurement teams
🏭 Manufacturing plants and industrial units
⚡ Utility companies and power distributors
🏗️ EPC contractors and infrastructure projects
💼 Finance, cost control, and energy management teams
Any organization that purchases electricity at scale will benefit from improved visibility, cost control, and accountability.
Click here to read the Detailed blog post
Watch the step-by-step video tutorial:
Visit our YouTube channel to learn step-by-step video tutorials
https://youtube.com/@PKAnExcelExpert


Reviews
There are no reviews yet.