Managing electricity procurement without real-time performance visibility often leads to cost overruns, supplier risks, and missed savings opportunities. Because electricity procurement involves high-value contracts, volatile prices, regulatory pressure, and strict timelines, organizations must monitor performance continuously and accurately.
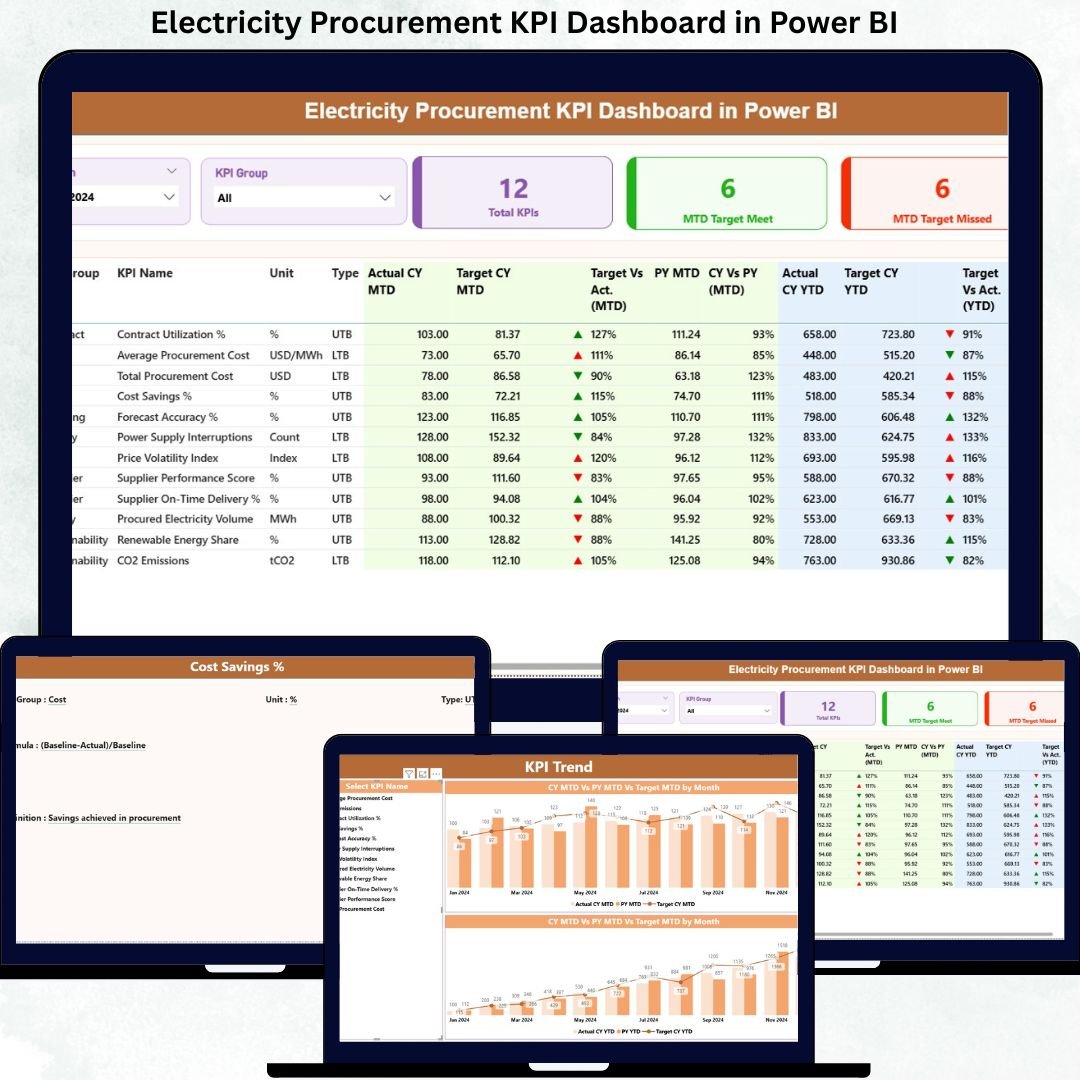
That is exactly why the Electricity Procurement KPI Dashboard in Power BI is designed as a powerful, ready-to-use analytical solution. This dashboard transforms raw procurement data into clear KPIs, visual indicators, and actionable insights—helping procurement teams take control with confidence.
Instead of juggling multiple Excel sheets and manual reports, this dashboard provides a single source of truth for electricity procurement performance. It combines the simplicity of Excel data entry with the analytical power of Power BI, making it easy to adopt for both technical and non-technical users.
With structured pages, automated calculations, and intuitive visuals, this dashboard allows you to track targets, identify inefficiencies, monitor trends, and improve accountability—month after month.
🔑 Key Features of Electricity Procurement KPI Dashboard in Power BI
📊 Centralized KPI Monitoring
Track all electricity procurement KPIs from one interactive Power BI dashboard instead of scattered reports.
🎯 Target vs Actual Performance Tracking
Instantly see which KPIs meet or miss targets using clear percentage comparisons and visual indicators.
📅 MTD & YTD Analysis
Monitor Month-to-Date and Year-to-Date procurement performance with automated calculations.
📈 Year-over-Year Comparisons
Analyze current year performance against previous year data to identify improvement or decline.
🔄 Dynamic Slicers
Filter performance by Month and KPI Group for quick and focused analysis.
🧭 Trend Analysis Charts
Understand long-term procurement behavior using MTD and YTD trend charts.
📘 Transparent KPI Definitions
Access KPI formulas and definitions through a dedicated drill-through page.
📦 What’s Inside the Electricity Procurement KPI Dashboard in Power BI
This ready-to-use product includes:
📄 Power BI Dashboard File (.pbix)
Fully designed with three structured analytical pages.
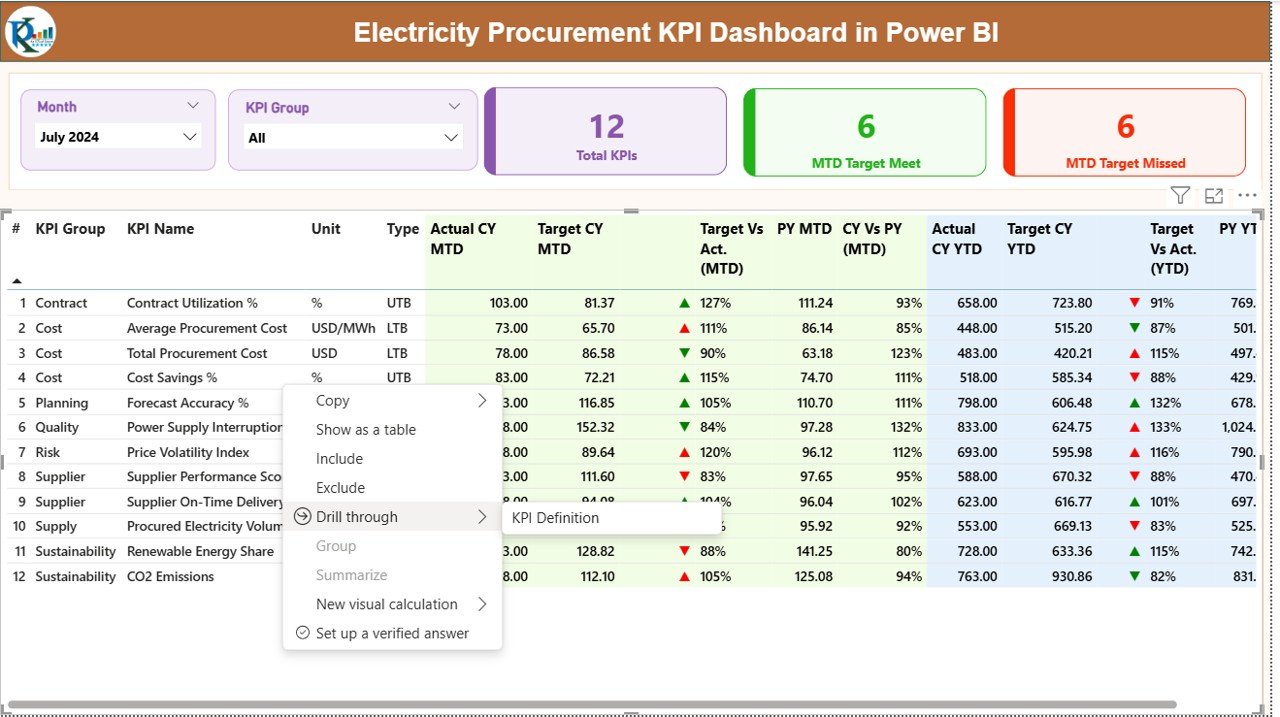
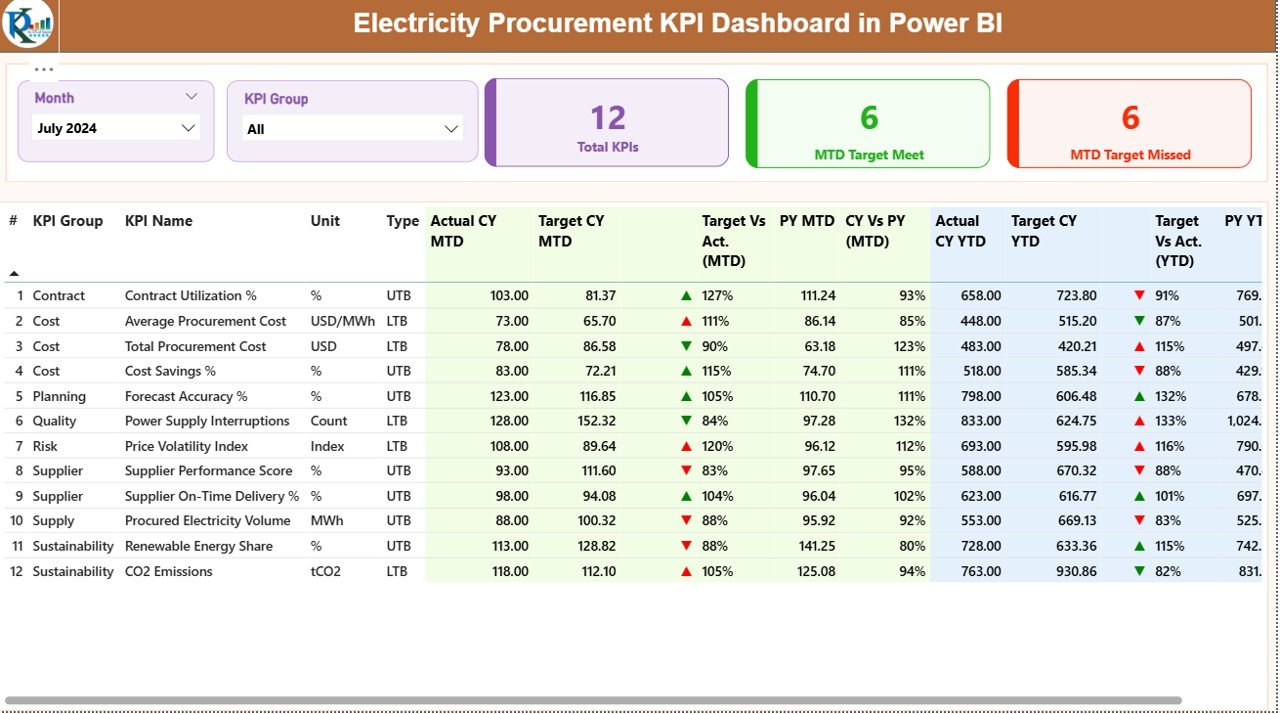
📊 Summary Page
Displays KPI cards, slicers, and a detailed KPI performance table with MTD, YTD, and YoY comparisons.
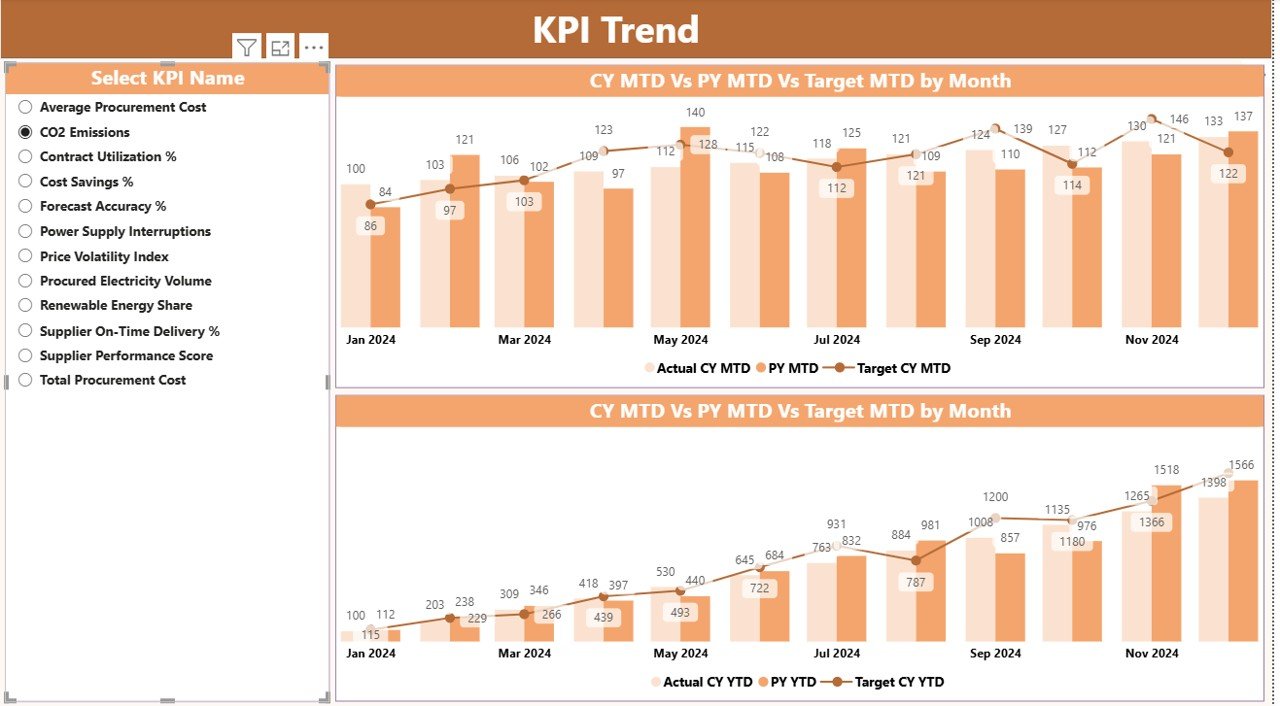
📈 KPI Trend Page
Shows MTD and YTD combo charts for selected KPIs to analyze trends over time.
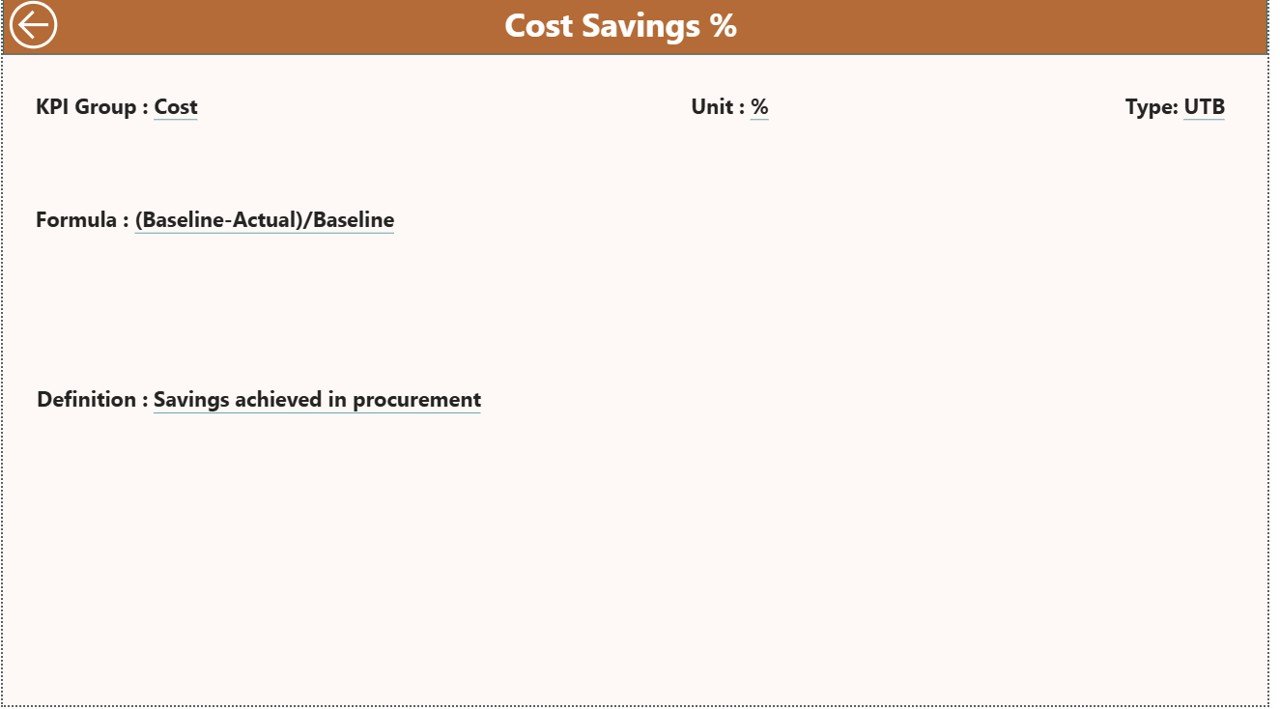
📘 KPI Definition Page
Provides KPI formulas, definitions, and measurement logic for full transparency.
📁 Excel Data Template
Well-structured Excel sheets for Actuals, Targets, and KPI Definitions.
🚀 Scalable Design
Easily add new KPIs without redesigning the dashboard.
🛠️ How to Use the Electricity Procurement KPI Dashboard in Power BI
Using this dashboard is simple and efficient:
📝 Step 1: Enter Data in Excel
Update actual and target procurement values in the provided Excel templates.
🔄 Step 2: Refresh Power BI
Open the Power BI file and refresh data—visuals update automatically.
🎛️ Step 3: Apply Filters
Use Month and KPI Group slicers to focus on specific performance areas.
📊 Step 4: Analyze Performance
Review KPI cards, tables, and trend charts to identify gaps and opportunities.
📘 Step 5: Understand KPIs
Drill through to the KPI Definition Page for formulas and explanations.
👥 Who Can Benefit from This Electricity Procurement KPI Dashboard
This dashboard is ideal for:
⚡ Procurement Managers managing electricity purchasing performance
⚡ Energy Buyers tracking cost efficiency and supplier accountability
⚡ Finance Teams monitoring procurement impact on budgets
⚡ Utility Companies overseeing large-scale electricity procurement
⚡ Manufacturing Firms controlling energy purchasing costs
⚡ EPC Contractors managing procurement KPIs across projects
⚡ Government Electricity Boards ensuring transparency and compliance
Any organization involved in electricity procurement can gain measurable value from this solution.
Click here to read the Detailed Blog Post
Watch the step-by-step video tutorial:
👉Visit our YouTube channel to learn step-by-step video tutorials:
https://www.youtube.com/@PKAnExcelExpert


Reviews
There are no reviews yet.