The electric vehicle (EV) industry is expanding at an unprecedented pace. Governments promote sustainability, businesses invest in clean mobility, and organizations manage growing EV fleets. However, tracking electric vehicle performance across scattered spreadsheets often leads to confusion, delayed insights, and missed optimization opportunities.
That is exactly why the Electric Vehicle KPI Dashboard in Google Sheets becomes a powerful and practical solution.
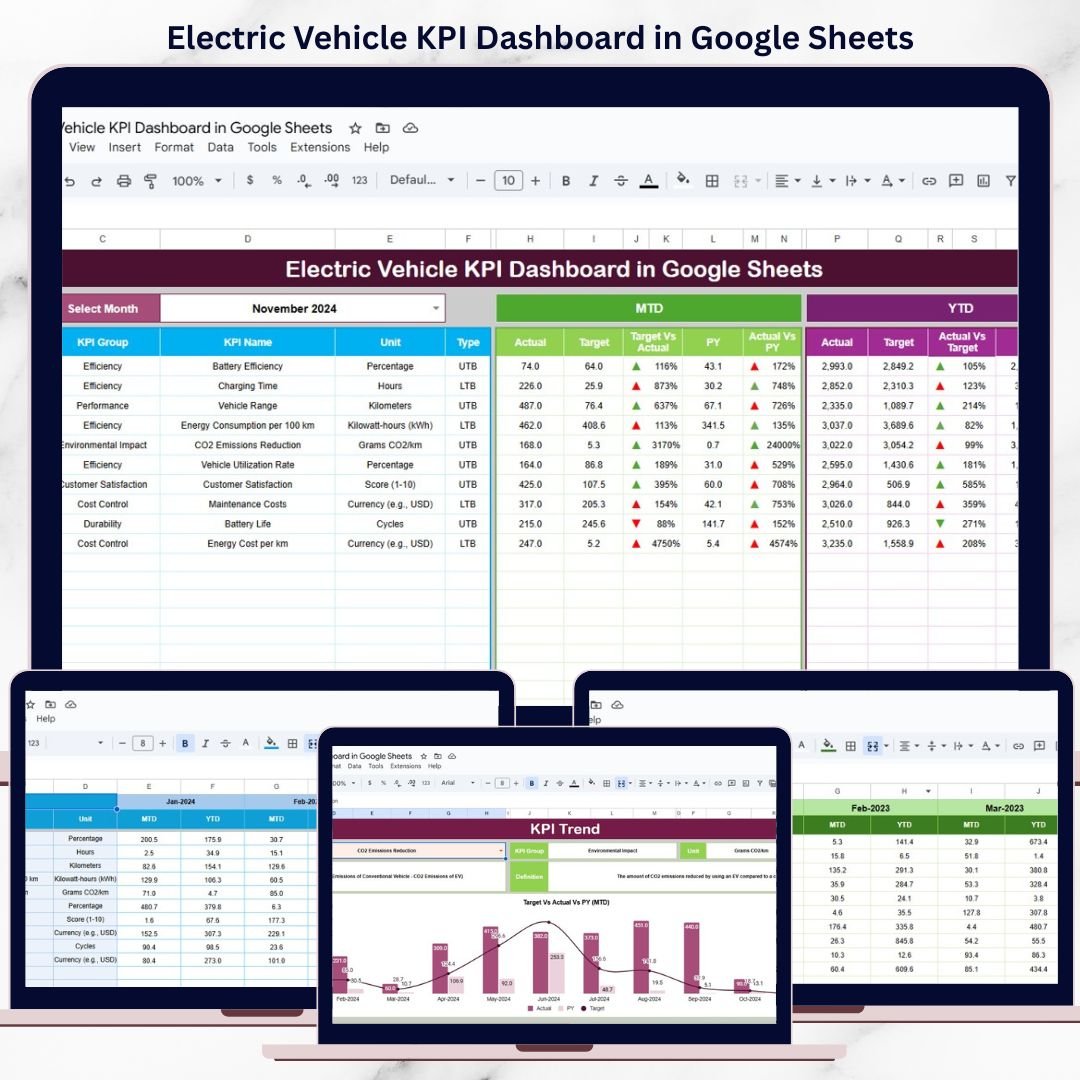
This ready-to-use dashboard transforms raw EV data into clear KPIs, visual trends, and performance comparisons. Instead of reviewing multiple sheets, you can track energy efficiency, operating costs, charging performance, utilization, and sustainability metrics from one centralized Google Sheets dashboard.
Because the dashboard is built in Google Sheets, it is cloud-based, collaborative, cost-effective, and easy to customize—without requiring complex BI tools or technical expertise.
🔋 Key Features of the Electric Vehicle KPI Dashboard
🚀 Centralized EV Performance Tracking
Monitor all electric vehicle KPIs from one unified dashboard.
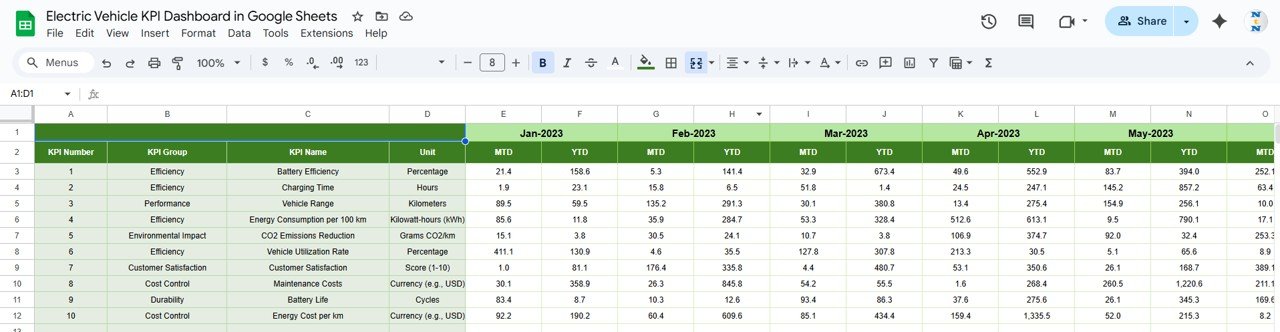
📊 MTD & YTD Performance Visibility
Track short-term operations and long-term strategic performance together.
🎯 Target & Previous Year Comparison
Measure progress against goals and historical benchmarks.
📈 Trend-Based Insights
Identify efficiency improvements, cost increases, or operational risks early.
🤝 Real-Time Collaboration
Share insights instantly with teams using Google Sheets.
📦 What’s Inside the Electric Vehicle KPI Dashboard
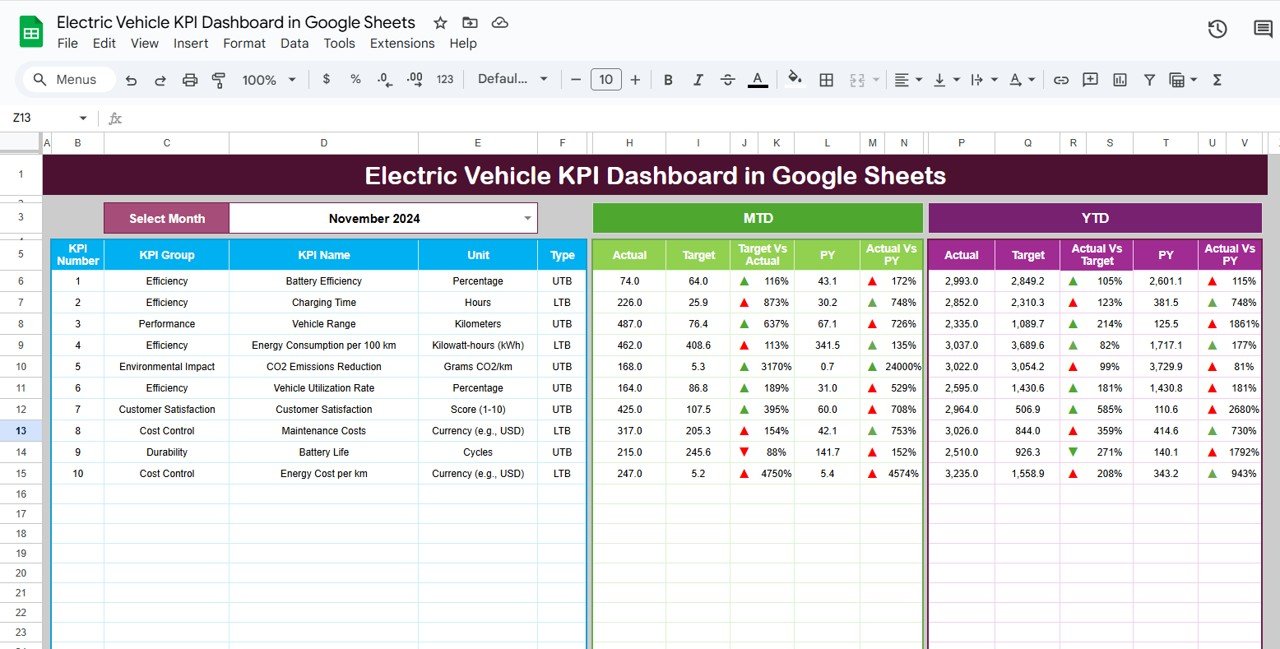
🧭 Dashboard Sheet Tab – EV Performance Overview
This is the main dashboard where all KPIs are displayed clearly.
Key Highlights:
-
Month selector in cell D3
-
Automatic KPI refresh on month selection
-
MTD and YTD tracking
-
Target vs Actual comparison
-
Previous Year vs Actual comparison
-
Conditional formatting with up/down arrows
KPI Views Include:
-
MTD Actual vs Target
-
MTD Actual vs Previous Year
-
YTD Actual vs Target
-
YTD Actual vs Previous Year
As a result, performance gaps and improvements become instantly visible.
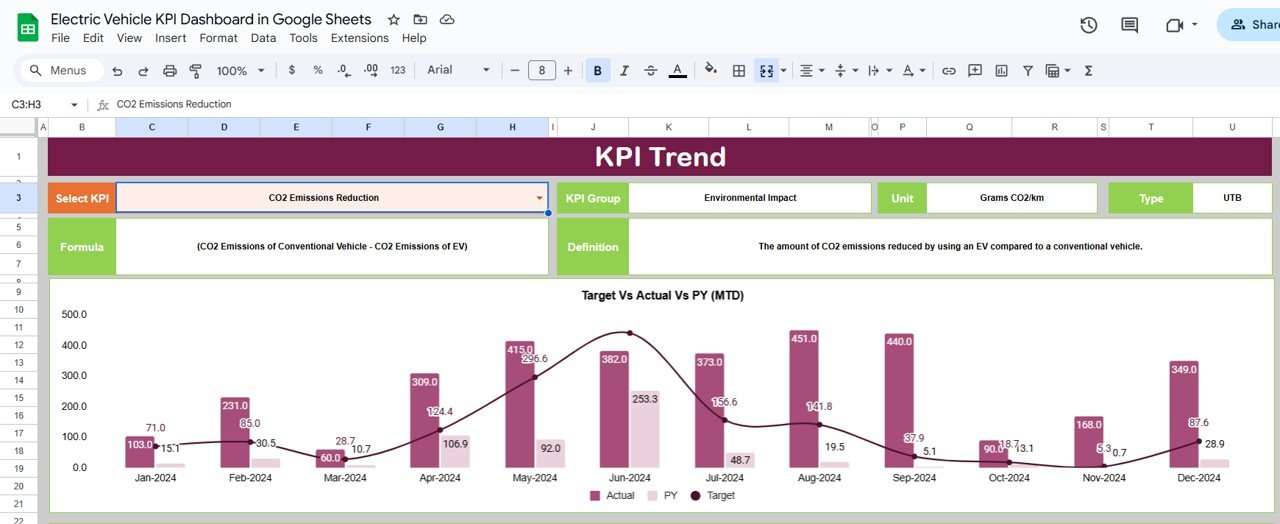
📈 KPI Trend Sheet Tab – KPI Intelligence Layer
This sheet explains each KPI in detail and shows its behavior over time.
What You Can Analyze:
-
KPI selection dropdown (Cell C3)
-
KPI Group
-
Unit of Measurement
-
KPI Type
-
UTB (Upper the Better)
-
LTB (Lower the Better)
-
-
KPI Formula
-
KPI Definition
This sheet ensures that all stakeholders clearly understand what each KPI means and why it matters.
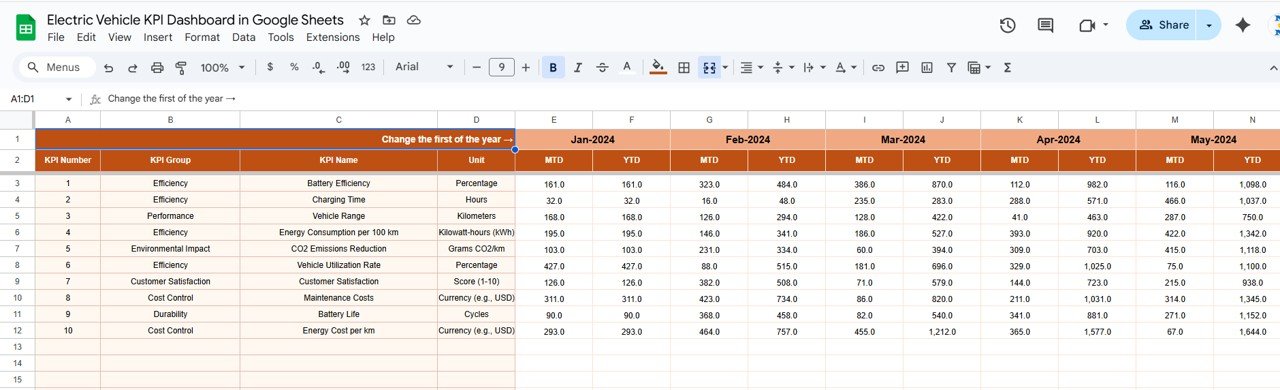
🗂️ Actual Number Sheet Tab – Simple Data Entry
This sheet is used to enter current year EV performance data.
How It Works:
-
Select the first month of the year in cell E1
-
Enter MTD and YTD actual values for each KPI
-
Dashboard and trend sheets update automatically
No complex formulas are required from the user side.
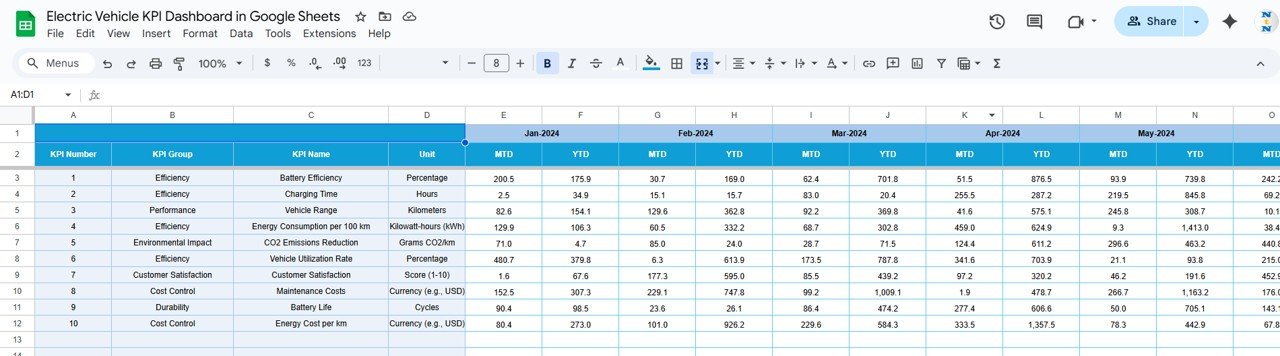
🎯 Target Sheet Tab – Performance Goals
The Target Sheet allows you to define expected performance levels.
What You Enter:
-
Monthly MTD targets
-
Cumulative YTD targets
Targets drive all variance calculations and performance indicators.
📅 Previous Year Number Sheet Tab – Historical Benchmarking
This sheet stores last year’s EV performance data.
Benefits:
-
Enables year-over-year analysis
-
Highlights growth, decline, or stability
-
Supports long-term planning and forecasting
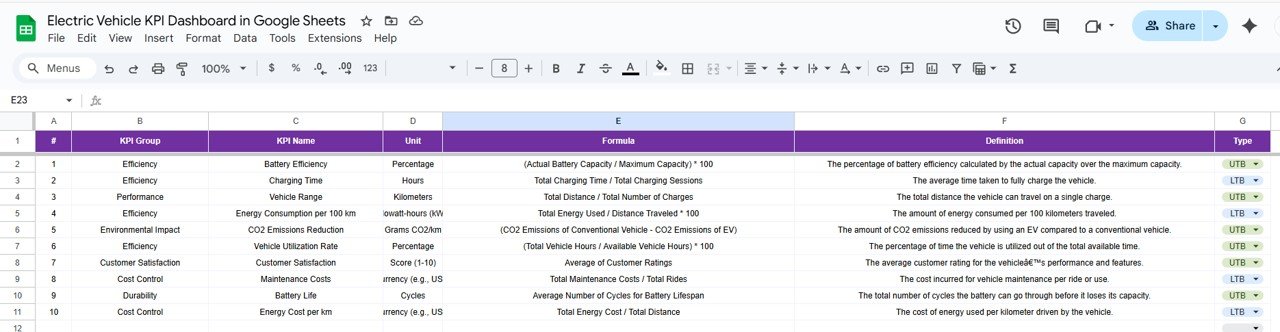
📘 KPI Definition Sheet Tab – Governance & Consistency
This sheet acts as the KPI master reference.
Columns Included:
-
KPI Name
-
KPI Group
-
Unit
-
Formula
-
KPI Definition
-
KPI Type (UTB / LTB)
This ensures consistent KPI interpretation across teams and reporting periods.
👥 Who Can Benefit from This Dashboard
-
EV Fleet Managers
-
Sustainability & ESG Teams
-
Operations Managers
-
Energy & Mobility Consultants
-
Corporate Transportation Departments
-
Smart City & Green Mobility Initiatives
The dashboard works for small EV fleets and large-scale operations alike.
⚙️ How to Use the Electric Vehicle KPI Dashboard
-
Enter actual EV data in the Actual Number sheet
-
Define targets and previous year values
-
Select the reporting month
-
Review MTD and YTD KPIs
-
Analyze trends and performance gaps
-
Take action based on insights
No advanced Google Sheets skills required.


Reviews
There are no reviews yet.