Managing elder care services is not just about operations—it is about care quality, safety, compliance, and accountability. Yet, many elder care organizations still struggle with scattered Excel files, manual MIS reports, and delayed performance insights. As a result, leaders often react late instead of acting proactively.
That is exactly where the Elder Care Services KPI Dashboard in Power BI becomes a game-changer 🚀.
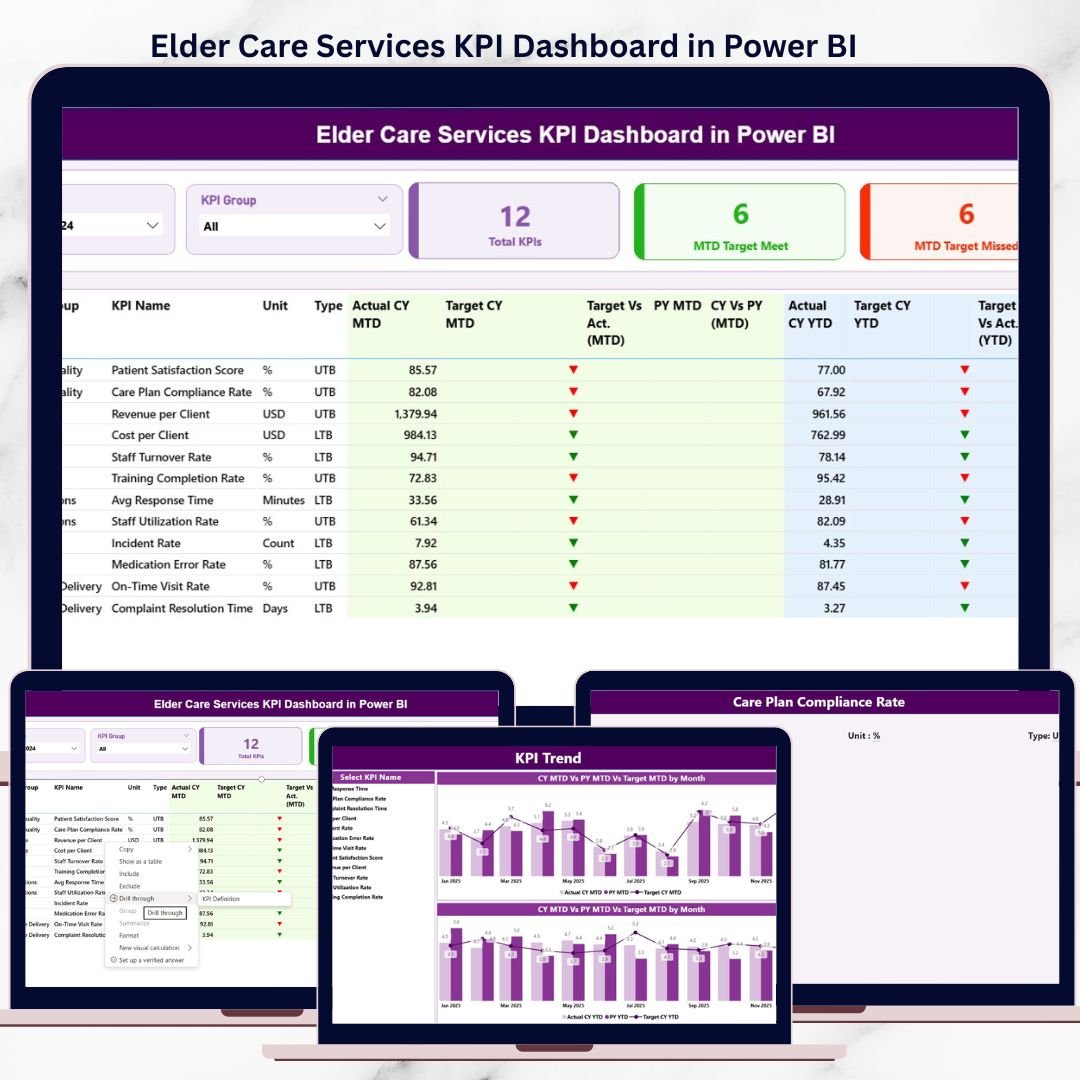
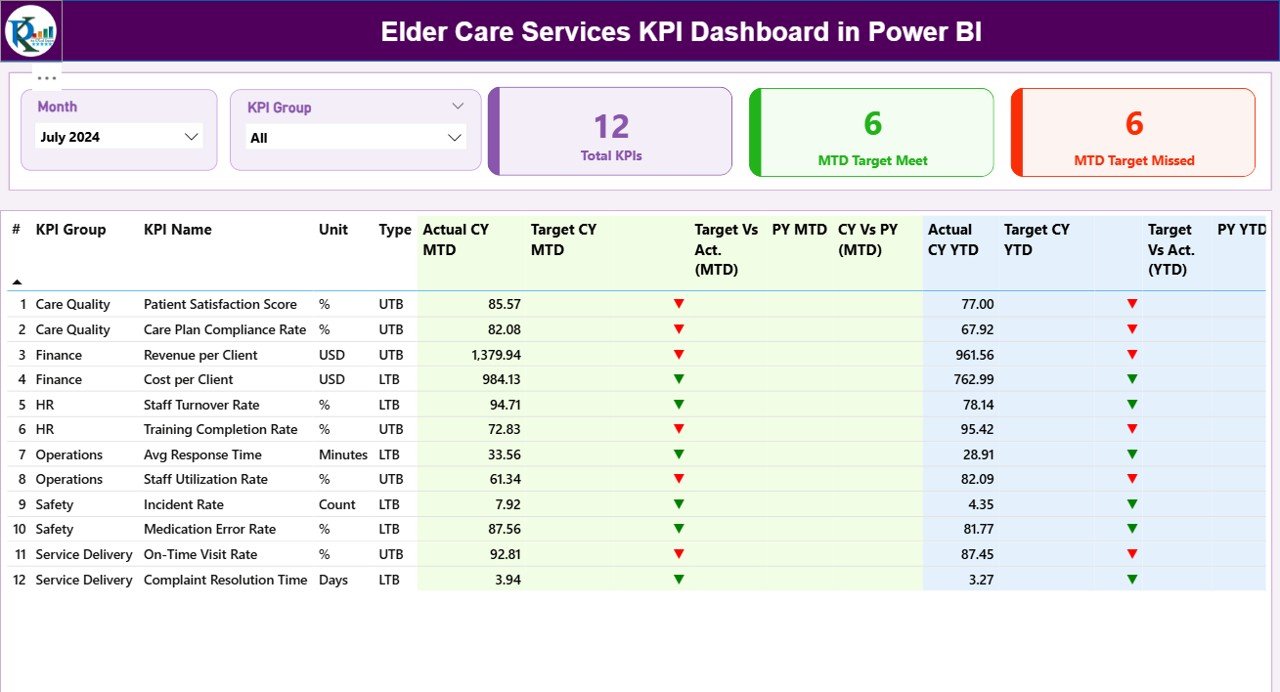
This ready-to-use Power BI dashboard transforms raw elder care data into clear, visual, and actionable insights. It enables administrators, care managers, and leadership teams to track service quality, caregiver performance, compliance metrics, and financial efficiency—all from one centralized dashboard.
With this dashboard, you move away from guesswork and start managing elder care services with confidence, clarity, and control.
🔑 Key Features of Elder Care Services KPI Dashboard in Power BI
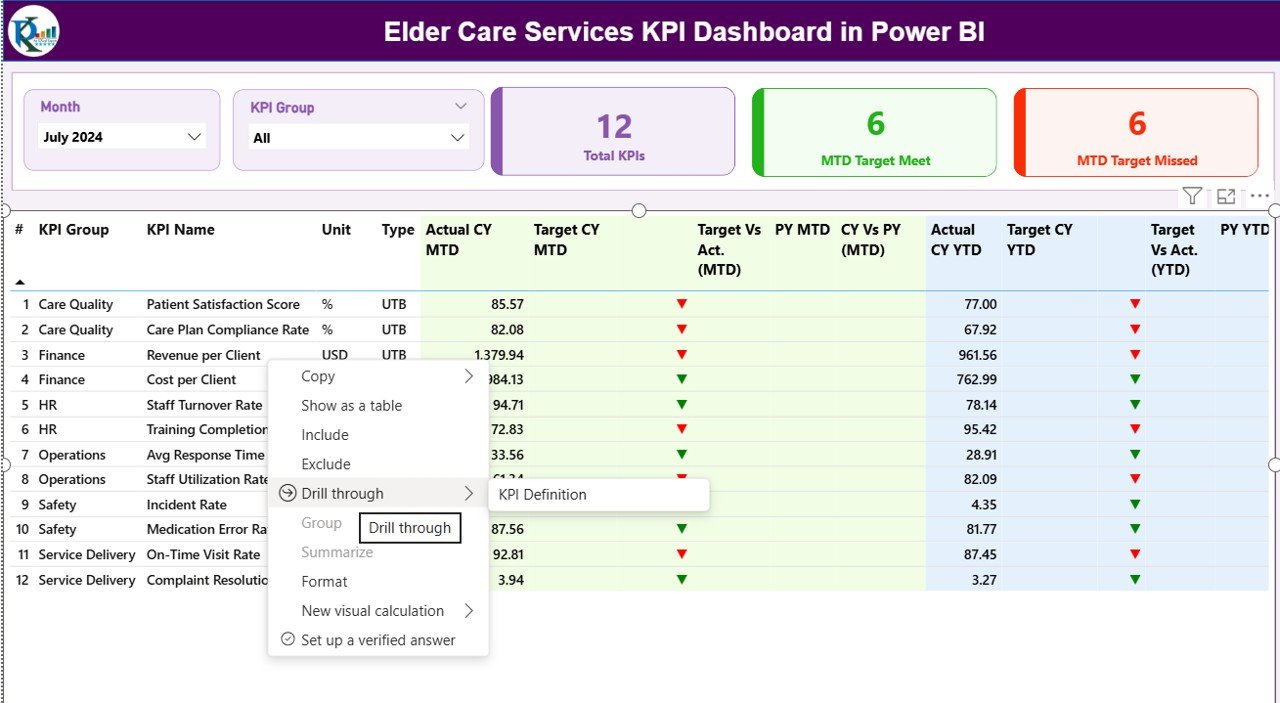
✅ Centralized KPI Monitoring – Track all elder care KPIs in one interactive Power BI dashboard
📊 MTD & YTD Performance Tracking – Instantly compare current performance with targets and previous year data
🟢🔴 Smart Status Indicators – Visual icons highlight target met and missed KPIs
🎯 Target vs Actual Analysis – Identify gaps before they impact care quality
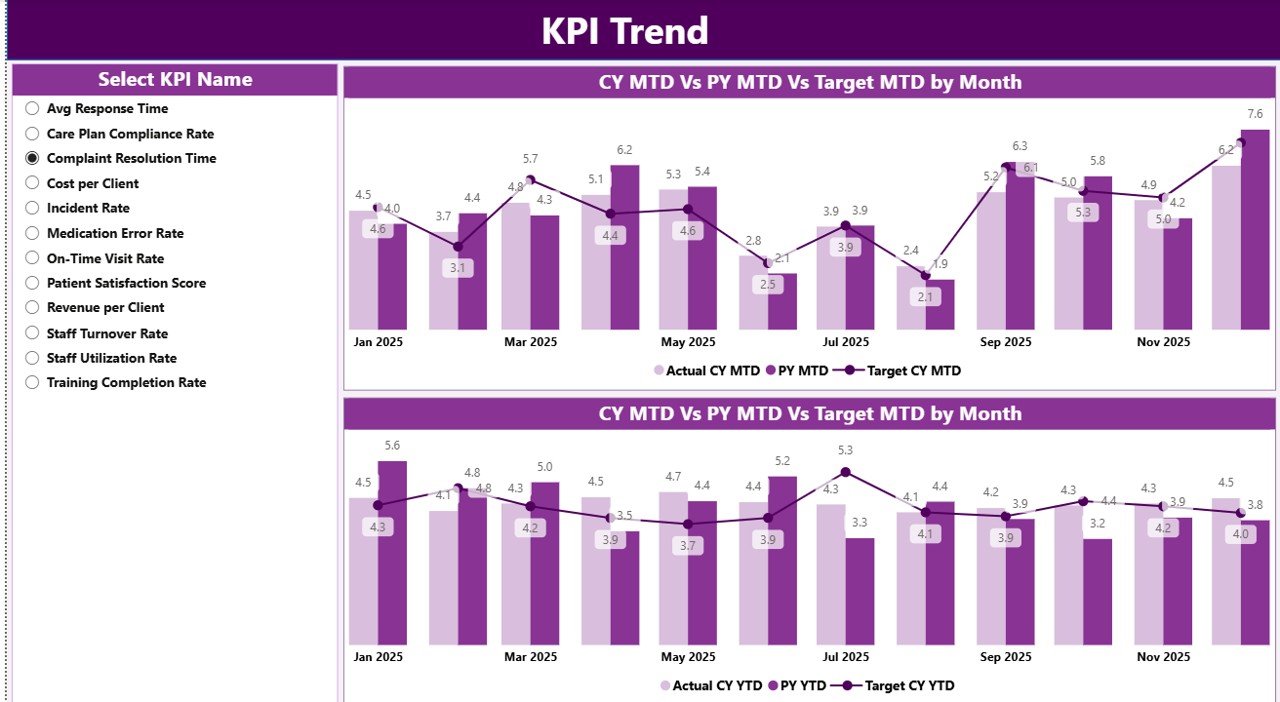
📈 Trend Analysis – Monitor KPI trends over time using dynamic charts
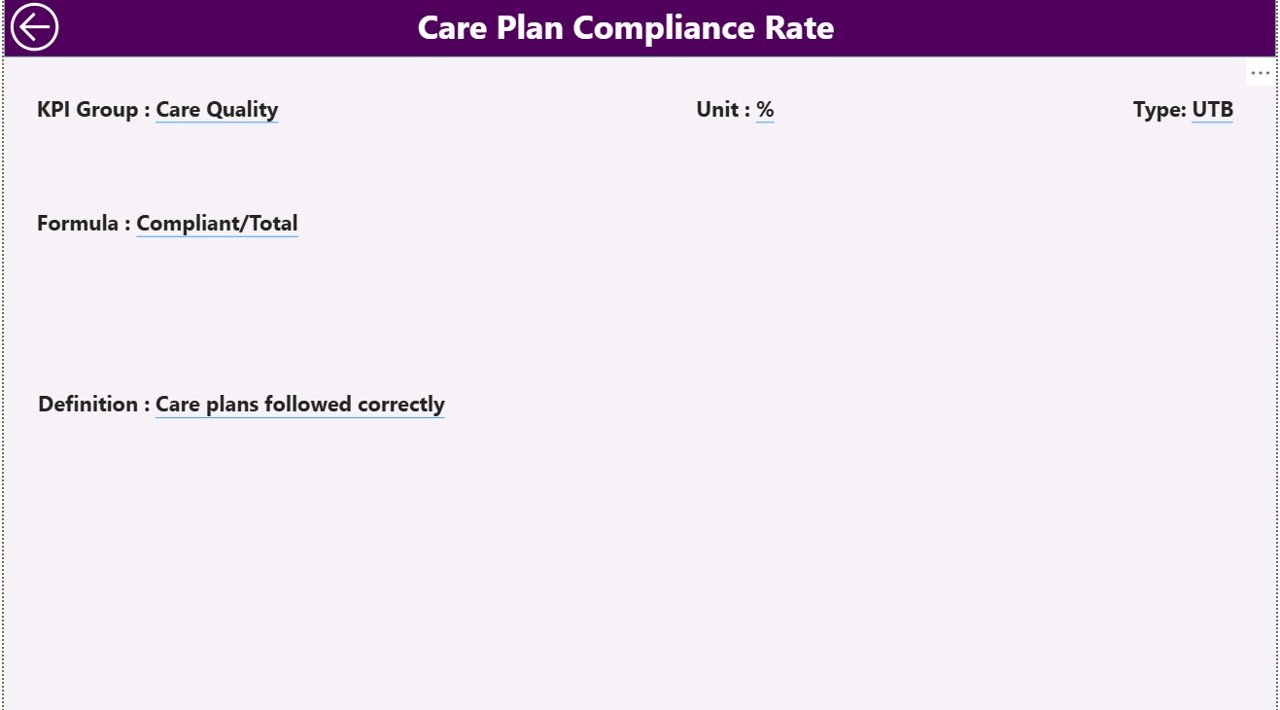
🔍 Drill-Through KPI Definitions – Understand formulas, logic, and KPI intent instantly
🧠 LTB & UTB Logic Applied – Accurate performance evaluation using Lower-the-Better and Upper-the-Better logic
⚡ Excel-Driven Data Model – Update data easily without touching Power BI visuals
📦 What’s Inside the Elder Care Services KPI Dashboard
📁 Power BI Dashboard File (.pbix) with 3 professionally designed pages
📄 Excel Data Source File with structured input sheets
🧾 KPI Definition Sheet containing KPI logic, formulas, and descriptions
📊 Summary Page with KPI cards, slicers, and detailed performance table
📈 KPI Trend Page showing MTD and YTD performance trends
📘 KPI Definition Drill-Through Page for better KPI understanding
🔁 Month & KPI Group Slicers for instant filtering
🧠 Pre-built Measures & Calculations – No DAX writing needed
Everything is designed to work out of the box.
🛠️ How to Use the Elder Care Services KPI Dashboard
1️⃣ Update the Excel File – Enter monthly actuals and targets in predefined sheets
2️⃣ Refresh Power BI – Click refresh to update all visuals automatically
3️⃣ Use Slicers – Filter by Month and KPI Group instantly
4️⃣ Analyze Performance – Review MTD and YTD results with visual indicators
5️⃣ Drill Through KPIs – Click any KPI to understand its formula and definition
6️⃣ Take Action – Identify gaps, trends, and improvement areas early
No advanced Power BI skills required. Even non-technical users can operate it confidently.
👥 Who Can Benefit from This Elder Care Services KPI Dashboard?
🏥 Elder Care Administrators – Monitor service quality and compliance
👩⚕️ Care Managers – Track caregiver performance and care delivery efficiency
📋 Quality Assurance Teams – Identify compliance gaps early
💰 Finance Managers – Control costs and monitor financial KPIs
🏢 Senior Leadership – Make informed, data-driven decisions
📊 Operations Teams – Improve accountability and performance visibility
Whether you manage a small elder care facility or a large care network, this dashboard scales effortlessly.
Click here to read the Detailed blog post
Watch the step-by-step video tutorial:
Visit our YouTube channel to learn step-by-step video tutorials
YouTube.com/@PKAnExcelExpert


Reviews
There are no reviews yet.