Managing elder care services is not just about operations—it is about quality, safety, compliance, and resident satisfaction. However, when data is scattered across registers, basic Excel files, or manual reports, decision-making becomes slow and reactive.
That is where the Elder Care Services KPI Dashboard in Excel becomes a game-changer.
This ready-to-use Excel dashboard transforms raw elder care data into clear, visual, and actionable insights. Instead of spending hours preparing reports, managers can instantly monitor performance, identify risks, and take timely actions—all from one professional dashboard.
Designed specifically for elder care centers, nursing homes, and assisted living facilities, this dashboard helps you stay in control of service quality, staff performance, safety metrics, and operational efficiency.
⭐ Key Features of Elder Care Services KPI Dashboard in Excel
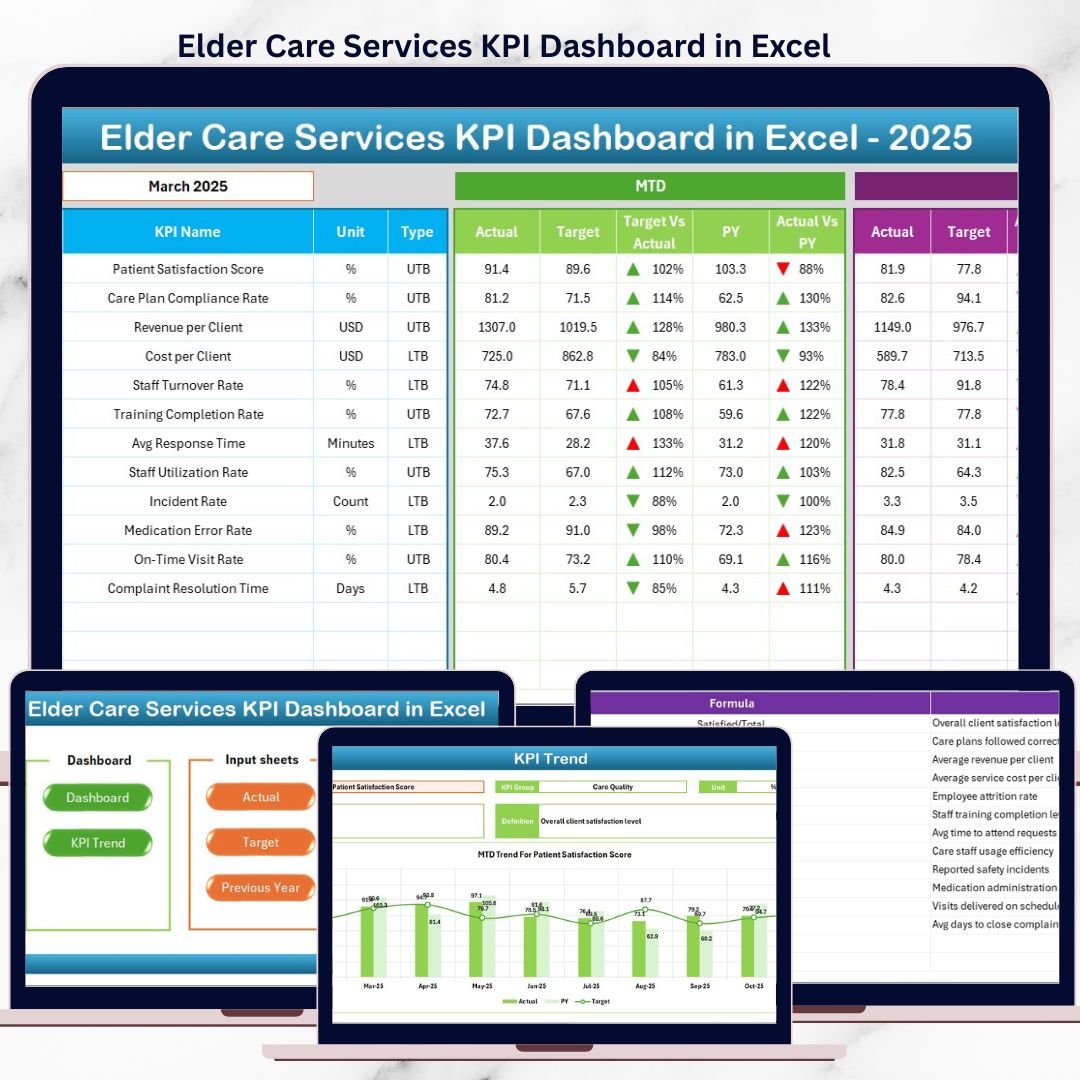
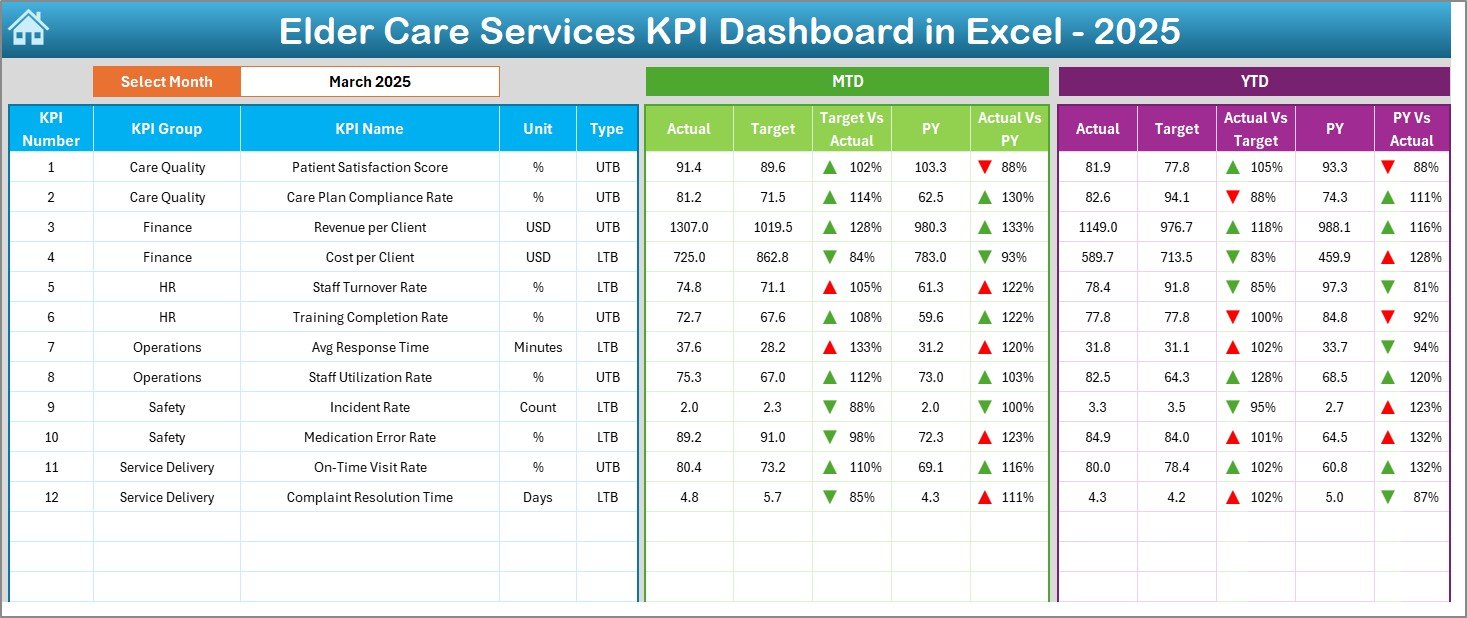
📊 Interactive KPI Dashboard
Monitor all critical elder care KPIs in one centralized Excel dashboard.
📅 Month Selection Control
Change the month once and watch the entire dashboard update automatically.
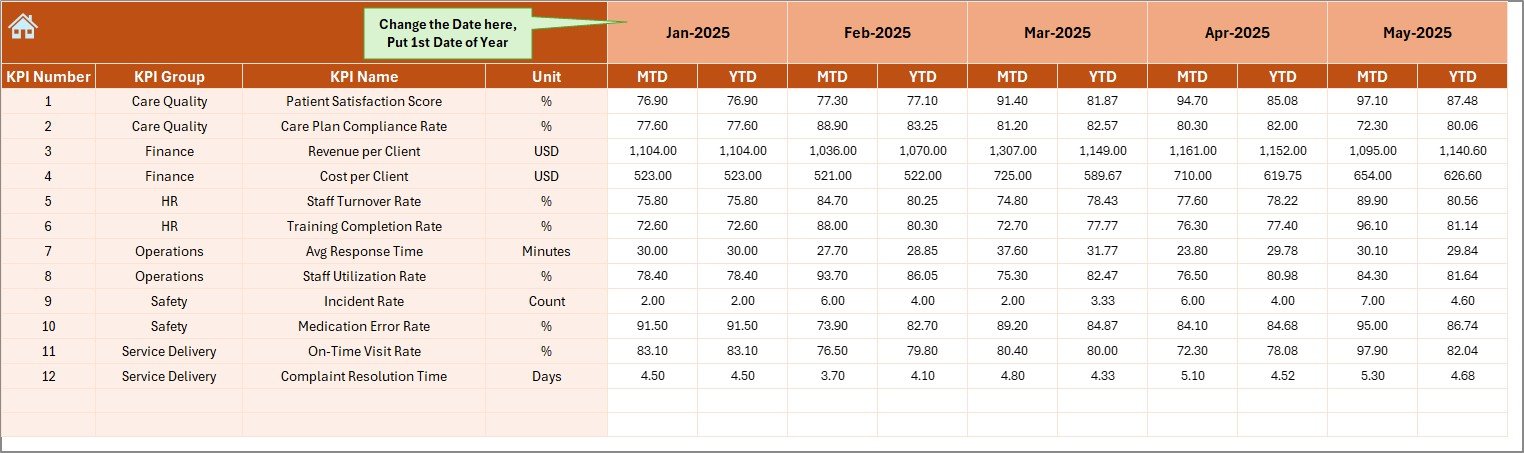
📈 MTD & YTD Performance Tracking
Track Month-to-Date and Year-to-Date performance with real-time calculations.
🎯 Actual vs Target & PY Comparison
Compare current performance against targets and previous year data effortlessly.
🚦 Visual Performance Indicators
Up/down arrows and conditional formatting highlight issues instantly.
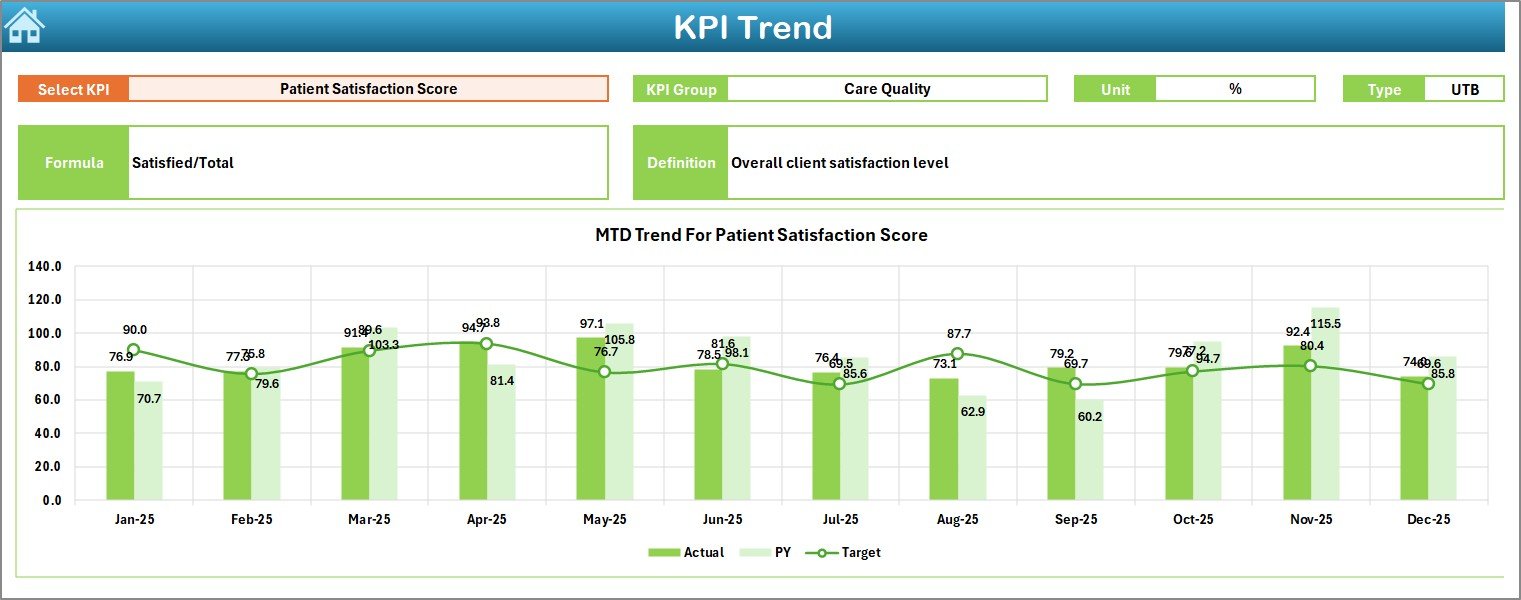
📉 Detailed Trend Analysis
Analyze KPI trends over time to identify improvement or decline patterns.
📘 Standardized KPI Definitions
Clear KPI formulas, definitions, and units ensure consistency across teams.
🧩 Fully Customizable
Add, remove, or modify KPIs easily as per your elder care requirements.
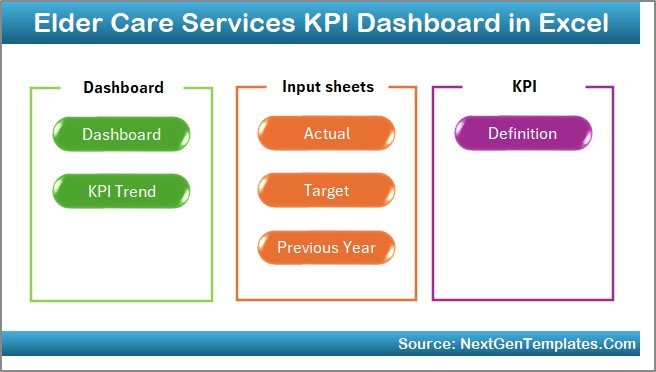
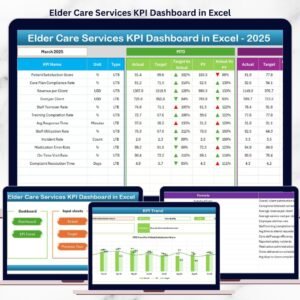
📦 What’s Inside the Elder Care Services KPI Dashboard in Excel?
This dashboard includes 7 professionally structured worksheets, each designed for a specific purpose:
📌 Summary Page – Easy navigation hub with shortcut buttons
📌 Dashboard Sheet – Main KPI performance overview with visual indicators
📌 KPI Trend Sheet – MTD & YTD trend charts for selected KPIs
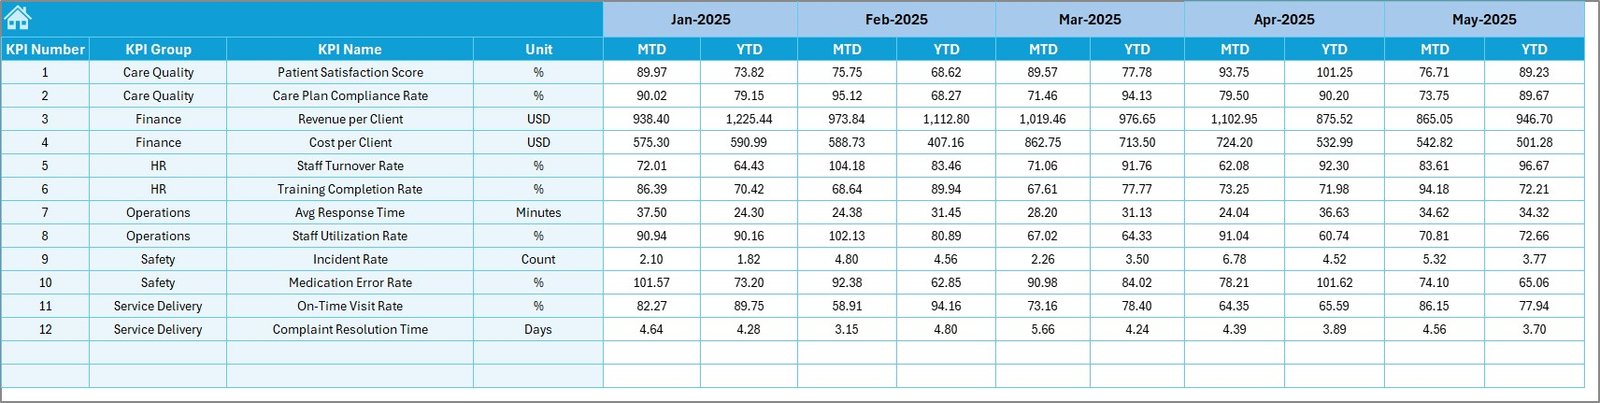
📌 Actual Numbers Input Sheet – Monthly actual data entry
📌 Target Sheet – KPI-wise monthly targets
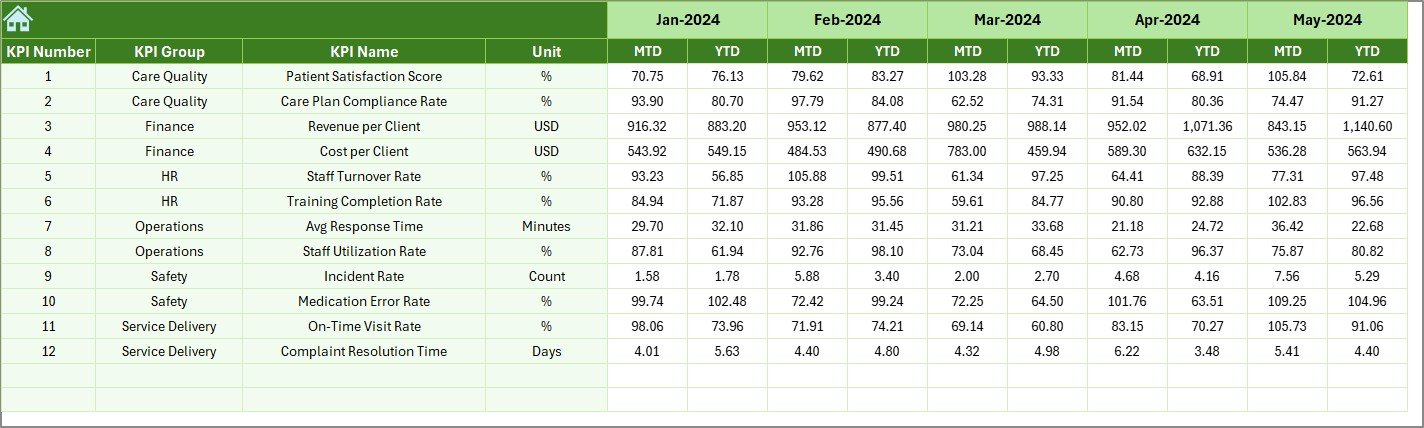
📌 Previous Year Data Sheet – Year-over-year comparison support
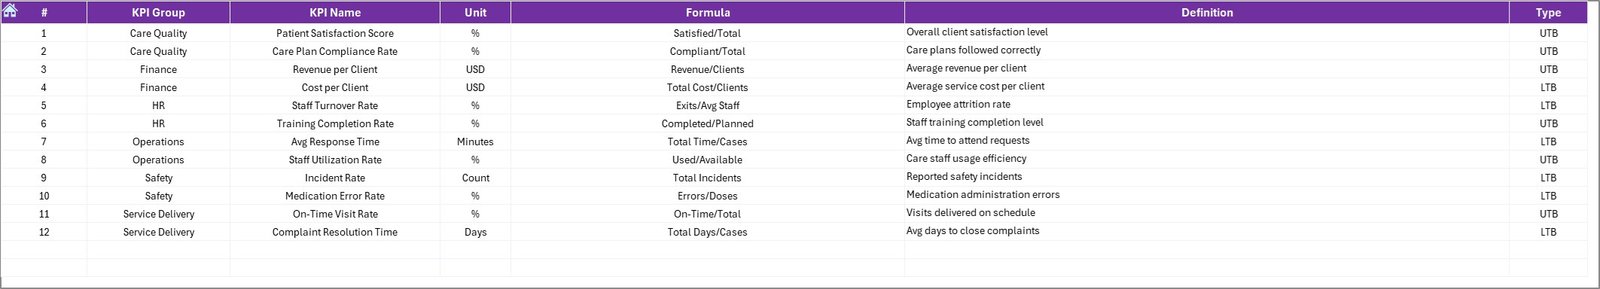
📌 KPI Definition Sheet – KPI groups, units, formulas, and definitions
Together, these sheets create a complete KPI monitoring system for elder care services.
🛠️ How to Use the Elder Care Services KPI Dashboard in Excel
Using this dashboard is simple and requires no advanced Excel skills:
1️⃣ Enter your actual KPI values in the Actual Numbers Input sheet
2️⃣ Define monthly targets in the Target Sheet
3️⃣ Add previous year data for comparison
4️⃣ Select the required month from the dashboard
5️⃣ Instantly review performance using visuals, arrows, and trend charts
Because everything is formula-driven, the dashboard updates automatically—saving time and eliminating manual calculations.
👥 Who Can Benefit from This Elder Care Services KPI Dashboard?
This dashboard is ideal for:
🏥 Elder Care Facility Managers
👩⚕️ Nursing Home Administrators
📋 Quality & Compliance Teams
👨💼 Operations Managers
💰 Finance & Cost Control Teams
🛡️ Safety & Audit Teams
Whether you manage a small elder care center or a large assisted living facility, this dashboard scales easily to your needs.
🚀 Why This Dashboard Is a Must-Have for Elder Care Services
✔ Improves decision-making with real-time insights
✔ Enhances resident care quality and safety
✔ Reduces reporting time significantly
✔ Increases accountability through targets
✔ Supports audits and compliance checks
✔ Easy adoption due to Excel familiarity
This is not just a dashboard—it is a decision-support system for elder care excellence.
Click here to read the Detailed blog post
Watch the step-by-step video tutorial:
Visit our YouTube channel to learn step-by-step video tutorials and dashboard walkthroughs.


Reviews
There are no reviews yet.