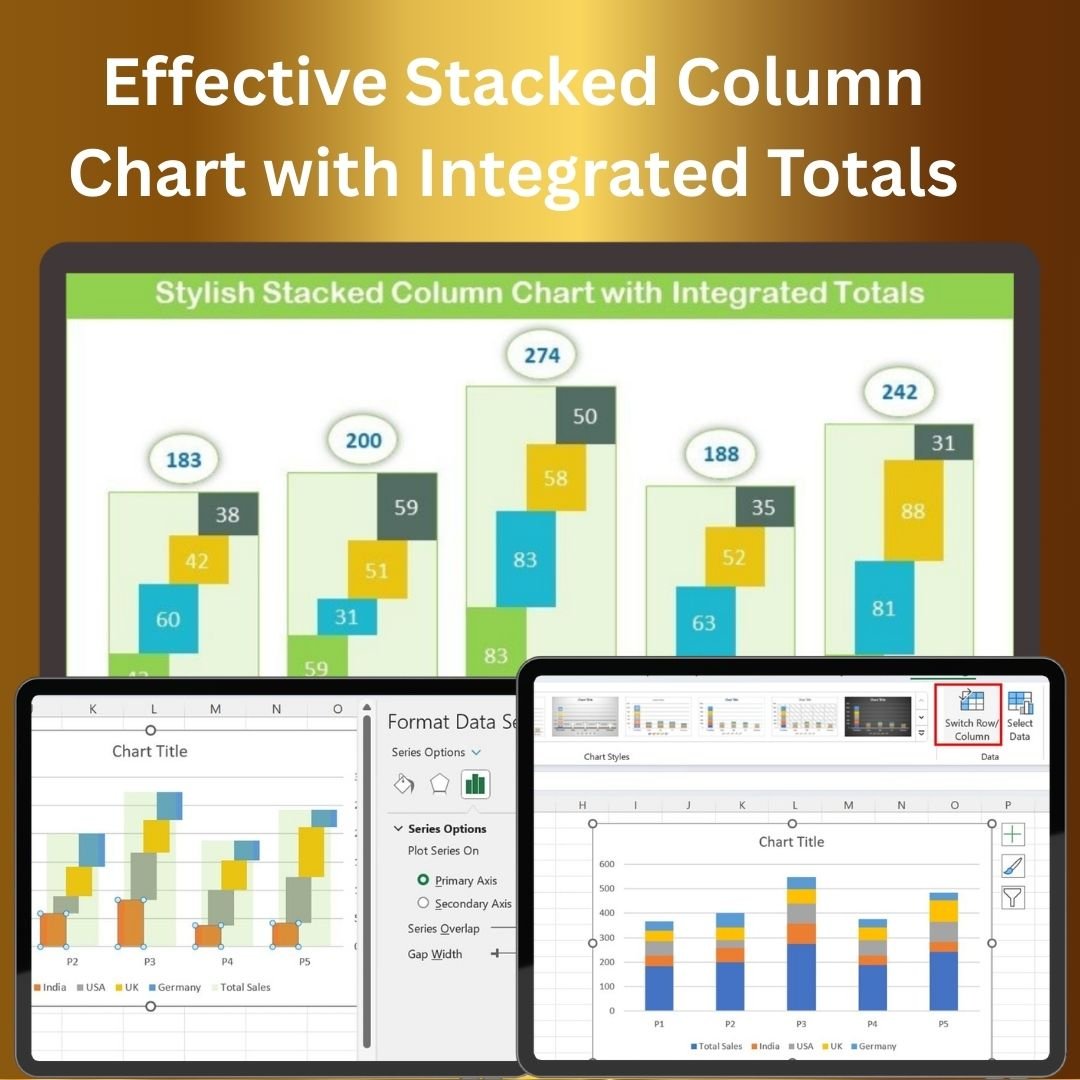


The Effective Stacked Column Chart with Integrated Totals in Excel is a powerful and visually engaging tool designed to help you track and analyze data with ease. This template allows you to create stacked column charts that display individual data series, while simultaneously integrating totals at the top for a comprehensive view of your metrics. This feature makes it perfect for businesses and analysts who need to track multiple categories or groups, and also need to quickly see the sum of the components.
With customizable options, the stacked column chart is ideal for visualizing project milestones, sales performance, or financial data. It’s easy to set up and provides an efficient way to present data in a more informative and visually engaging manner. The integrated totals ensure that you not only see the breakdown of your data but also have an overall view of the combined performance or progress at a glance.
Key Features of the Effective Stacked Column Chart with Integrated Totals
📌 Stacked Column Chart Design
The stacked column chart allows you to display data from multiple categories in a single visual, stacking the values within each column. This makes it easier to compare the contribution of individual components to the overall total.
🛠 Integrated Totals
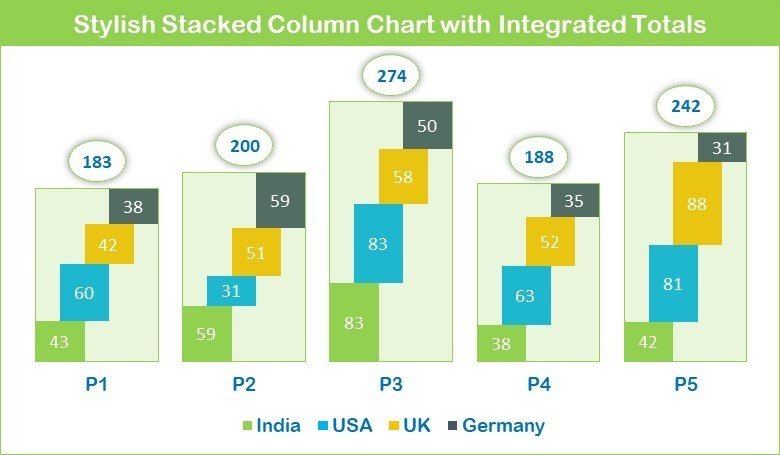
One of the unique features of this chart is the integration of totals at the top of each column. This makes it easy to see the overall sum of the values at a glance, enhancing the clarity of your data presentation.
💡 Customizable Data Series
You can adjust the number of data series, colors, and labels to match your needs. Whether you’re tracking sales by region, expenses by category, or tasks by department, you can modify the chart to fit your specific data.
🔢 Real-Time Data Updates
The chart updates automatically as new data is entered, ensuring your totals and breakdowns are always current. This makes it perfect for tracking progress over time, monitoring performance, or updating business reports.
🚀 Clear Data Visualization
The stacked column format provides a clear view of how different components contribute to the total. With integrated totals, it’s easier to analyze trends, identify areas of improvement, and present key insights to stakeholders.
📊 Multiple Use Cases
From financial analysis to project management, this stacked column chart can be applied in various contexts, such as tracking monthly sales, departmental budget allocations, or tracking progress toward a goal.
⚙ Easy Setup and Customization
The template is designed to be easy to set up, with clear instructions and a user-friendly interface. It’s perfect for Excel users of all skill levels, allowing you to quickly implement and customize the chart for your needs.
🚀 Why You’ll Love the Effective Stacked Column Chart with Integrated Totals
✅ Visual and Informative – Display data series in a stacked column format and see totals at the top for quick analysis. ✅ Customizable and Flexible – Adapt the chart to fit different types of data and categories. ✅ Real-Time Updates – Automatically adjust as new data is added, keeping your chart current and accurate. ✅ Clear and Concise – Easily visualize how individual components contribute to the total. ✅ Easy to Implement – Simple to use, with no advanced Excel skills required for setup or customization.
📂 What’s Inside the Effective Stacked Column Chart with Integrated Totals?
- Stacked Column Chart: A chart that visually breaks down data into individual components within each column.
- Integrated Totals: Display totals at the top of each column to give a quick overview of the entire data set.
- Customizable Labels: Adjust colors, labels, and series to suit your data.
- Real-Time Data Updates: The chart adjusts automatically when new data is entered.
- Clear Setup Instructions: Simple steps to implement and customize the chart for your needs.
🔍 How to Use the Effective Stacked Column Chart with Integrated Totals
1️⃣ Download the Template – Instantly access the Excel file upon purchase. 2️⃣ Input Your Data – Enter your data into the provided fields, and the chart will automatically generate. 3️⃣ Customize the Chart – Modify the labels, colors, and number of data series to fit your specific data. 4️⃣ Track Performance – Use the stacked column format to analyze the breakdown of your data and view the total at a glance. 5️⃣ Present and Share – Use the chart in presentations or reports to showcase your insights in a visually engaging way.
🎯 Who Can Benefit from the Effective Stacked Column Chart with Integrated Totals? 🔹 Business Analysts 🔹 Sales Teams 🔹 Financial Analysts 🔹 Project Managers 🔹 Marketing Teams 🔹 Anyone needing to track data across multiple categories or goals
Visualize your data more effectively with the Effective Stacked Column Chart with Integrated Totals in Excel. Perfect for tracking sales, expenses, or project progress, this tool helps you present data in a clear and visually compelling way.
Click here to read the Detailed blog post
https://www.pk-anexcelexpert.com/effective-stacked-column-chart-with-integrated-totals/


Reviews
There are no reviews yet.