The EdTech industry is exploding with data—enrollments, course performance, learner engagement, revenue, dropouts, and growth trends. Yet, many EdTech businesses still struggle to turn this valuable data into clear, actionable insights. Decisions often rely on guesswork instead of facts, slowing growth and impacting learner success.
That is exactly where the EdTech Dashboard in Power BI becomes a must-have analytics solution.
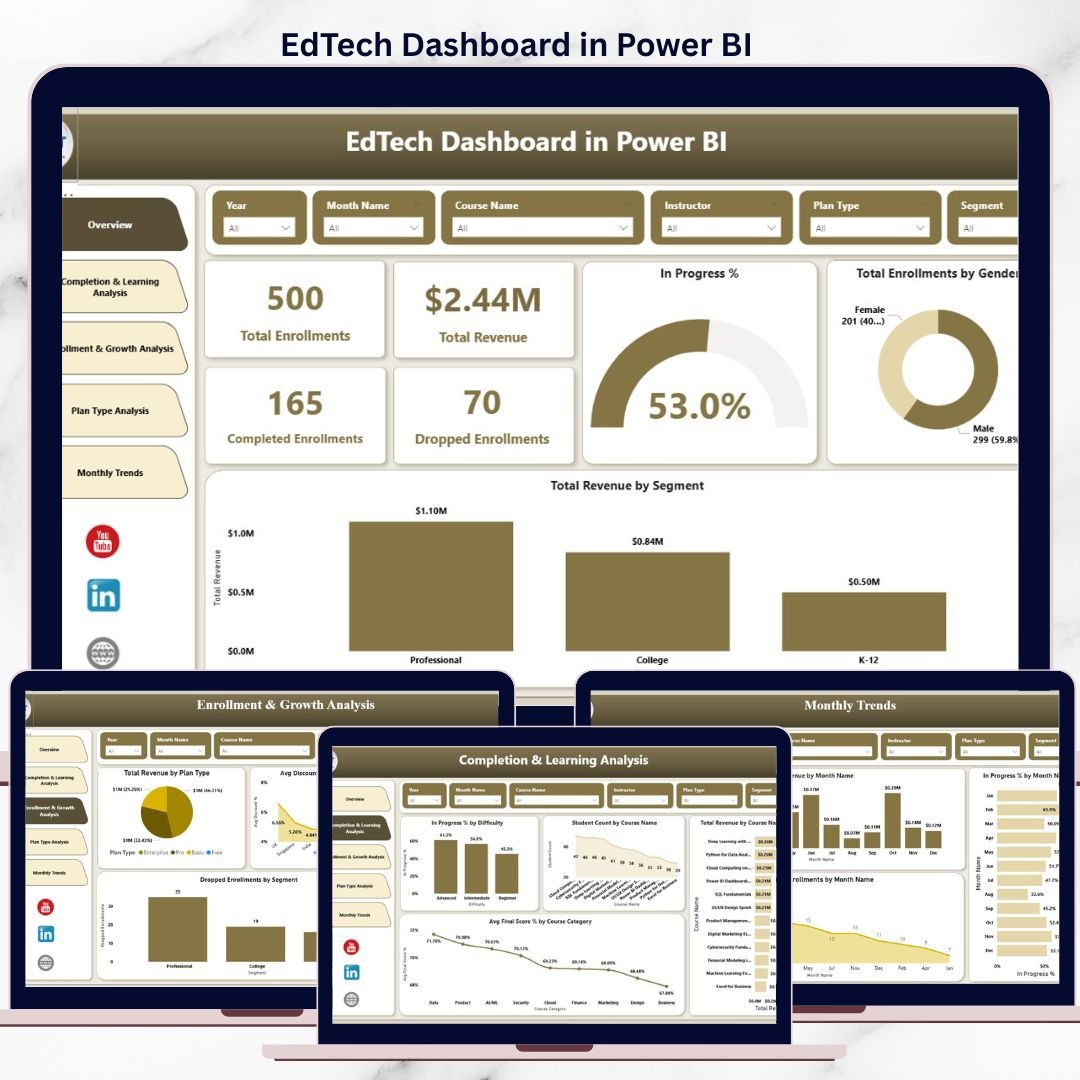
This professionally designed, ready-to-use Power BI dashboard converts complex EdTech data into simple visuals, meaningful trends, and powerful insights. Whether you manage an online learning platform, training institute, or digital education business, this dashboard helps you track performance, boost revenue, and improve learner outcomes—all in one place.
## 🔑 Key Features of EdTech Dashboard in Power BI
📊 All-in-One Performance View – Monitor learner, course, and revenue KPIs from a single interactive dashboard.
⚡ Instant Decision-Making – Get real-time insights with slicers, filters, and drill-downs.
🎯 Learner Performance Tracking – Analyze completion rates, progress percentages, and final scores easily.
💰 Revenue & Enrollment Insights – Understand which courses, plans, and segments drive growth.
📈 Growth & Trend Analysis – Track monthly revenue, enrollments, and engagement trends visually.
🧠 User-Friendly Design – No technical expertise required to explore insights.
🚀 Scalable & Flexible – Works perfectly for startups, growing platforms, and enterprise EdTech organizations.
## 📦 What’s Inside the EdTech Dashboard in Power BI
This Power BI desktop file contains five fully designed analytical pages, each focused on a critical business question:
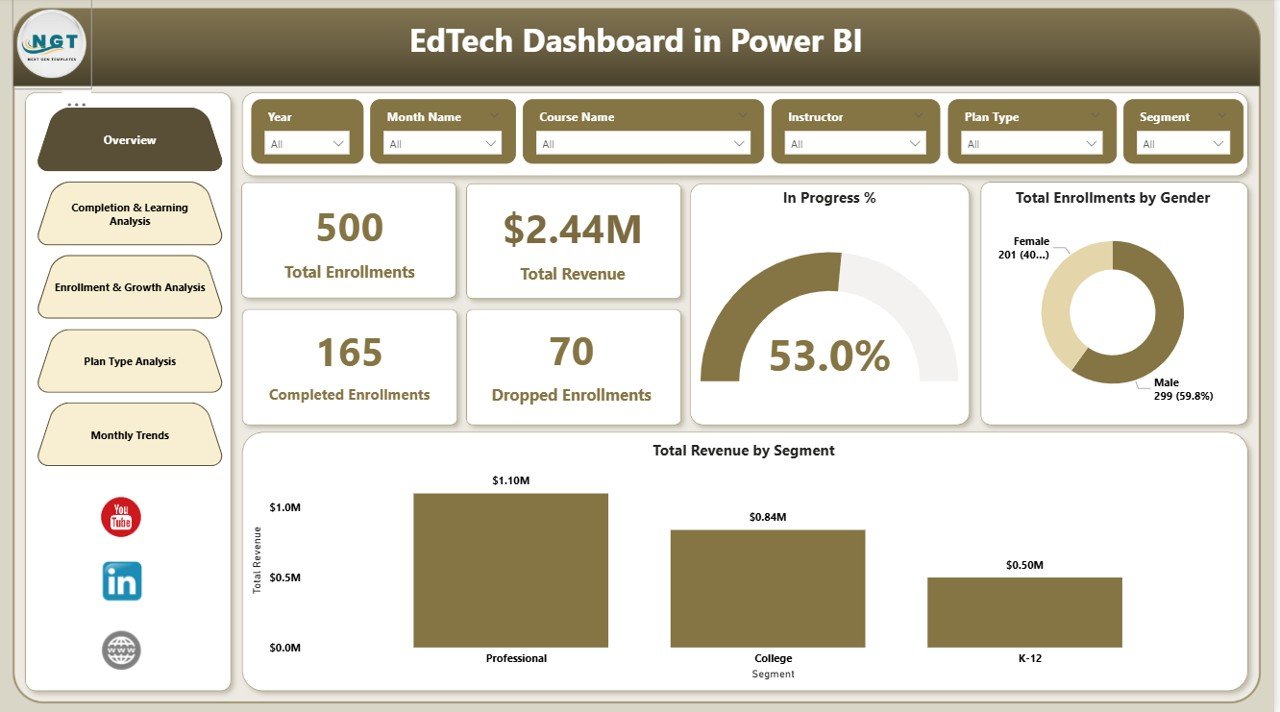
📌 Overview Page – High-level KPIs like total revenue, enrollments, completion status, gender distribution, and revenue by segment.
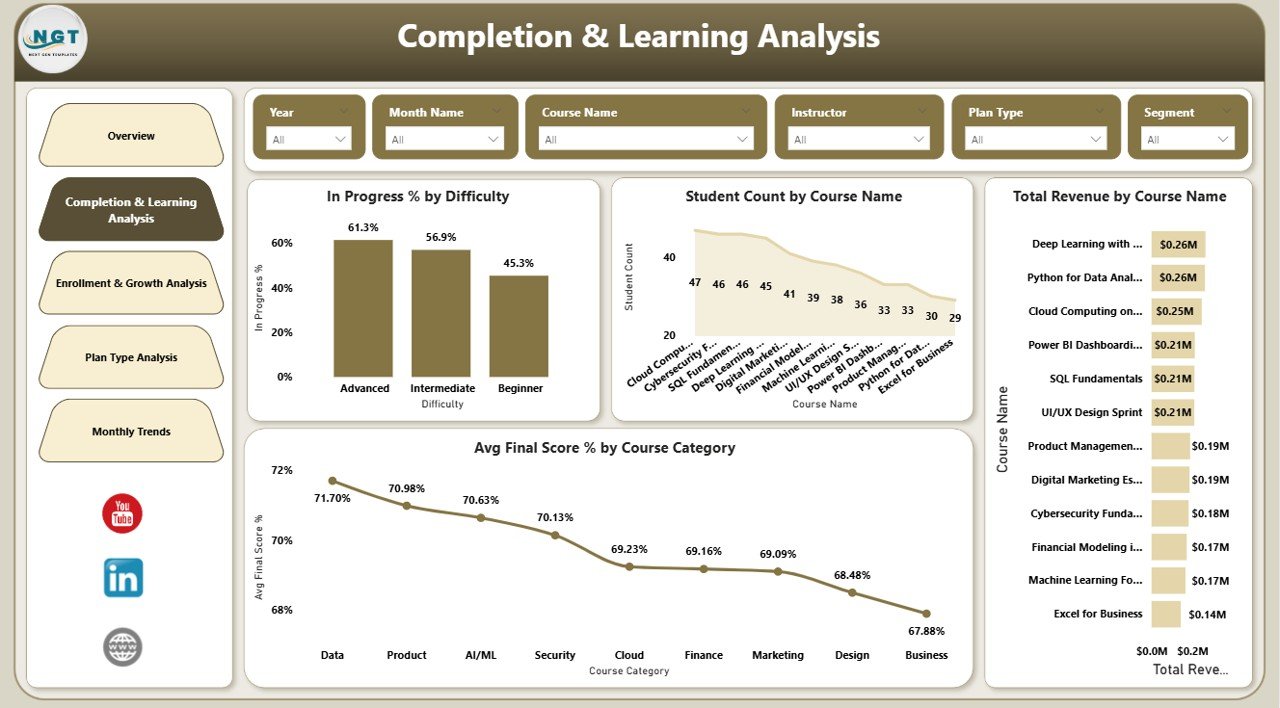
📌 Completion & Learning Analysis – Deep insights into learner progress, course performance, difficulty levels, and average scores.
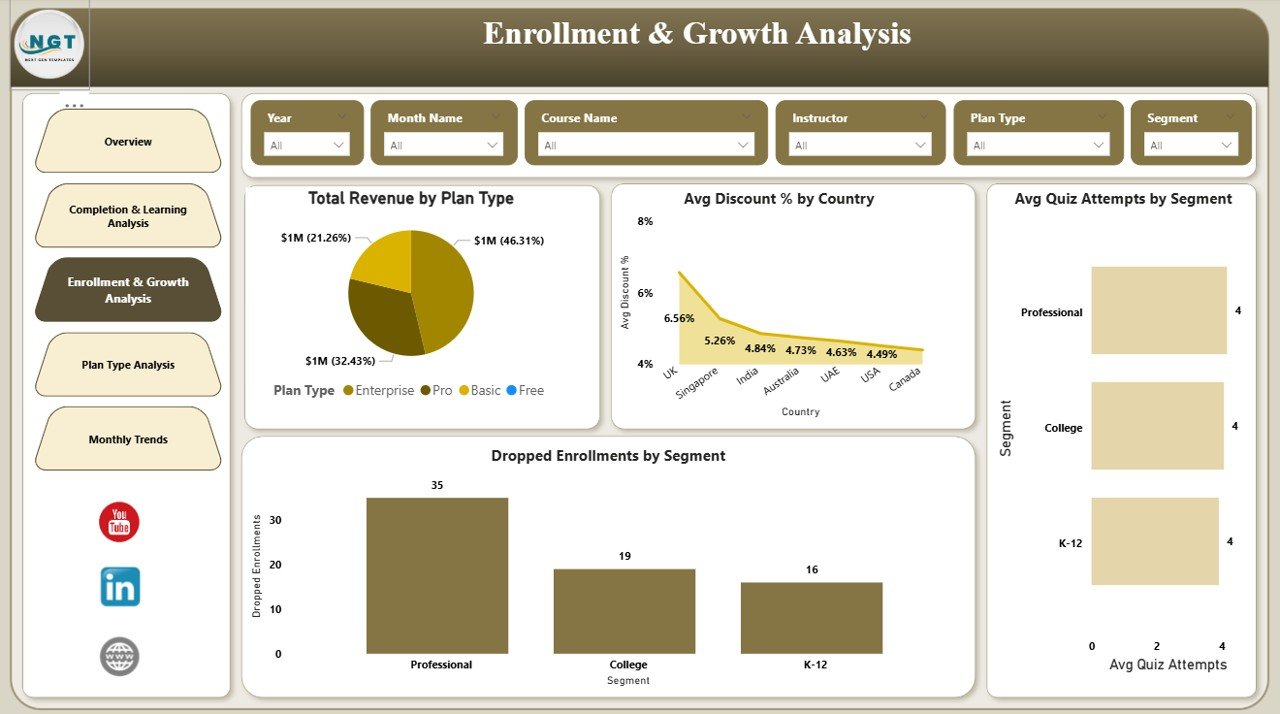
📌 Enrollment & Growth Analysis – Tracks revenue by plan, discounts by country, quiz attempts, and dropout behavior.
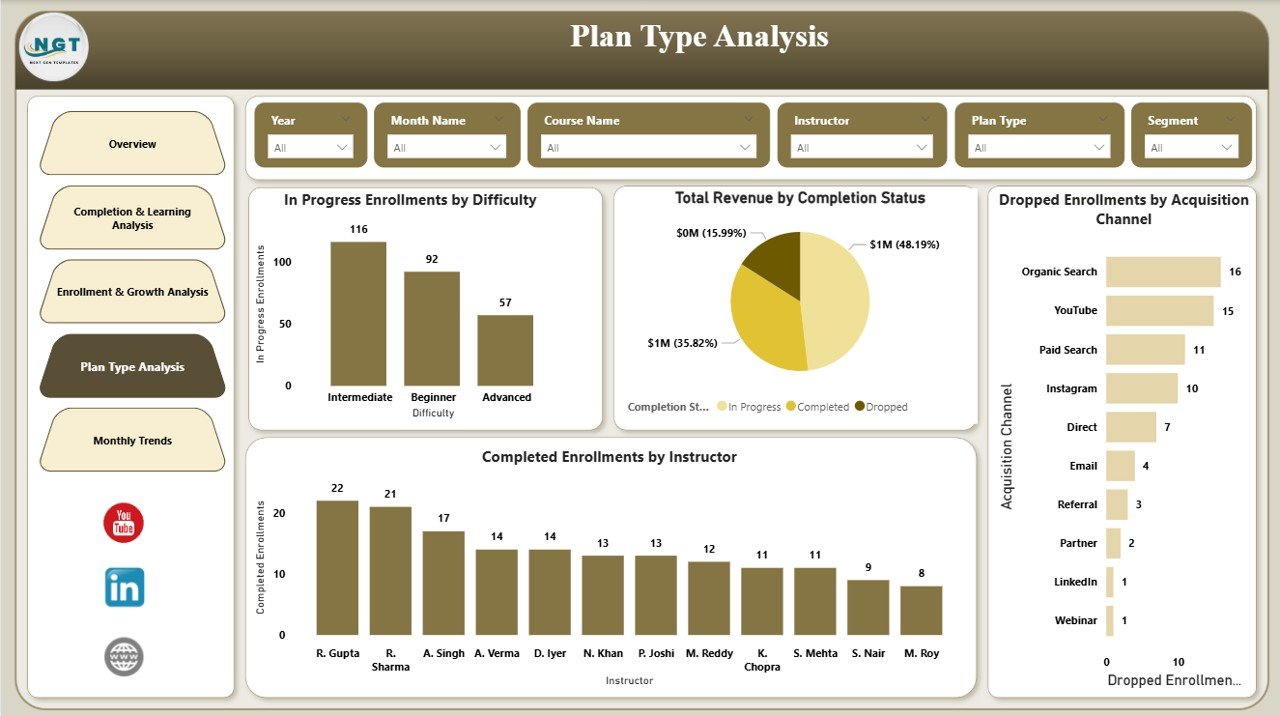
📌 Plan Type Analysis – Evaluates pricing plans, instructor performance, completion status, and acquisition effectiveness.
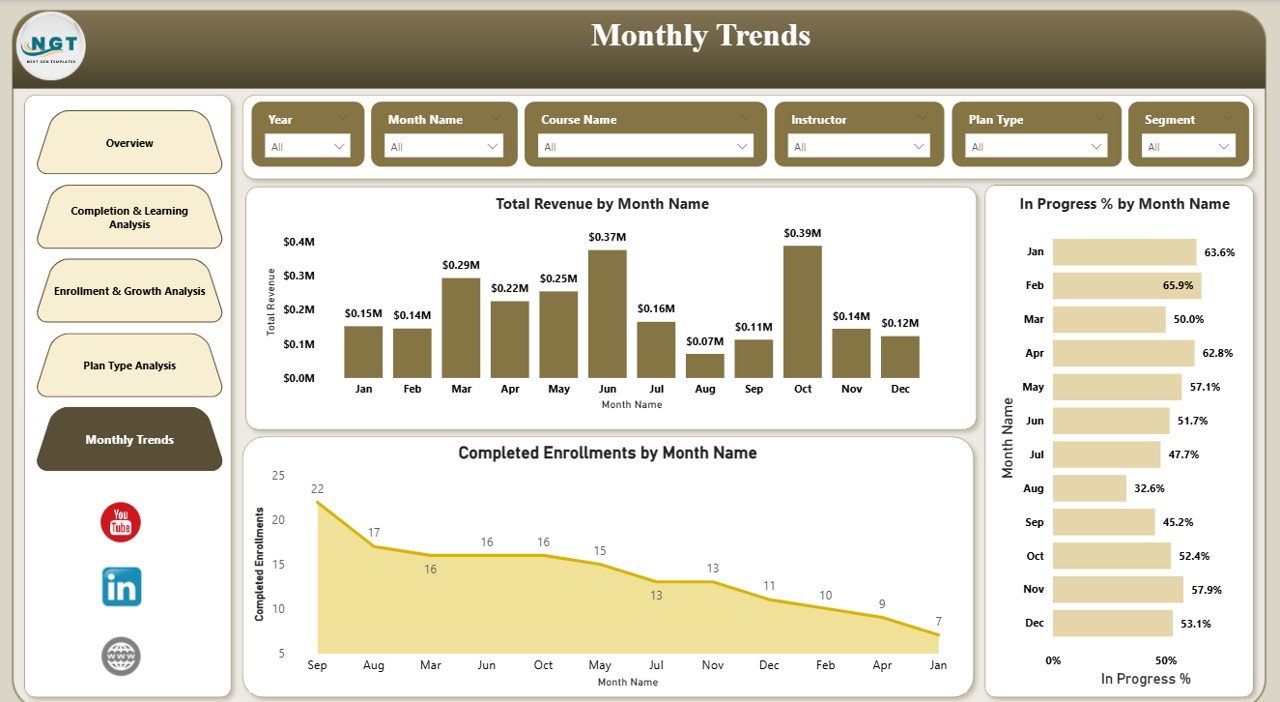
📌 Monthly Trends Page – Visualizes month-by-month revenue, completions, and engagement trends for forecasting.
Together, these pages deliver a 360-degree view of your EdTech ecosystem.
## 🛠️ How to Use the EdTech Dashboard in Power BI
Using this dashboard is simple and fast:
1️⃣ Open the Power BI file.
2️⃣ Connect or refresh your EdTech data source.
3️⃣ Use slicers and filters to explore insights by course, segment, plan, or time period.
4️⃣ Drill down into visuals to identify trends, gaps, and opportunities.
5️⃣ Share insights with stakeholders for faster decision-making.
No coding. No complex setup. Just powerful analytics in minutes.
## 🎓 Who Can Benefit from This EdTech Dashboard in Power BI
👨💼 EdTech Founders & Executives – Make confident, data-driven strategic decisions.
📚 Academic & Learning Managers – Improve learner success and course quality.
👩🏫 Instructors & Content Creators – Understand student performance and engagement.
📢 Sales & Marketing Teams – Optimize plans, pricing, and acquisition strategies.
📊 Data & Business Analysts – Get structured, visual insights without heavy manual work.
If your organization relies on learning data and revenue metrics, this dashboard is built for you.
Watch the step-by-step video tutorial:
Click here to read the Detailed blog post
Visit our YouTube channel to learn step-by-step video tutorials


Reviews
There are no reviews yet.