E-logistics startups operate in a high-speed, data-intensive environment where every delivery delay, cost fluctuation, and customer experience issue directly impacts growth. However, many startups still rely on fragmented Excel sheets, manual tracking, and delayed reports. As a result, leaders lose visibility, miss trends, and react too late.
That is exactly why the E-Logistics Startups KPI Dashboard in Excel is designed as a powerful, ready-to-use performance management solution. This dashboard converts raw operational data into clear KPIs, visual indicators, and actionable insights—all within Excel.
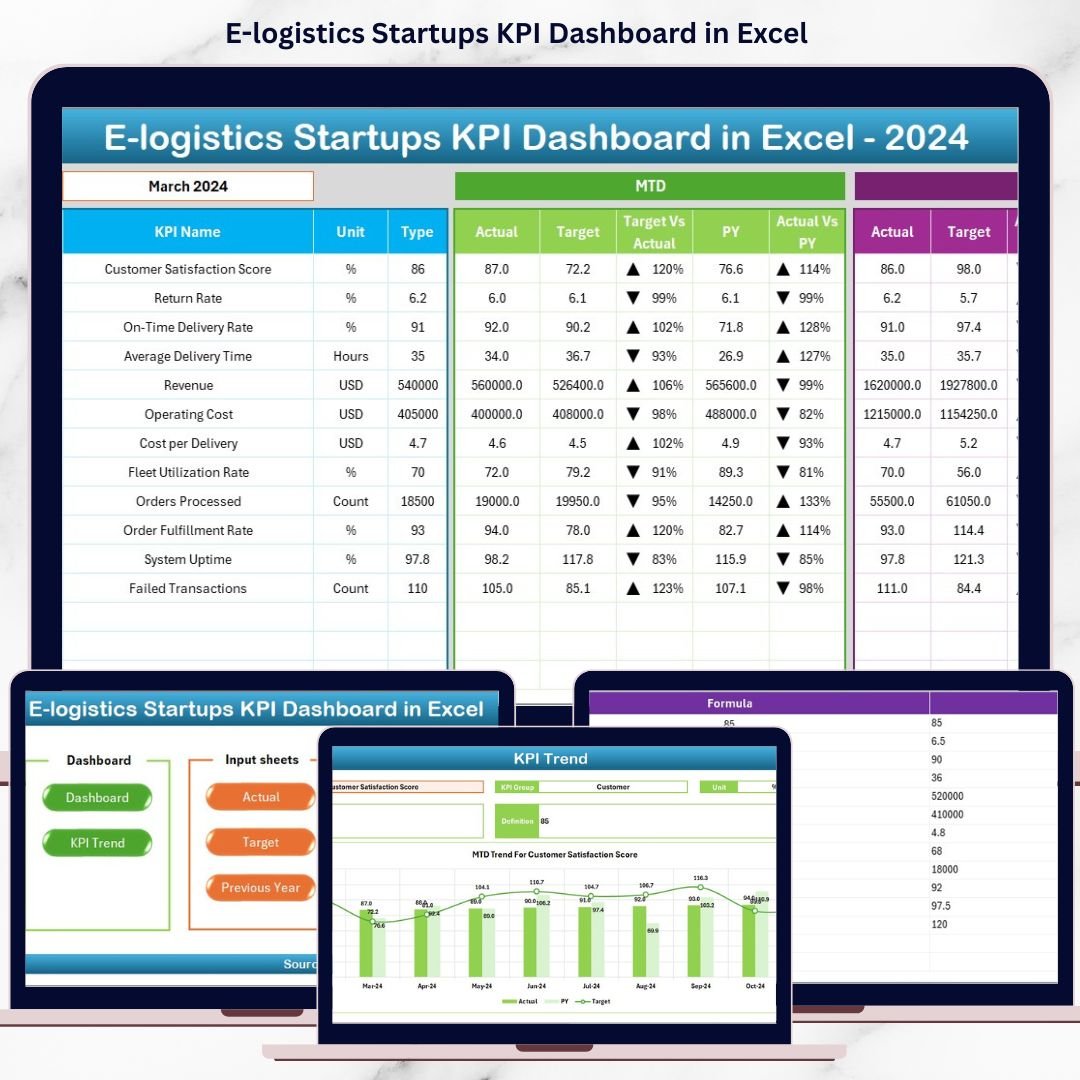
Whether you are managing deliveries, warehouses, costs, or customer experience, this dashboard gives you real-time clarity, structured analysis, and complete control without investing in expensive BI tools.E-logistics Startups KPI Dashboard in Excel
🚀 Key Features of E-Logistics Startups KPI Dashboard in Excel
📊 Centralized KPI Monitoring
Track all operational, financial, warehouse, and customer KPIs in one interactive dashboard instead of juggling multiple reports.
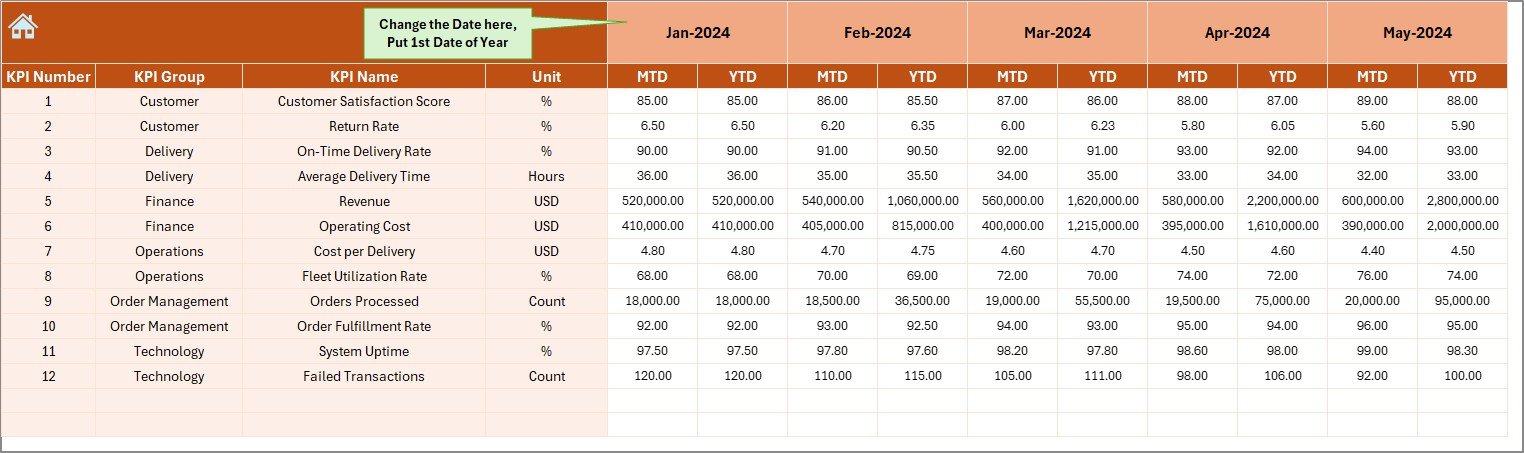
📅 MTD & YTD Performance Tracking
Monitor Month-to-Date and Year-to-Date actuals against defined targets and previous year benchmarks.E-logistics Startups KPI Dashboard in Excel
🎯 Target vs Actual Analysis
Instantly identify over-performing and under-performing KPIs using conditional formatting arrows.
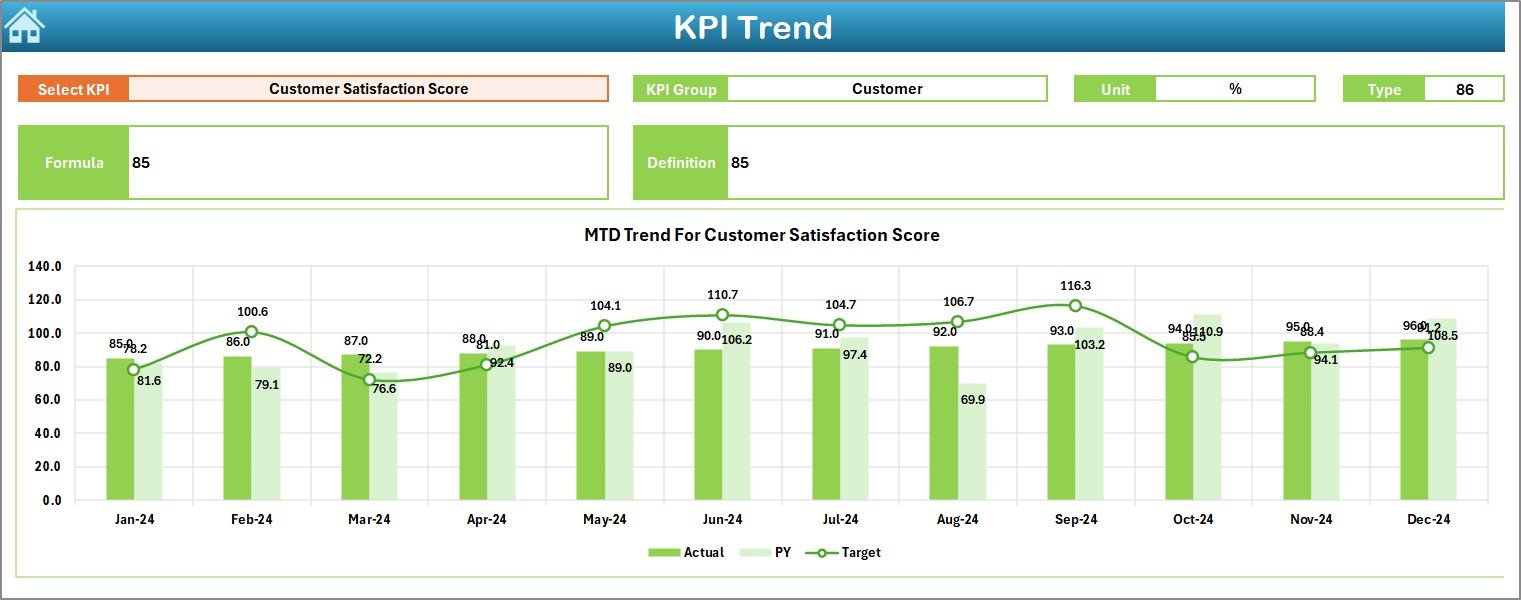
📈 Trend-Based Insights
Analyze KPI trends over time to spot patterns, risks, and improvement opportunities.E-logistics Startups KPI Dashboard in Excel
🧩 Fully Excel-Based & Flexible
Modify KPIs, formulas, and layouts easily without technical complexity.
📌 Investor-Ready Reporting
Present clean, structured performance data to stakeholders with confidence.
📦 What’s Inside the E-Logistics Startups KPI Dashboard in Excel
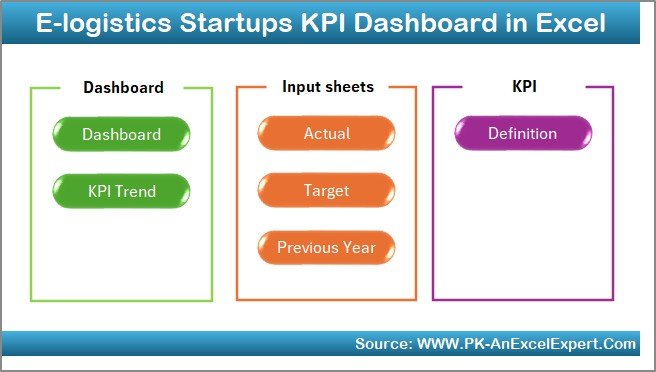
🗂 Summary Page
A user-friendly index page with navigation buttons to access each worksheet quickly.
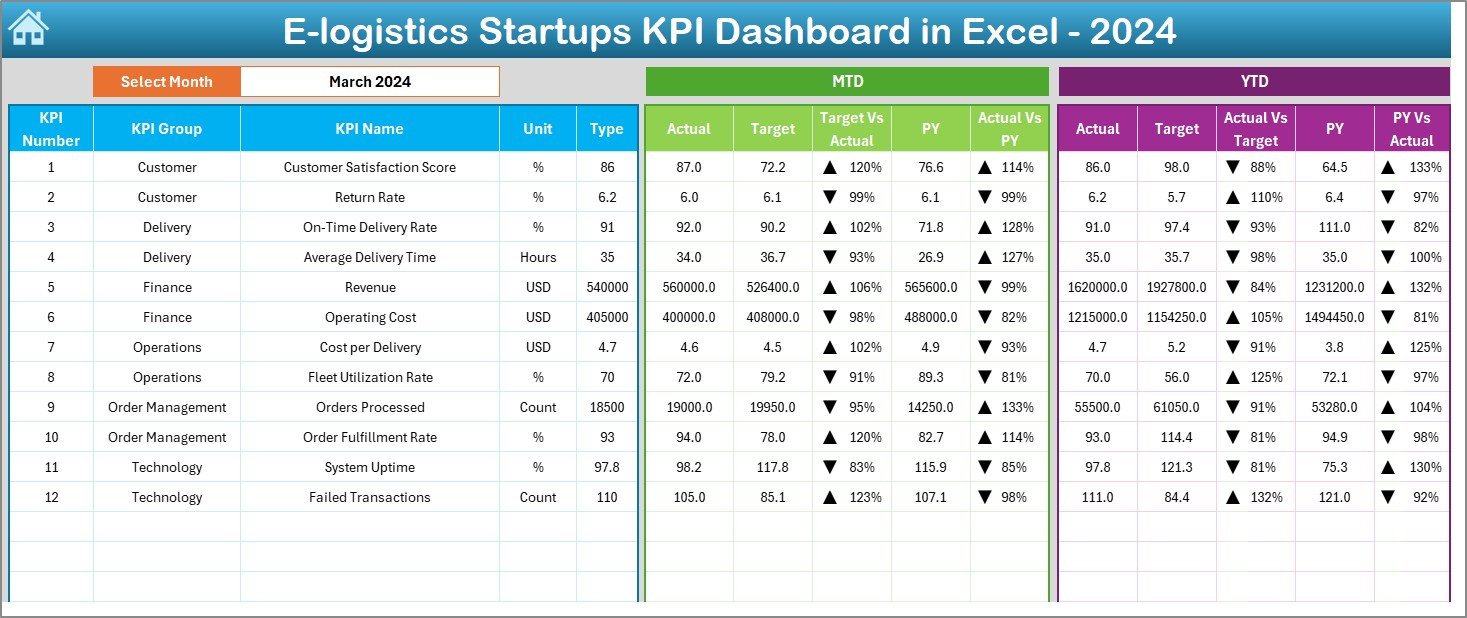
📊 Dashboard Sheet
The main performance view with a Month selector at cell D3, showing MTD & YTD Actual, Target, and Previous Year comparisons.
📉 Trend Sheet
Deep KPI analysis with KPI selection at cell C3, including KPI group, unit, type, formula, and visual trends.
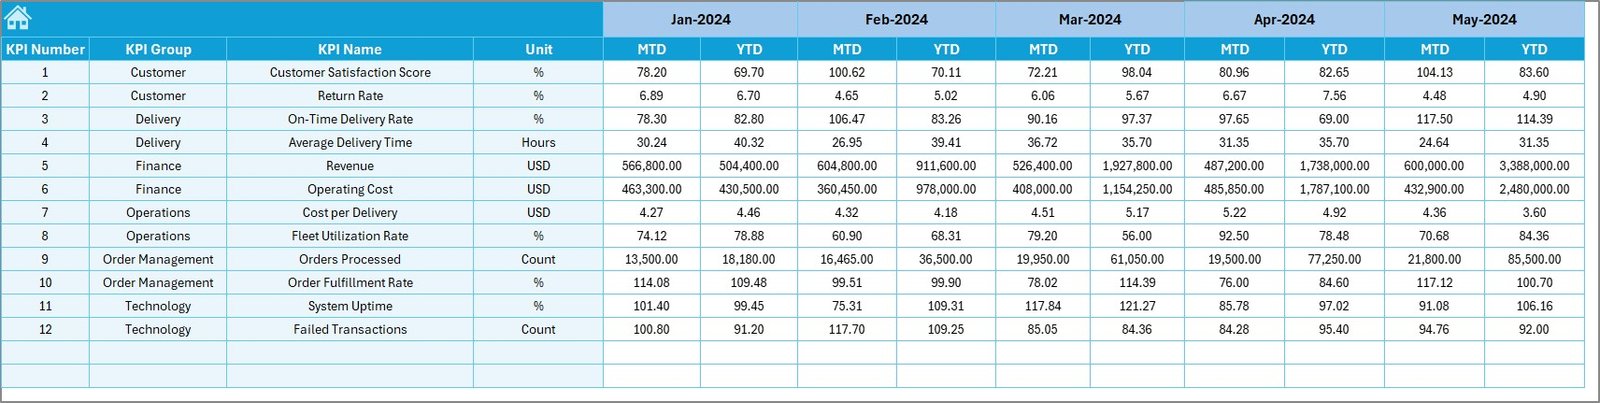
✍️ Actual Numbers Input Sheet
Enter monthly MTD and YTD actual data easily and watch the dashboard update automatically.
🎯 Target Sheet
Define monthly and cumulative targets to enable meaningful gap analysis.
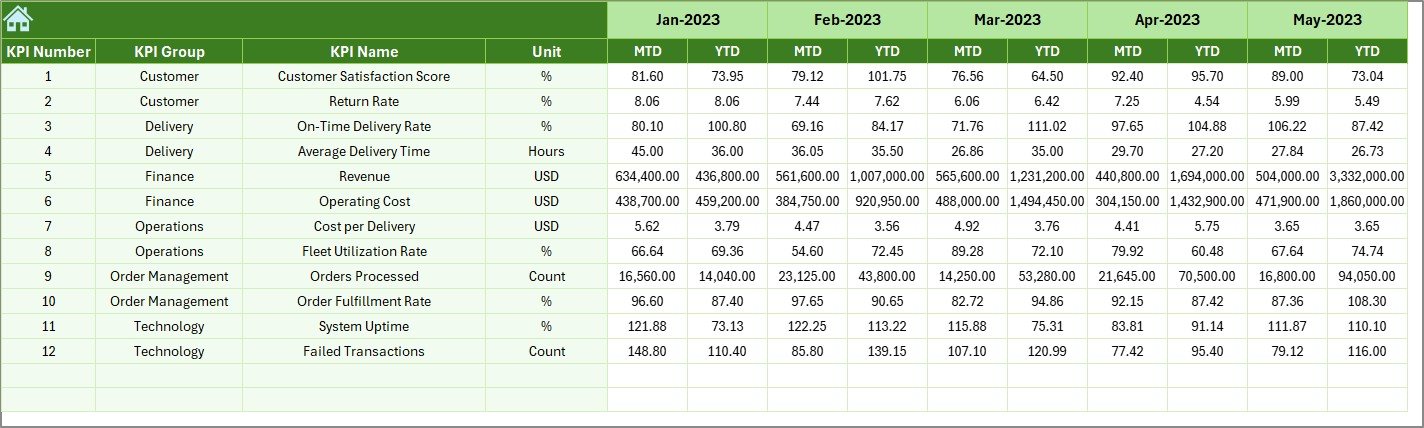
📅 Previous Year Numbers Sheet
Compare current performance with historical data for growth analysis.
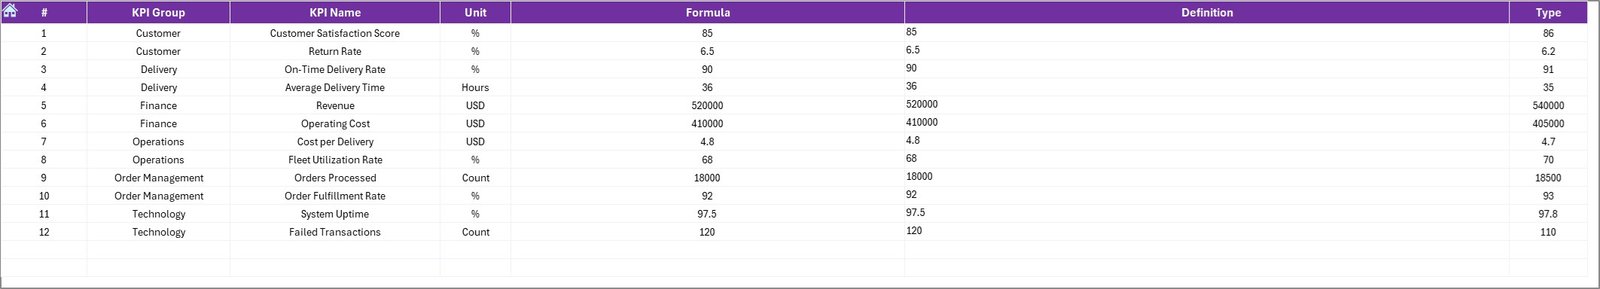
📘 KPI Definition Sheet
Maintain KPI clarity with definitions, formulas, units, and KPI types (LTB / UTB).
🛠 How to Use the E-Logistics Startups KPI Dashboard in Excel
1️⃣ Select the starting month of the year
2️⃣ Enter MTD and YTD actual values
3️⃣ Define targets and previous year numbers
4️⃣ Choose the month from the dashboard drop-down
5️⃣ Review KPI status, trends, and performance gaps
6️⃣ Take data-driven actions confidently
No advanced Excel skills are required. Basic Excel knowledge is enough to start using this dashboard immediately.
👥 Who Can Benefit from This E-Logistics Startups KPI Dashboard
🚚 E-Logistics Startup Founders – Gain control over fast-growing operations
📦 Operations Managers – Monitor delivery and warehouse performance
💰 Finance Teams – Track costs, margins, and profitability
📊 Business Analysts – Analyze trends and KPI behavior
🤝 Investors & Stakeholders – Review structured and reliable performance data
This dashboard scales effortlessly as your startup grows.
Click here to read the Detailed Blog Post
Watch the step-by-step video tutorial:


Reviews
There are no reviews yet.