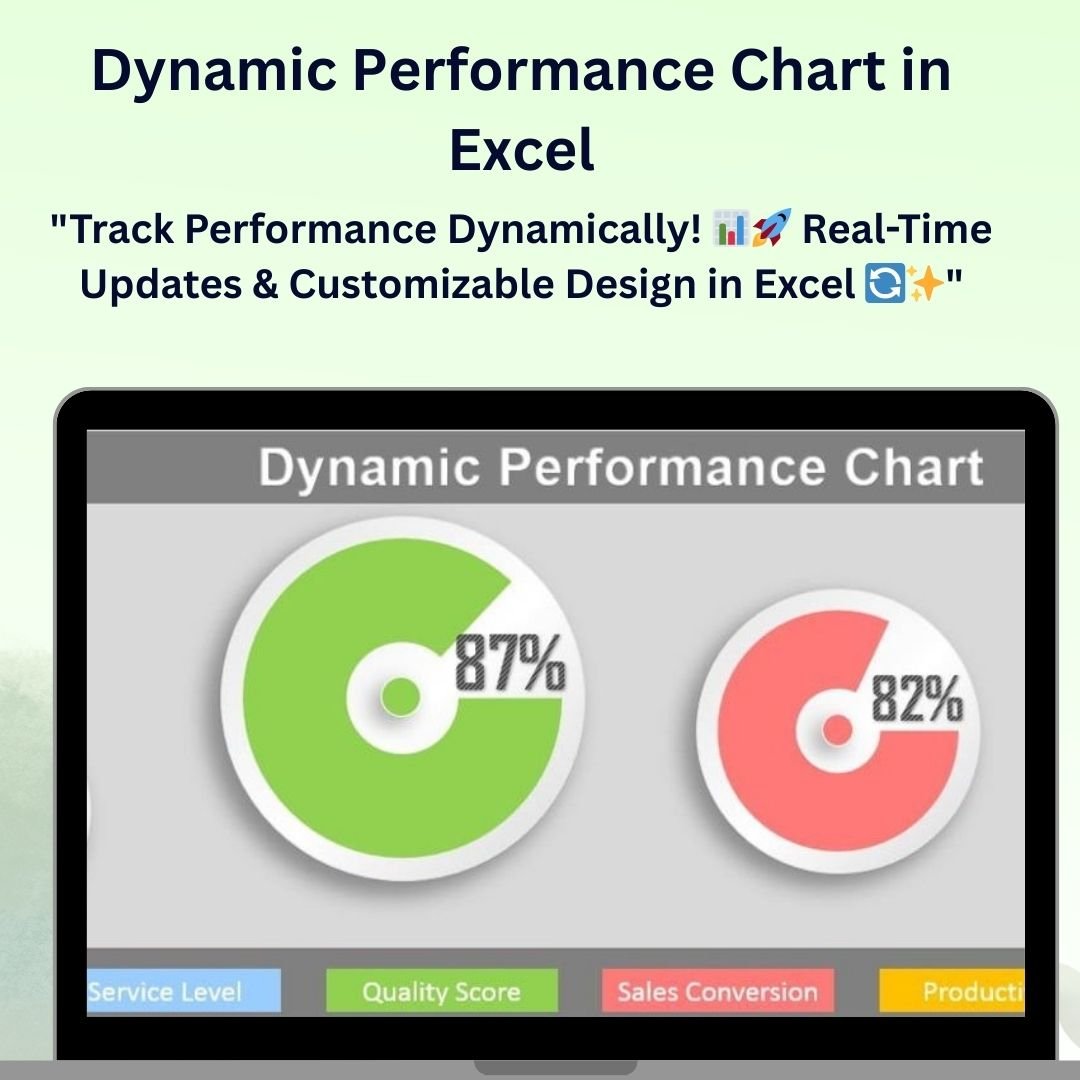
The Dynamic Performance Chart in Excel is a powerful tool designed to track, monitor, and visualize performance metrics in real-time. Whether you’re tracking sales, employee performance, or project milestones, this chart allows you to display your data dynamically, making it easy to spot trends, measure success, and identify areas for improvement.
With fully customizable features, this chart provides interactive visual representations that adjust as you update your data, ensuring that you can always present the most current and accurate information. The Dynamic Performance Chart is perfect for anyone looking to make data-driven decisions and enhance their reporting and presentations.
Key Features of the Dynamic Performance Chart in Excel
📌 Real-Time Data Updates
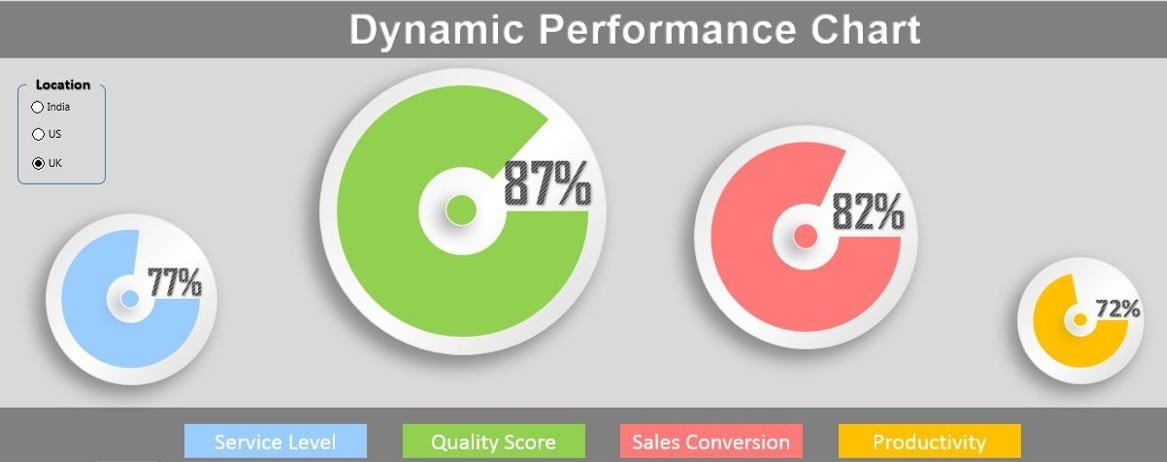
The chart updates automatically as new data is entered. This real-time functionality ensures that your chart reflects the latest information, making it perfect for tracking ongoing projects, sales performance, or other dynamic metrics.
🛠 Customizable Design
You can tailor the design of the performance chart to suit your specific needs. Modify the colors, labels, and chart types to match your brand, style, or specific reporting requirements.
💡 Interactive Visuals
This dynamic chart provides interactive features, such as clickable data points or dynamic segments, which allow for a more engaging and informative experience. The visual representation of data makes it easier to track performance and spot trends.
🔢 Multiple Data Series Tracking
Track and compare multiple performance metrics within a single chart. Whether you’re tracking sales over time, project milestones, or team performance, this chart allows you to analyze several data series simultaneously.
🚀 Clear and Easy-to-Understand Visuals
The chart provides a clean, simple, and easy-to-understand design that makes it easy to analyze and interpret data. With clear indicators and visual representations, you can instantly see where improvements are needed and how progress is being made.
📊 Versatile Use Cases
This performance chart is versatile and can be used in a variety of scenarios, from sales tracking to project management and beyond. It’s perfect for managers, analysts, and business owners who need a comprehensive tool for monitoring performance and making data-driven decisions.
⚙ Easy Setup and Customization
The chart is user-friendly and easy to set up. With clear instructions and simple customization options, you can get the dynamic performance chart up and running in minutes without the need for advanced Excel skills.
🚀 Why You’ll Love the Dynamic Performance Chart in Excel
✅ Real-Time Data Updates – Watch the chart adjust instantly as you update your data. ✅ Customizable Design – Modify colors, labels, and layout to suit your preferences. ✅ Multiple Data Series – Track and compare multiple metrics in one chart. ✅ Clear Visual Representation – Easily interpret performance and trends. ✅ Simple Setup – Get started quickly with user-friendly customization options.
📂 What’s Inside the Dynamic Performance Chart in Excel?
- Real-Time Performance Chart: A dynamic chart that updates as data is entered.
- Customizable Design: Adjust colors, labels, and chart elements to your needs.
- Multiple Data Series Tracking: Monitor and compare multiple performance metrics.
- Interactive Features: Clickable data points and dynamic segments for deeper insights.
- Clear Setup Instructions: Simple steps to set up and customize your chart.
🔍 How to Use the Dynamic Performance Chart in Excel
1️⃣ Download the Template – Instantly access the Excel file upon purchase. 2️⃣ Input Your Data – Enter your performance data, and watch the chart update in real-time. 3️⃣ Customize the Chart – Modify the colors, layout, and labels to fit your needs. 4️⃣ Analyze and Monitor Performance – Use the chart to track and compare multiple performance metrics. 5️⃣ Present and Share – Share the dynamic chart in meetings, presentations, or reports.
🎯 Who Can Benefit from the Dynamic Performance Chart in Excel? 🔹 Business Owners
🔹 Sales Managers
🔹 Project Managers
🔹 Data Analysts
🔹 HR Managers
🔹 Anyone who tracks performance metrics and KPIs
Track and visualize your performance metrics with ease using the Dynamic Performance Chart in Excel. With real-time data updates, customizable design, and interactive features, this chart helps you monitor progress, identify trends, and make informed decisions.
Click here to read the Detailed blog post
https://www.pk-anexcelexpert.com/dynamic-performance-chart-in-excel/


Reviews
There are no reviews yet.