DIY home improvement retail runs on speed, margins, and customer satisfaction. Pricing changes frequently, discounts impact profitability, suppliers perform differently, and customer behavior shifts across stores and regions. However, when this data lives in scattered reports, retailers struggle to understand what truly drives profit and what silently erodes it.
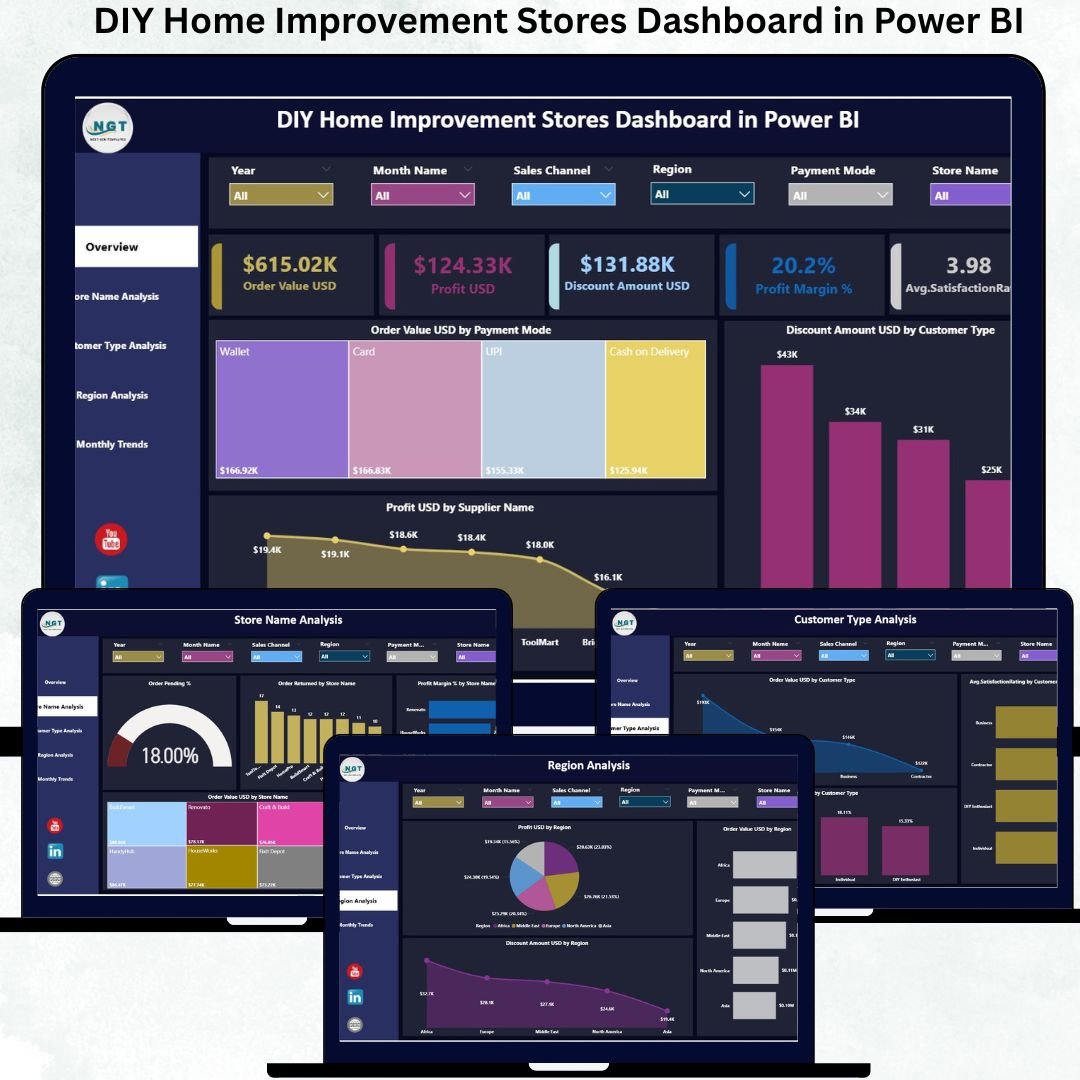
The DIY Home Improvement Stores Dashboard in Power BI solves this challenge by turning complex retail data into clear, interactive, and decision-ready insights. DIY Home Improvement Stores Dashboard in Power BI This ready-to-use Power BI dashboard gives store managers, regional heads, and retail leaders complete visibility into sales, profit, discounts, customer behavior, and trends—across all stores and regions in one place.
Built on Power BI’s powerful analytics engine, this dashboard enables fast drilldowns, dynamic filtering, and trend-based decision-making—helping DIY retailers improve margins, optimize discounts, and enhance customer experience with confidence.
🚀 Key Features of the DIY Home Improvement Stores Dashboard in Power BI
🛒 Centralized Retail KPI Monitoring – Track sales, profit, discounts, and satisfaction together
💰 Profit & Margin Visibility – Instantly see what drives profitability
🏬 Store-Wise Performance Analysis – Compare performance across store locations
🌍 Region-Wise Insights – Identify strong and weak geographic markets
👥 Customer Type Analysis – Understand how different customer segments behave
📈 Monthly Trend Tracking – Analyze seasonality and promotion impact
🎯 Interactive Slicers & Filters – Drill down instantly by store, region, or time
⚡ Fast, Scalable Power BI Model – Works smoothly even with large retail datasets
📦 What’s Inside the DIY Home Improvement Stores Dashboard
This Power BI solution includes five dedicated analytical pages, each designed to answer key retail questions:
🟢 Overview Page
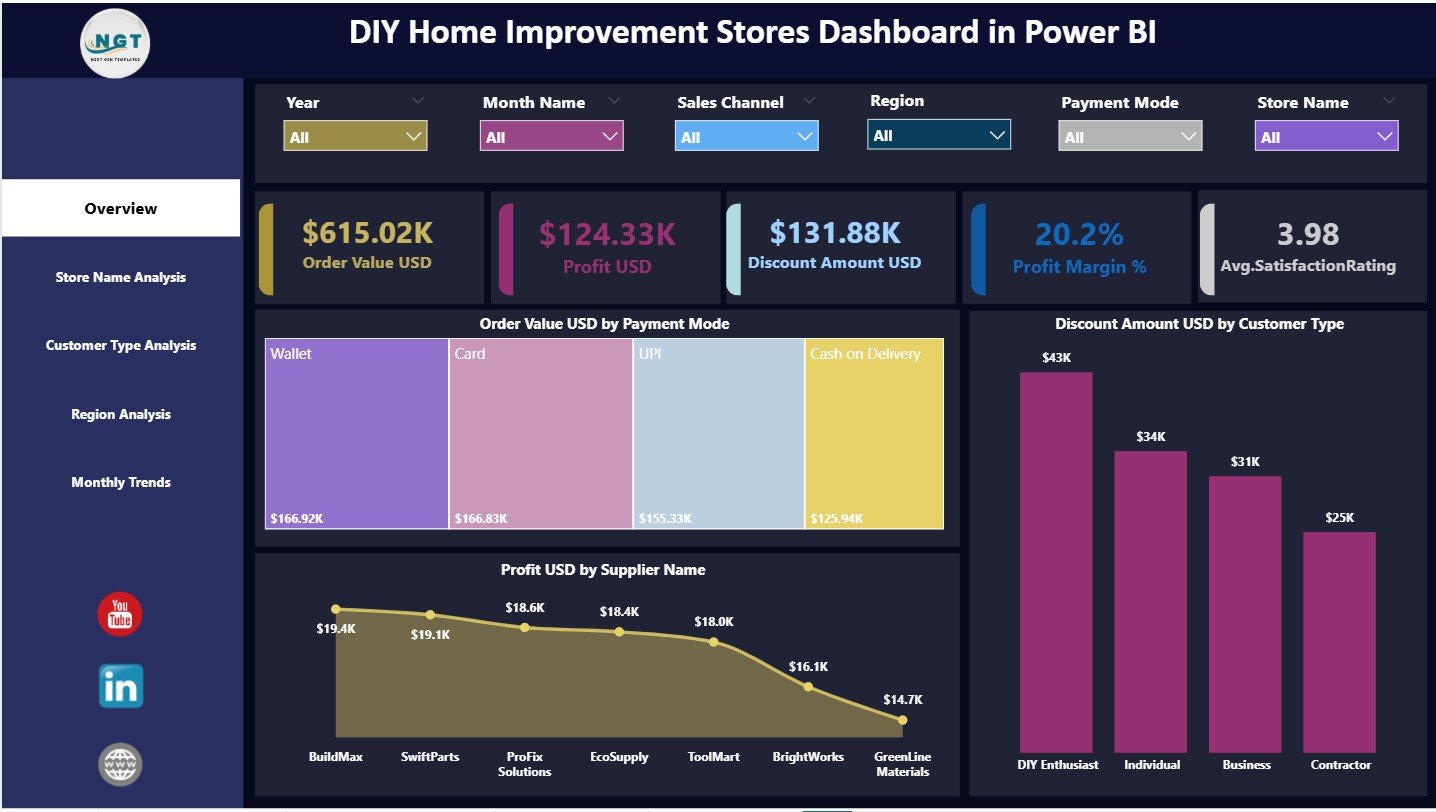
The main performance snapshot. It displays KPI cards for Order Value USD, Profit USD, Discount Amount USD, Profit Margin %, and Average Satisfaction Rating. Charts show Order Value by Payment Mode, Discount by Customer Type, and Profit by Supplier—giving leadership instant clarity.
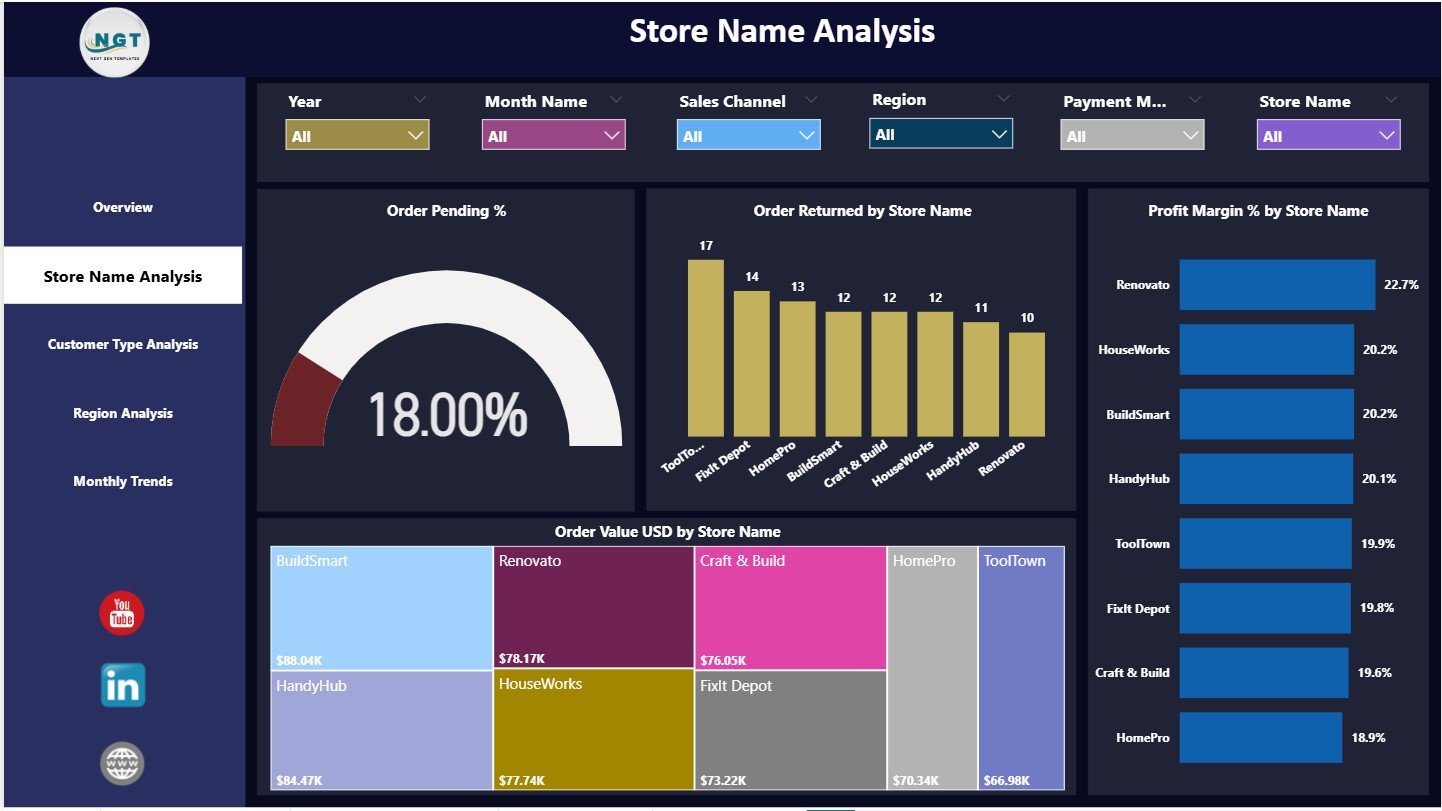
🏬 Store Name Analysis Page
Focuses on store-level performance. It highlights Order Pending %, Order Returns, Profit Margin %, and Order Value by store—making underperforming locations visible immediately.
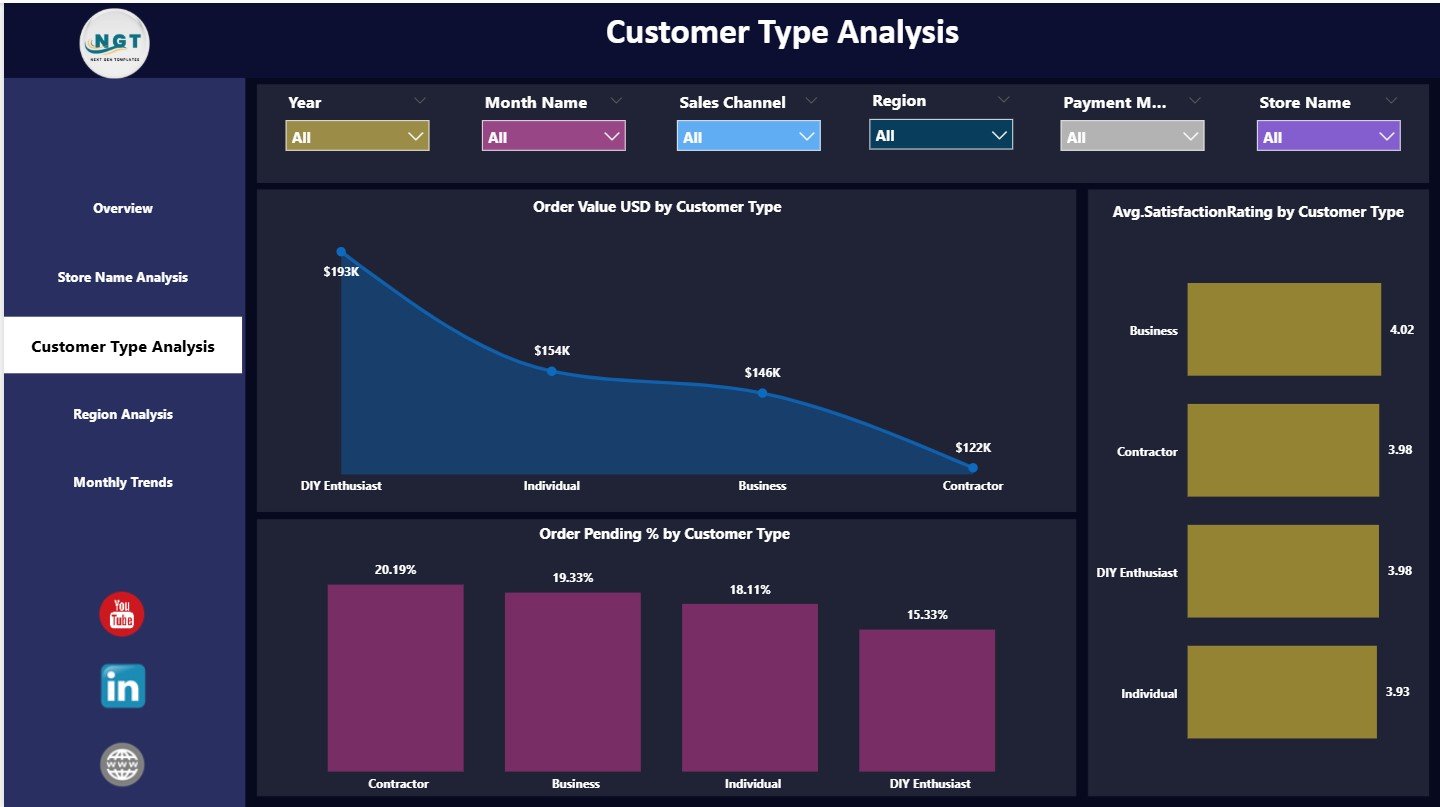
👥 Customer Type Analysis Page
Analyzes customer segments using Order Value, Satisfaction Rating, and Pending Order %. This page helps retailers tailor pricing, service levels, and promotions based on customer behavior.
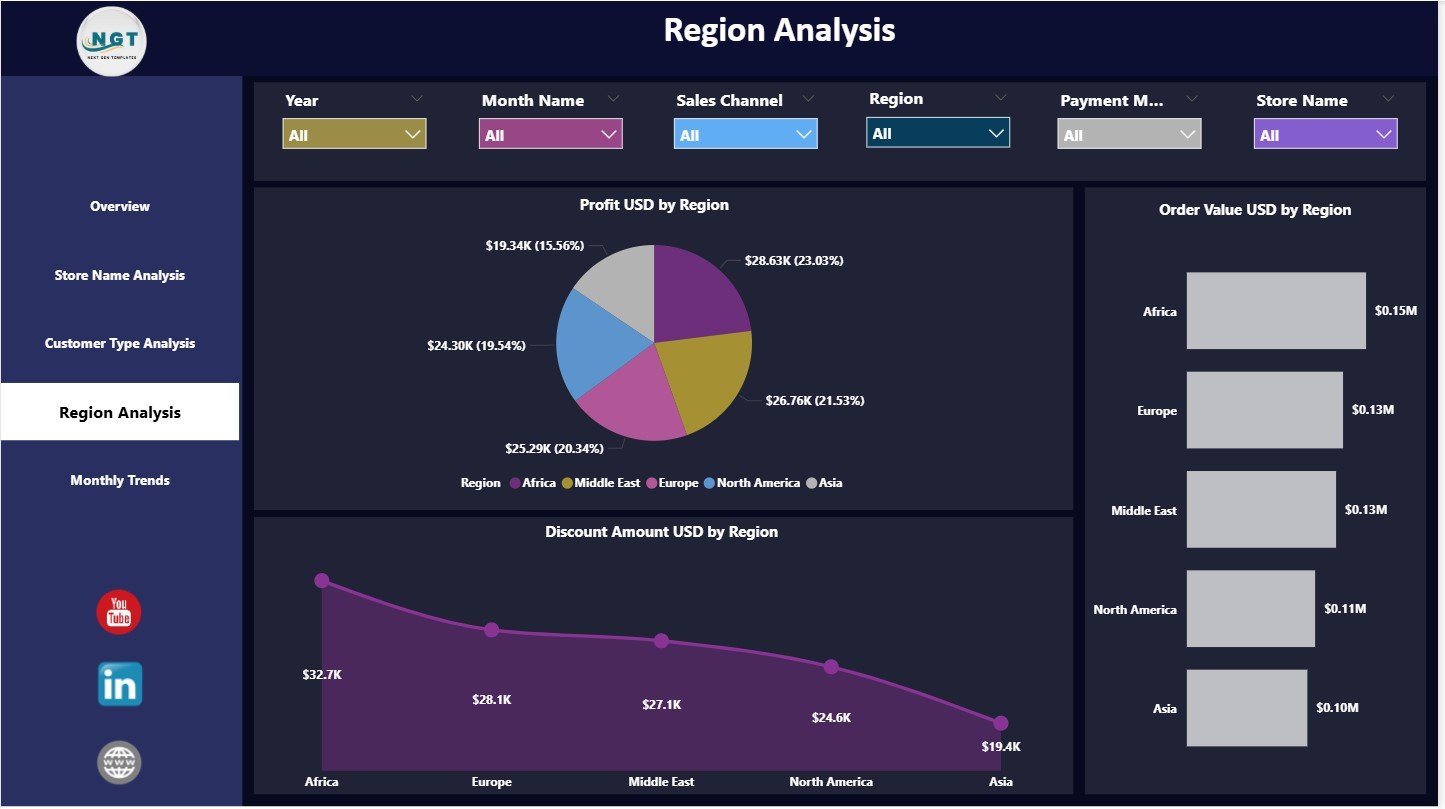
🌍 Region Analysis Page
Compares Profit, Order Value, and Discounts by region. Retailers can clearly see where growth is strong and where margin leakage occurs.
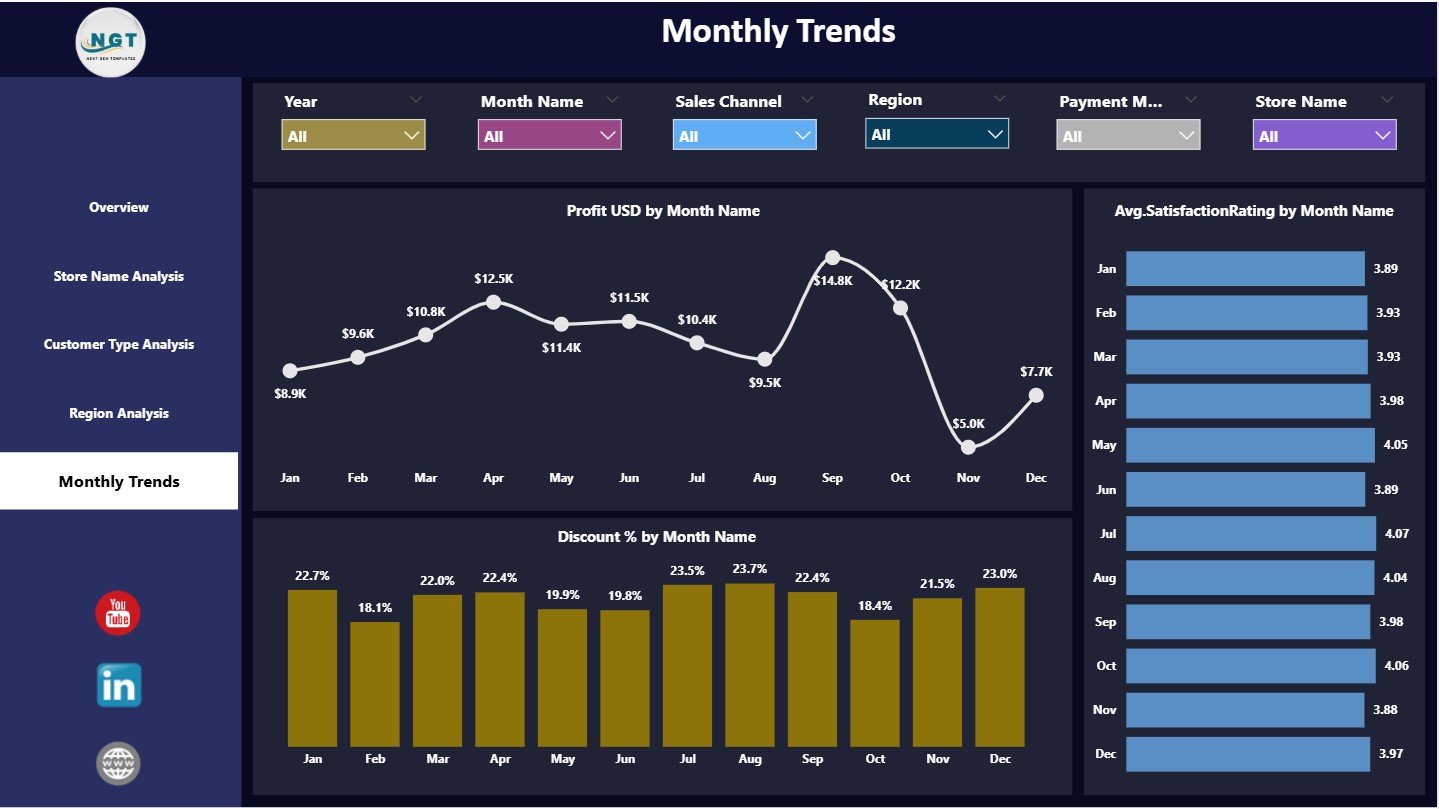
📆 Monthly Trends Page
Tracks Profit USD, Customer Satisfaction Rating, and Discount % month by month—helping teams understand seasonality and promotional effectiveness.
All pages work together to deliver end-to-end retail performance visibility.
🛠️ How to Use the DIY Home Improvement Stores Dashboard
✅ Step 1: Load your retail sales and customer data into Power BI
✅ Step 2: Open the DIY Home Improvement Stores Dashboard
✅ Step 3: Apply slicers for store, region, or time period
✅ Step 4: Review KPIs, charts, and trends
✅ Step 5: Share insights with store and regional teams
The dashboard is ready to use and easy to customize, even for non-technical users.
👥 Who Can Benefit from This DIY Retail Dashboard?
🏬 Store Managers
🌍 Regional Managers
📊 Retail Operations Teams
💲 Pricing & Promotion Teams
👥 Customer Experience Teams
👔 Senior Retail Leadership
Any DIY home improvement business focused on profit control and customer experience will benefit immediately.
🔗 Click here to read the Detailed blog post
🎥 Visit our YouTube channel to learn step-by-step video tutorials


Reviews
There are no reviews yet.