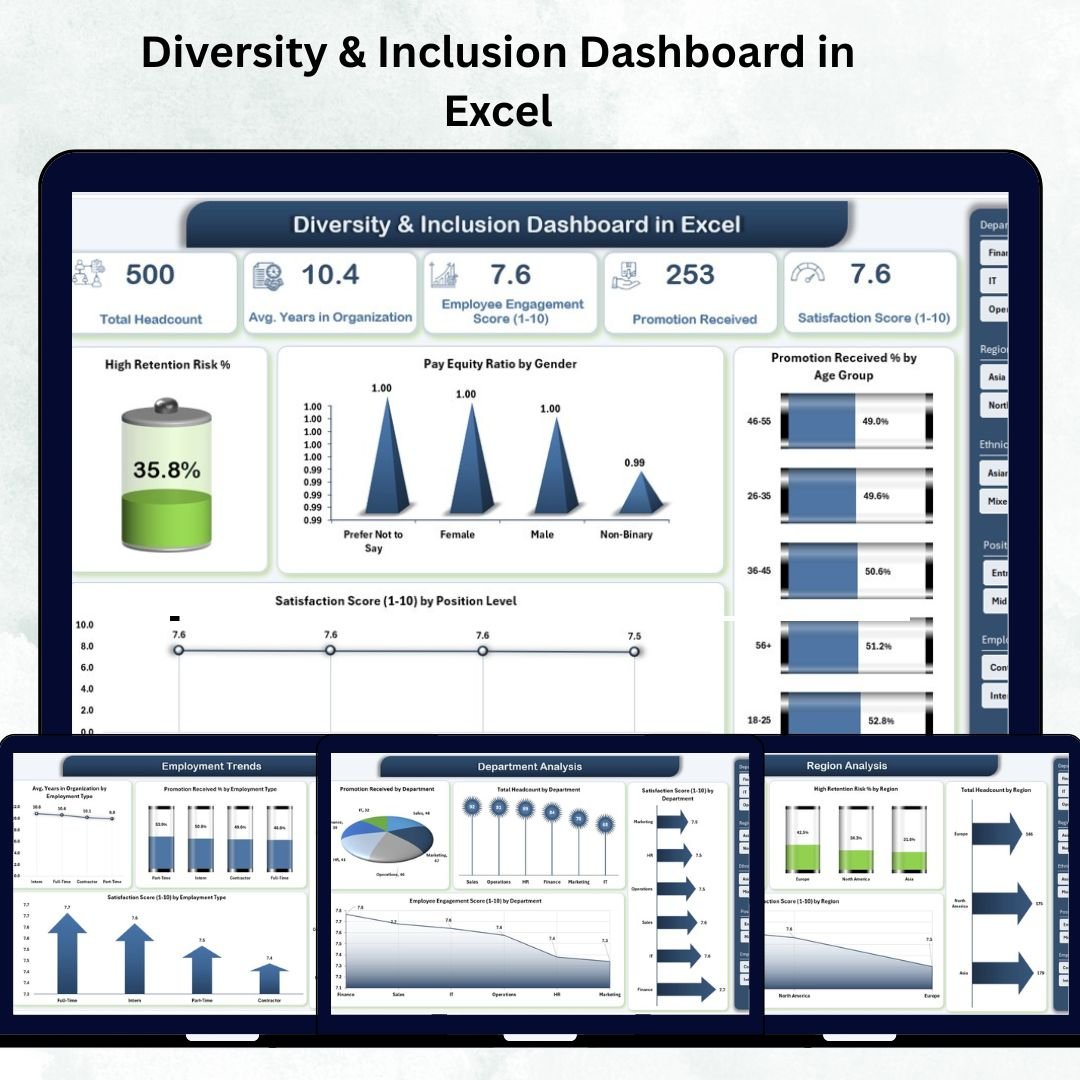
Building an inclusive, equitable organization starts with understanding your workforce. The Diversity & Inclusion Dashboard in Excel helps HR teams, executives, and DEI leaders track representation, pay equity, promotions, and employee engagement – all in one interactive Excel dashboard.
This ready-to-use template turns complex HR data into clear visuals that reveal patterns, highlight gaps, and guide better decisions. Designed entirely in Microsoft Excel, it combines automation, dynamic slicers, and analytical charts to transform how you monitor diversity and inclusion.
With just a few clicks, you can view metrics by department, region, age group, or ethnicity – making it easy to measure progress and ensure fairness across every level of your organization.
⚙️ Key Features of the Diversity & Inclusion Dashboard
🧭 1️⃣ Page Navigator – Seamless Navigation
Located on the left side of the file, the Page Navigator lets users move instantly between analytical pages — Overview, Department, Ethnicity, Region, and Employment Trends.
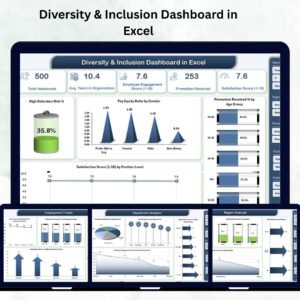
🏠 2️⃣ Overview Page – Your Executive Snapshot
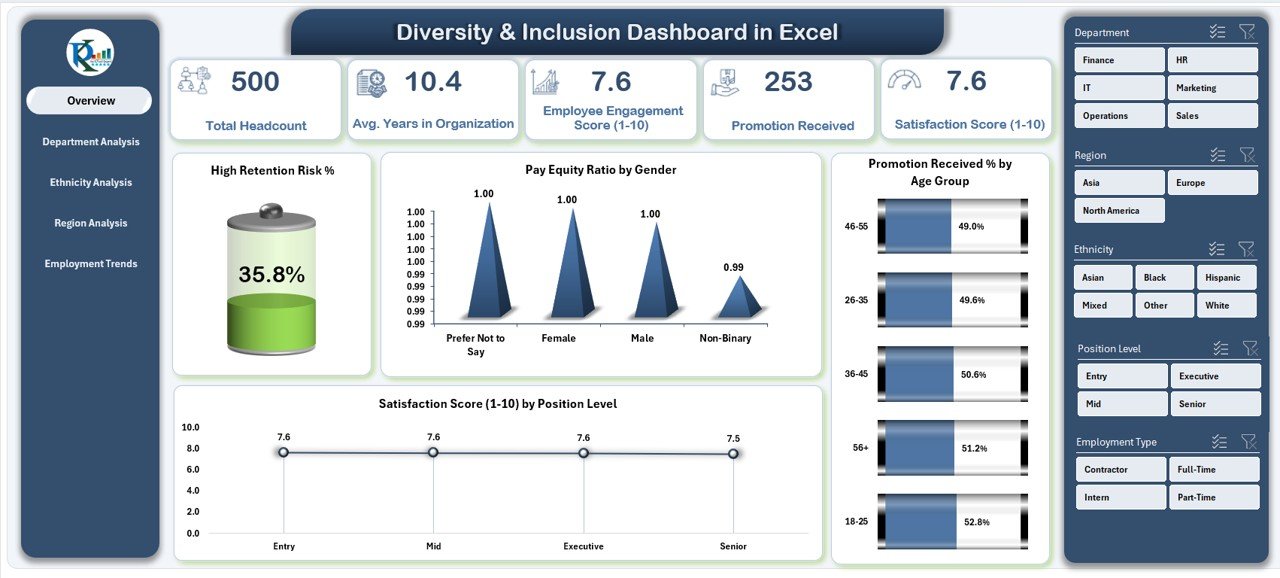
The control center of the dashboard presenting five key KPI cards and four major charts.
Highlights:
-
🎯 Right-side slicer to filter by department, region, or gender.
-
📊 KPI Cards for Total Employees, Retention Rate, Pay Equity Ratio, Promotion Rate %, and Satisfaction Score.
-
📈 Charts include:
-
High Retention Risk %
-
Pay Equity Ratio by Gender
-
Promotion Received % by Age Group
-
Satisfaction Score (1-10) by Position Level
-
Perfect for leadership reviews and quarterly HR updates.
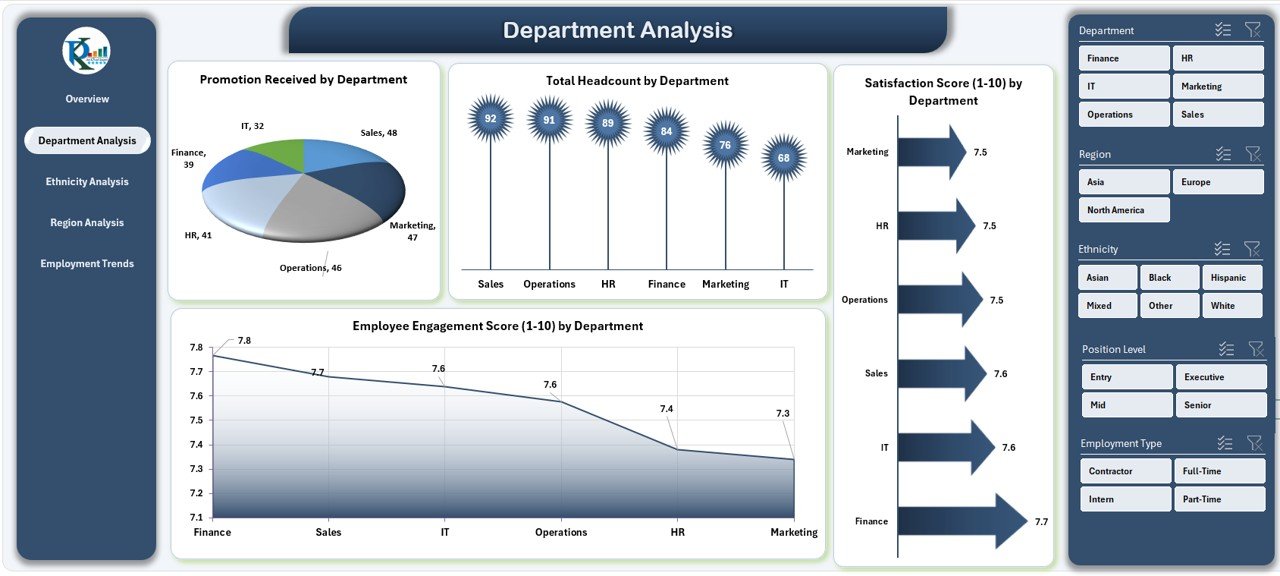
🏢 3️⃣ Department Analysis – Measure Internal Balance
Evaluate performance and inclusion at the departmental level.
Visuals include:
-
Promotion Received % by Department
-
Total Headcount by Department
-
Satisfaction Score (1-10) by Department
-
Employee Engagement Score (1-10)
💡 Pinpoint which departments excel and which require targeted D&I initiatives.
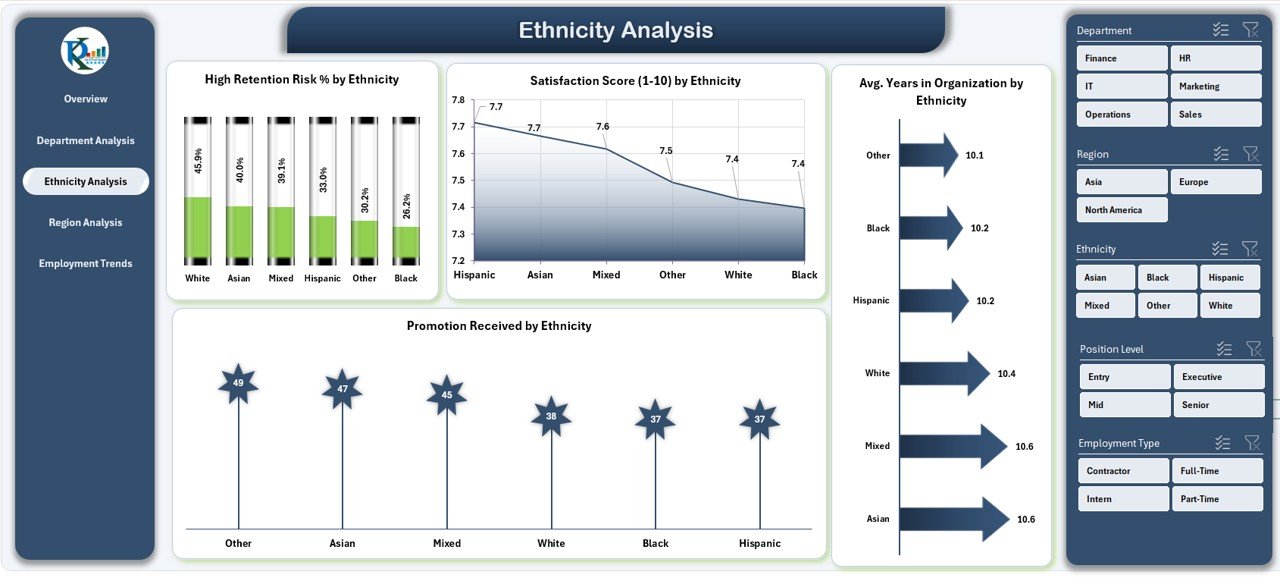
🌈 4️⃣ Ethnicity Analysis – Representation & Equity
Understand workforce diversity across ethnic groups.
Charts:
-
High Retention Risk % by Ethnicity
-
Satisfaction Score (1-10) by Ethnicity
-
Average Years in Organization by Department
-
Promotion Received % by Ethnicity
Promotes equitable career growth and employee inclusion through data.
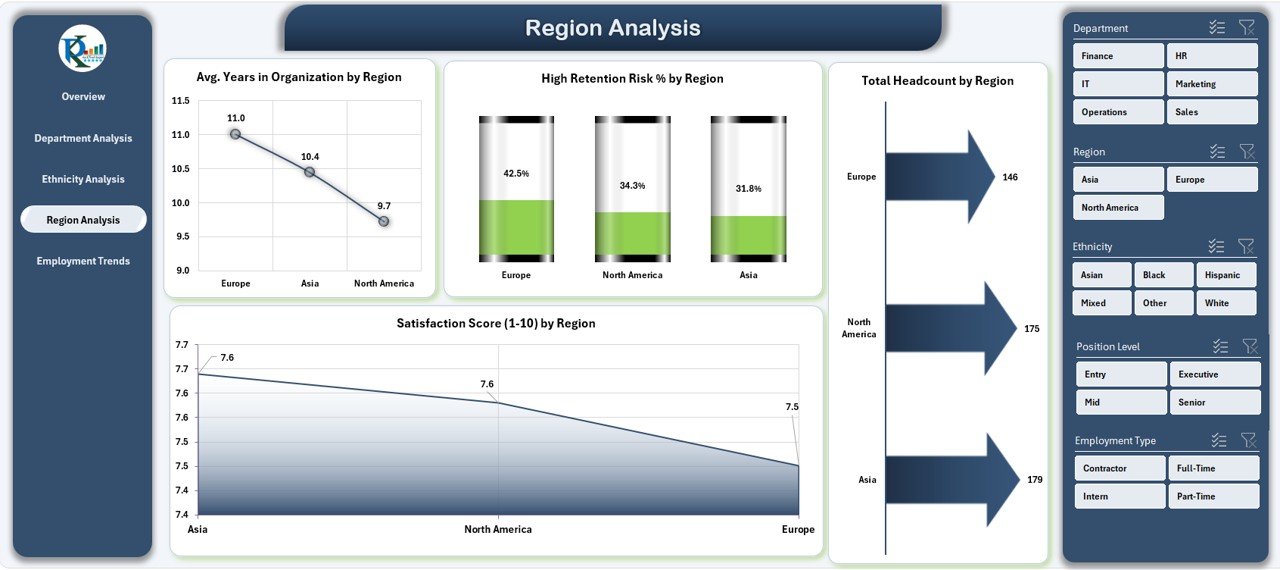
🌍 5️⃣ Region Analysis – Geographic Diversity Insights
Analyze inclusion metrics across locations.
Includes:
-
Average Years in Organization by Region
-
High Retention Risk % by Region
-
Total Headcount by Region
-
Satisfaction Score (1-10) by Region
Helps HR teams tailor region-specific initiatives and retention plans.
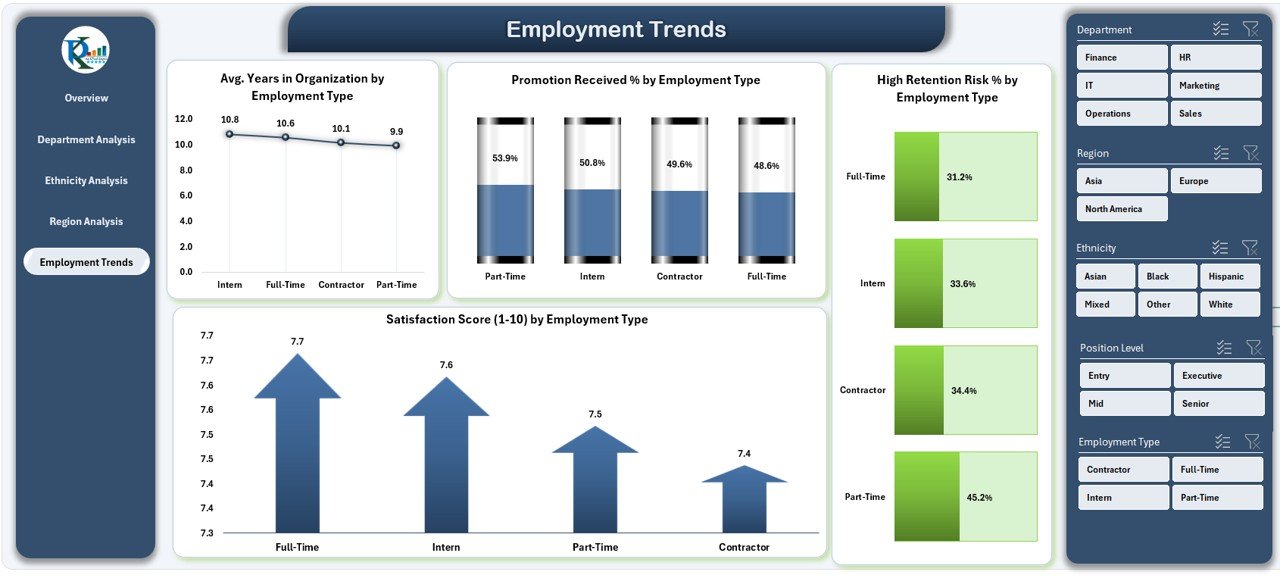
👥 6️⃣ Employment Trends – Employee-Level Monitoring
Track individual performance, growth, and satisfaction over time.
Visuals include:
-
Average Years in Organization by Employee Name
-
High Retention Risk % by Employee Name
-
Promotion Received % by Employee Name
-
Satisfaction Score (1-10) by Employee Name
Ideal for performance reviews and engagement tracking.
🌟 Advantages of the D&I Dashboard in Excel
✅ Comprehensive Insights: Consolidates representation, pay, promotion, and satisfaction data in one file.
✅ Real-Time Visualization: Dynamic charts and slicers update instantly as data changes.
✅ Strategic Decision-Making: Identify gaps and track progress toward equity goals.
✅ Transparency & Accountability: Show leaders clear metrics on pay fairness and retention.
✅ Saves Time: Automated analysis replaces manual reporting.
✅ Fully Customizable: Edit KPIs, colors, or charts to match your brand and organization.
🧭 Who Can Use This Dashboard?
-
🏢 HR Managers & Leaders – Track employee diversity and engagement scores.
-
👩💼 DEI Officers – Monitor representation and equity initiatives.
-
💼 Executives & CEOs – Visualize organizational progress toward inclusion goals.
-
🏭 Corporate & Manufacturing Firms – Evaluate diversity across plants and departments.
-
🏥 Healthcare & Education Sectors – Ensure fair opportunities and representation across roles.
Designed for organizations of any size and industry.
📊 Best Practices for Using the Dashboard
1️⃣ Update data monthly or quarterly for accurate reporting.
2️⃣ Use slicers to filter by gender, region, or department.
3️⃣ Encourage leadership review to ensure accountability.
4️⃣ Benchmark against industry standards for realistic goals.
5️⃣ Automate data import from HR systems for efficiency.
💡 Turn data into action — use trends to improve inclusion programs and employee well-being.
🔗 Click here to read the Detailed Blog Post
📺 Visit our YouTube Channel for Step-by-Step Tutorials
👉 YouTube.com/@PKAnExcelExpert


Reviews
There are no reviews yet.