

The Distribution KPI Dashboard in Excel is a powerful tool designed for businesses in the logistics and distribution industry to monitor and optimize their distribution operations. This dashboard enables you to track key performance indicators (KPIs) such as order fulfillment, delivery performance, inventory levels, and distribution costs, helping you manage and streamline your distribution process.
With this customizable Excel template, you can easily visualize distribution performance in real-time, assess operational efficiency, and identify areas for improvement. Whether you’re tracking delivery timelines, transportation costs, or inventory turnover, this dashboard offers a comprehensive overview of your distribution network, empowering you to make informed decisions and improve business performance.
Key Features of the Distribution KPI Dashboard
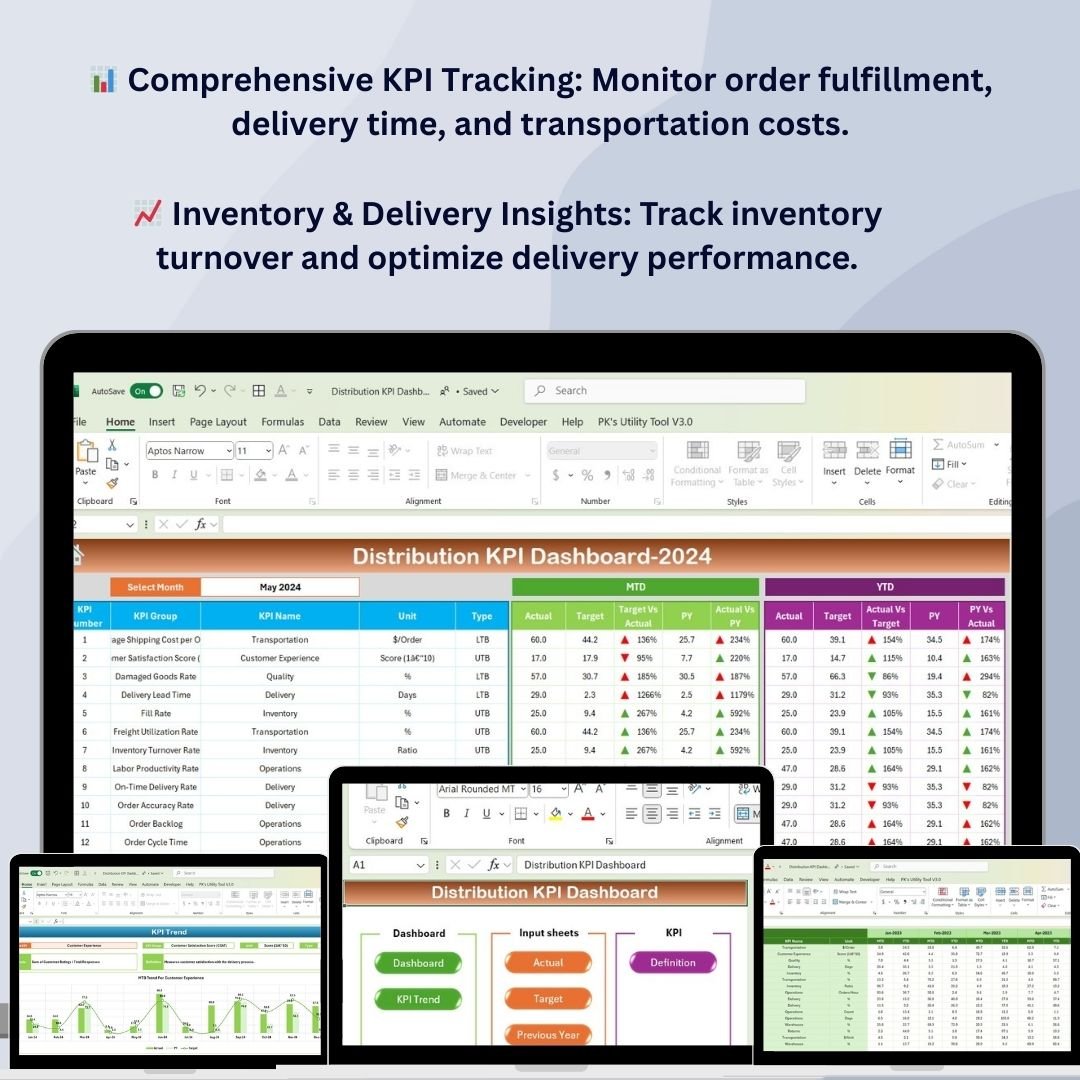
📊 Comprehensive Distribution KPI Tracking
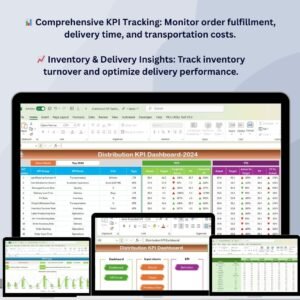
Track important distribution KPIs like order fulfillment rates, delivery times, transportation costs, inventory levels, and returns. Measure the performance of your entire distribution process.
⚡ Real-Time Monitoring
Monitor KPIs in real-time and compare performance data against targets. The dashboard allows for immediate adjustments and improvements based on up-to-date data.
📈 Delivery & Inventory Insights
Track delivery performance and inventory turnover to ensure products are being distributed efficiently. Use this data to optimize your stock levels and reduce unnecessary costs.
📅 Customizable Metrics
Easily tailor the dashboard to track specific KPIs relevant to your distribution network. Monitor everything from supplier performance to logistics costs and shipment tracking.
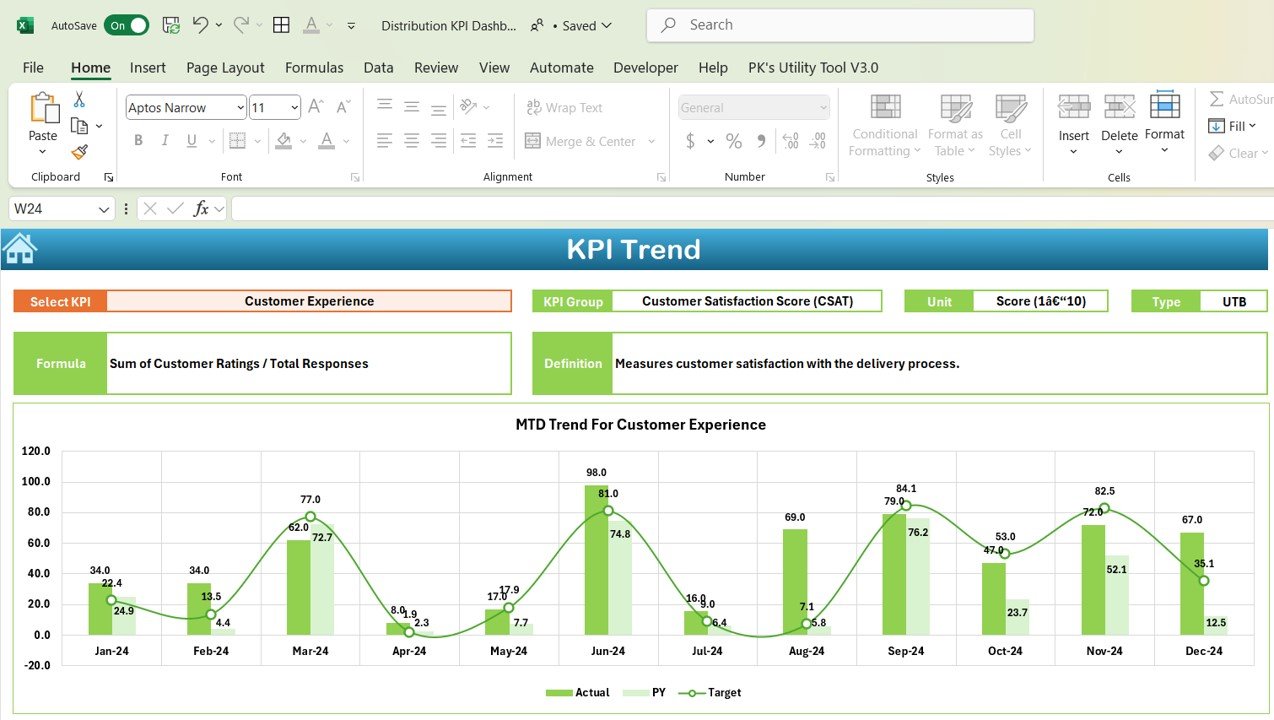
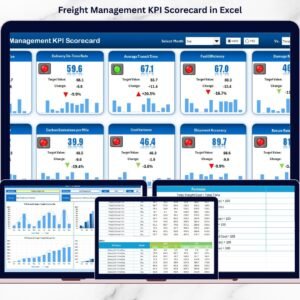
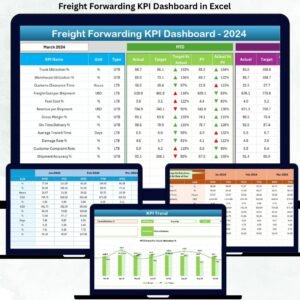
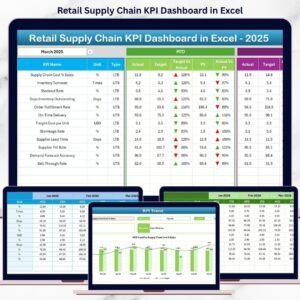
🖥️ Interactive Dashboard with Visual Insights
Use interactive charts and graphs to visualize key performance metrics. The dashboard is designed to make it simple to analyze distribution performance and make data-driven decisions.
Why You’ll Love the Distribution KPI Dashboard

✅ Track Key Distribution Metrics in One Place
Monitor all your distribution-related KPIs in one centralized dashboard, making it easy to assess the performance of your operations and optimize efficiency.
✅ Optimize Inventory & Delivery Performance
Track inventory turnover, order fulfillment, and delivery performance to ensure products are being delivered on time and your inventory levels are aligned with demand.
✅ Reduce Operational Costs
Identify cost-saving opportunities by tracking transportation costs, order processing times, and return rates. Optimize distribution strategies to reduce unnecessary expenses.
✅ Monitor Supplier and Logistics Performance
Evaluate supplier reliability, delivery performance, and overall logistics efficiency to ensure timely product distribution.
✅ Make Data-Driven Decisions
Use visual insights and real-time data to make informed decisions that improve the performance of your distribution network.
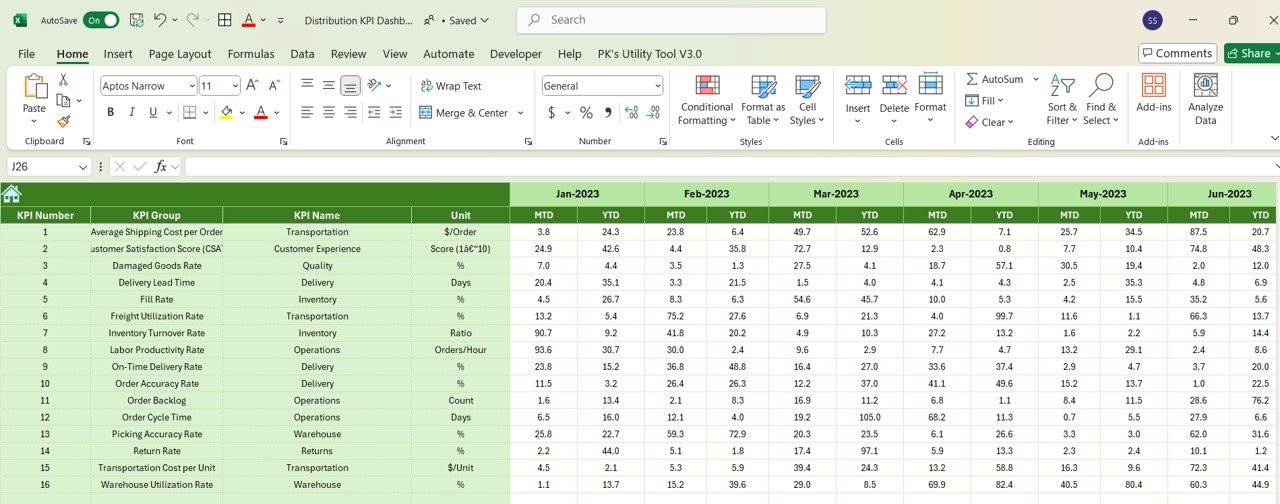
What’s Inside the Distribution KPI Dashboard Template?
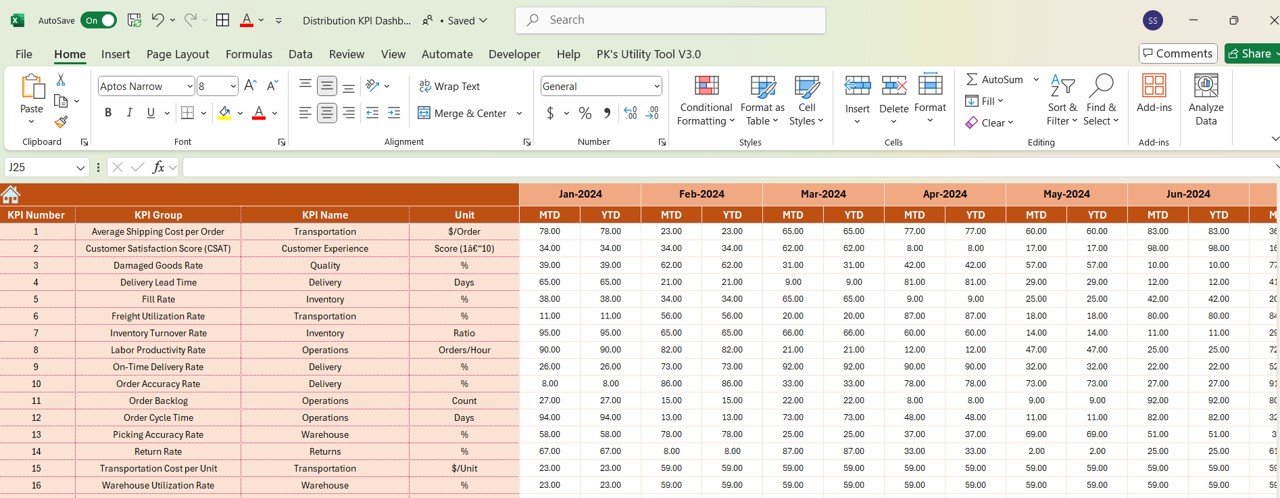
- KPI Tracking: Monitor KPIs like delivery time, order fulfillment rates, transportation costs, and inventory levels.
- Delivery Performance Monitoring: Track the effectiveness of your delivery system, from order dispatch to customer receipt.
- Inventory Insights: Keep an eye on inventory turnover and stock levels to prevent overstocking or stockouts.
- Transportation Cost Tracking: Measure and reduce logistics costs to ensure optimal resource allocation.
- Customizable Metrics: Tailor the dashboard to suit your distribution network’s specific needs.
- Visual Insights: Use interactive charts to understand trends and patterns in your distribution process.
How to Use the Distribution KPI Dashboard
1️⃣ Download the Template: Access your Distribution KPI Dashboard instantly.
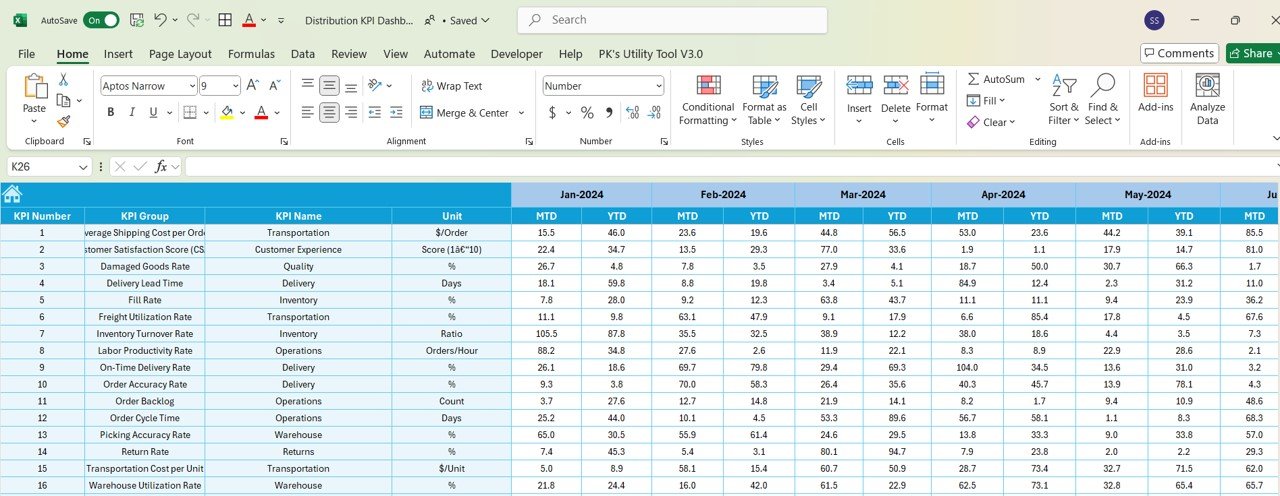
2️⃣ Input Your Data: Enter data related to orders, deliveries, transportation costs, and inventory levels.
3️⃣ Track and Monitor KPIs: Use the dashboard to track and compare your distribution performance against your targets.
4️⃣ Analyze & Optimize: Use insights from the dashboard to improve your distribution strategies, reduce costs, and optimize delivery and inventory performance.
Who Can Benefit from the Distribution KPI Dashboard?
🔹 Distribution Managers & Logistics Coordinators
🔹 Supply Chain Managers
🔹 E-commerce Businesses
🔹 Warehouse & Inventory Managers
🔹 Logistics Service Providers
🔹 Businesses Looking to Improve Operational Efficiency in Distribution
Track, optimize, and improve your distribution process with the Distribution KPI Dashboard in Excel. Stay on top of key performance metrics, streamline your operations, and make data-driven decisions that boost efficiency and reduce costs.
Click here to read the Detailed blog post
Visit our YouTube channel to learn step-by-step video tutorials
Youtube.com/@PKAnExcelExpert


Reviews
There are no reviews yet.