In a digital-first education landscape, data isn’t just useful—it’s critical. Whether you’re running an academic institution, managing a corporate L&D program, or overseeing a government e-learning initiative, tracking learner performance and engagement is key. That’s where the Digital Learning KPI Dashboard in Power BI becomes your smartest ally.
Built for educators, administrators, and training managers, this ready-to-use dashboard helps you track progress, monitor KPIs, and improve digital learning outcomes—with zero coding required.
💡 What Is the Digital Learning KPI Dashboard?
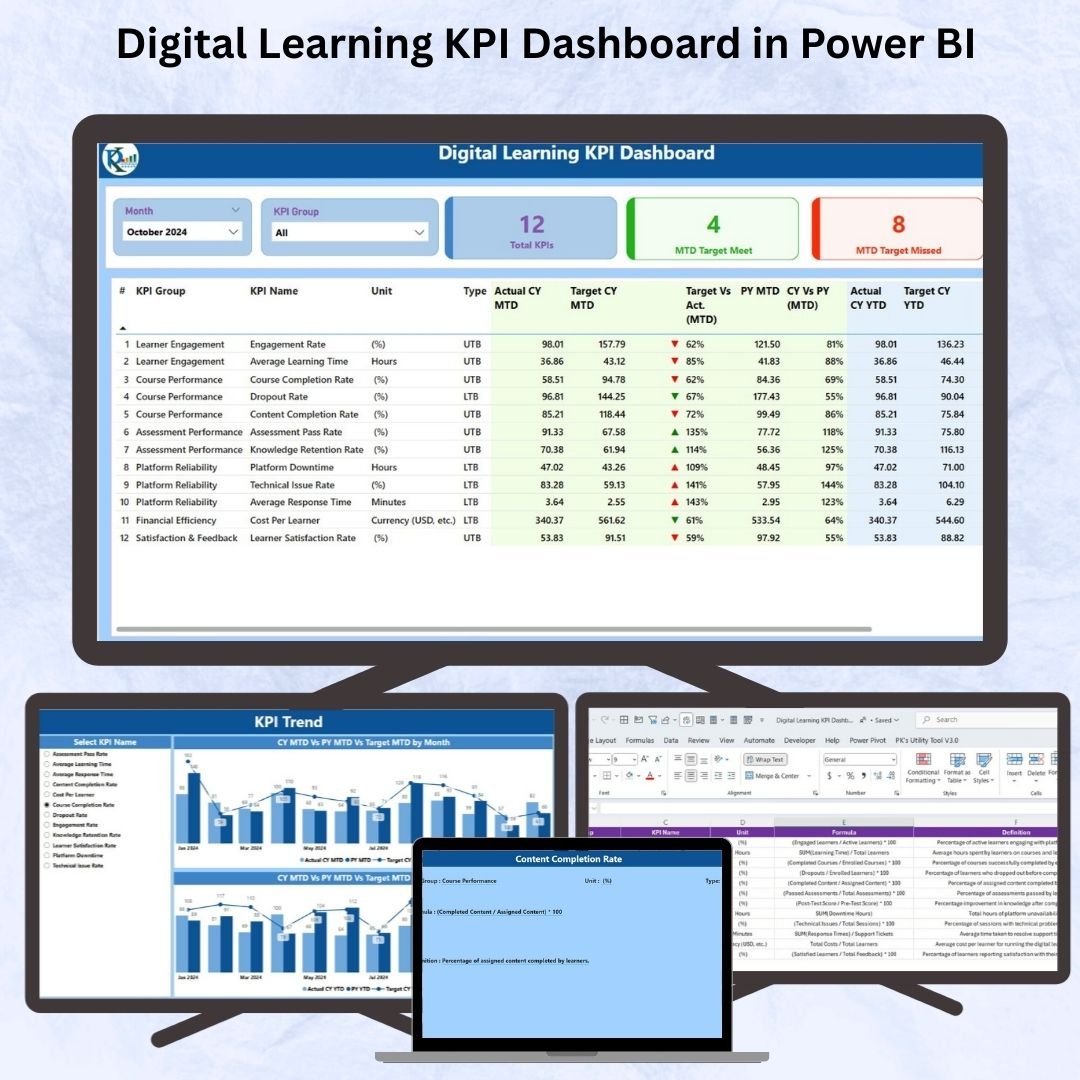
It’s a Power BI-based interactive dashboard designed to display key performance indicators (KPIs) for digital learning systems. It connects directly to an Excel data source and visualizes everything from course completion rates and learner engagement to training success and target gaps.
With real-time monitoring and drill-down capability, you’ll gain actionable insights that lead to smarter decisions—and stronger learner outcomes.
📊 Key Dashboard Pages
This Power BI dashboard includes three powerful and fully interactive pages:
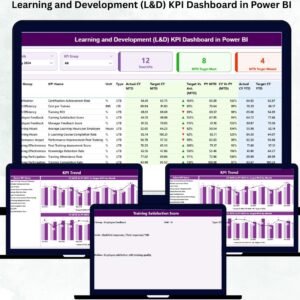
1️⃣ Summary Page – Central Performance Hub
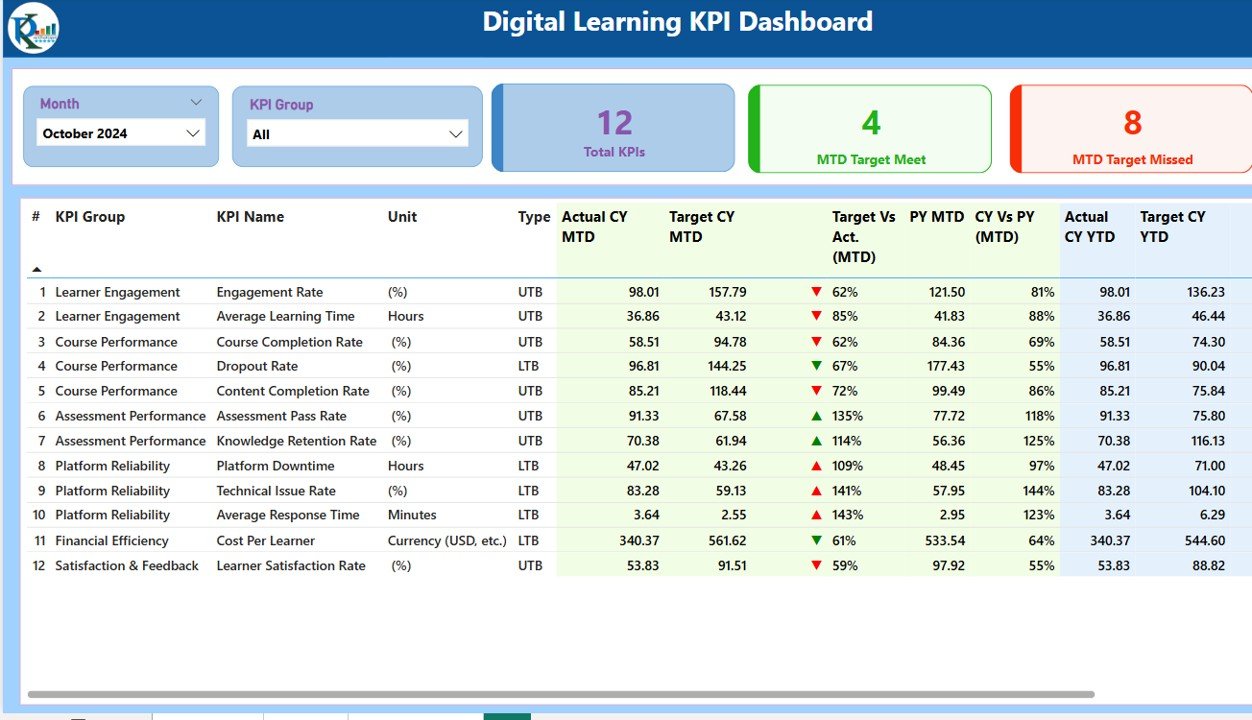
Includes:
-
Month and KPI Group Slicers
-
KPI Cards:
-
Total KPIs Count
-
MTD Target Met / Missed
-
-
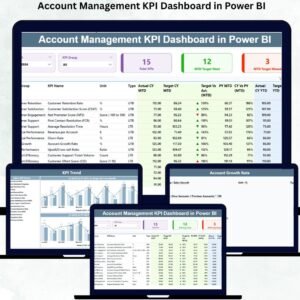
Dynamic KPI Table:
-
KPI Group, Name, Unit, Type (UTB/LTB)
-
MTD and YTD Actual vs Target
-
Performance Icons (Green ▲ / Red ▼)
-
Previous Year comparisons and variances
-
💡 Perfect for stakeholders who want a quick executive summary.
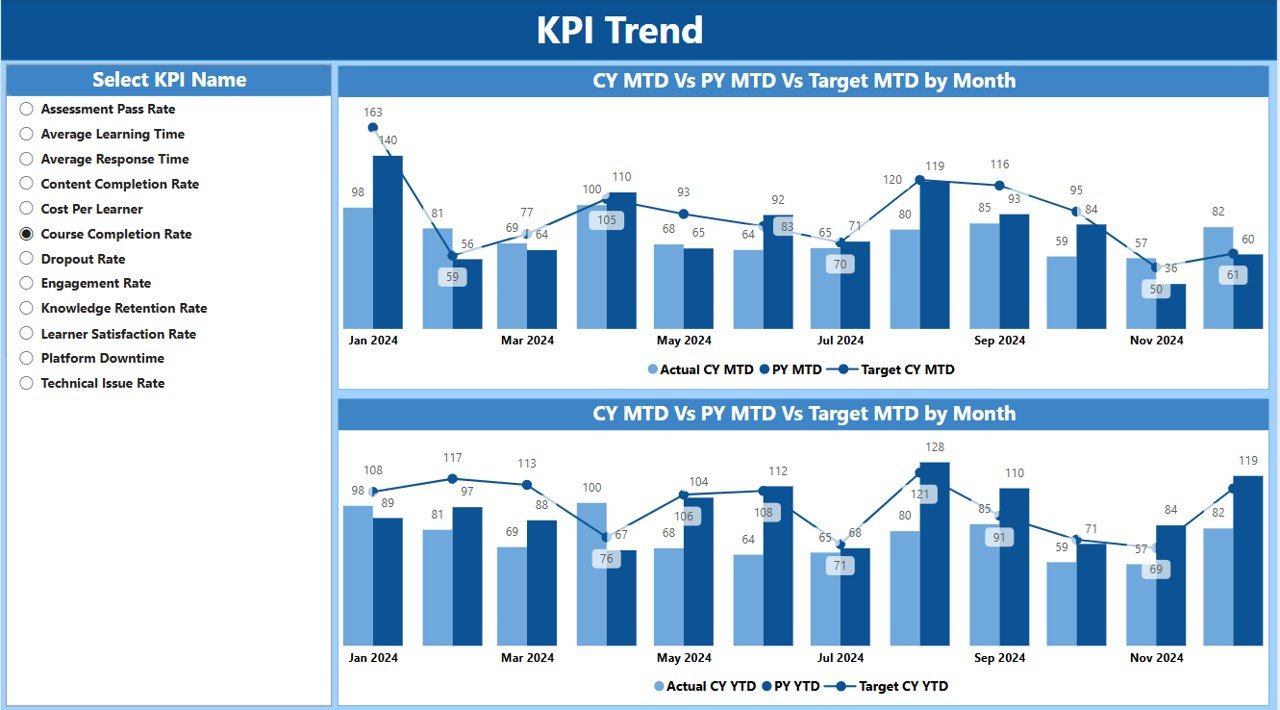
2️⃣ KPI Trend Page – Historical Performance at a Glance
Two dynamic combo charts show:
-
MTD Trend: Compare actuals, targets, and last year’s data
-
YTD Trend: Visualize year-long patterns
✔ Use the KPI slicer to focus on a single metric and analyze it over time.
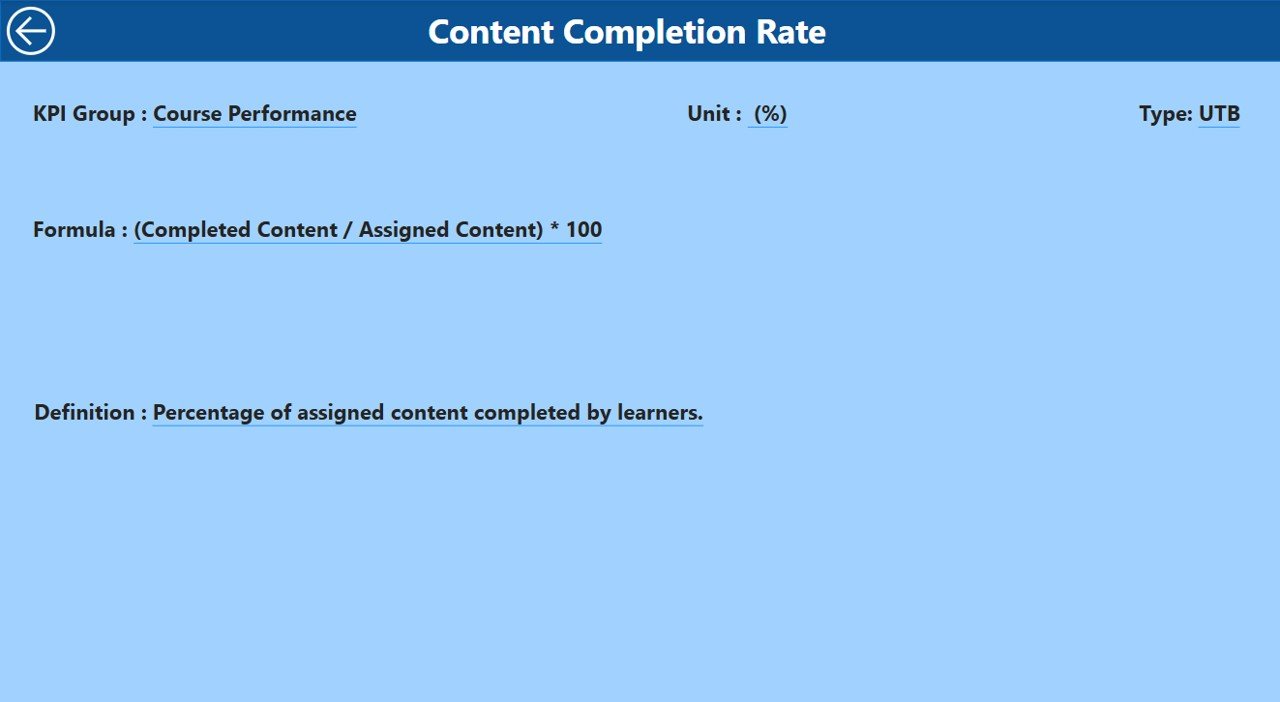
3️⃣ KPI Definition Page – Drill-Through Reference
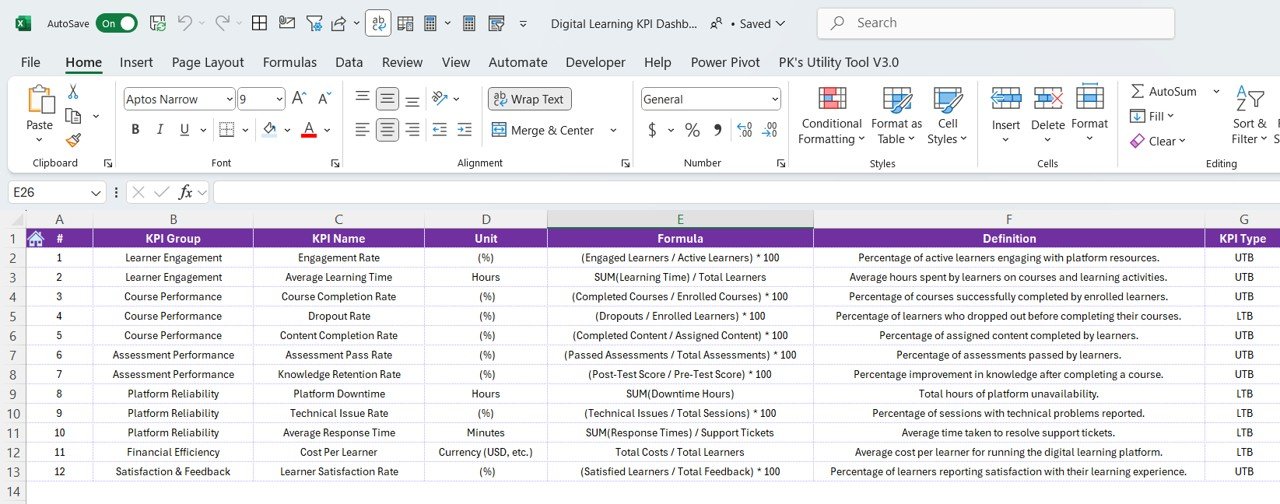
Includes:
-
KPI Formula
-
Unit of Measure
-
UTB/LTB Type
-
KPI Description
Just right-click from the Summary Table to “Drill Through” and view definitions instantly.
📂 Excel Data Source Structure
This dashboard is powered by a well-structured Excel workbook with three key sheets:
-
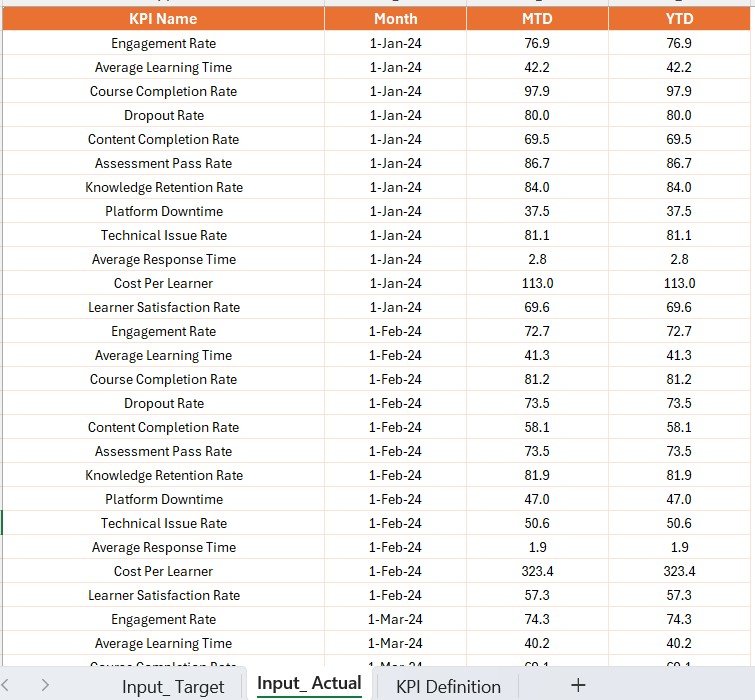
Input Actual Sheet – Input actuals by month (MTD/YTD)
-
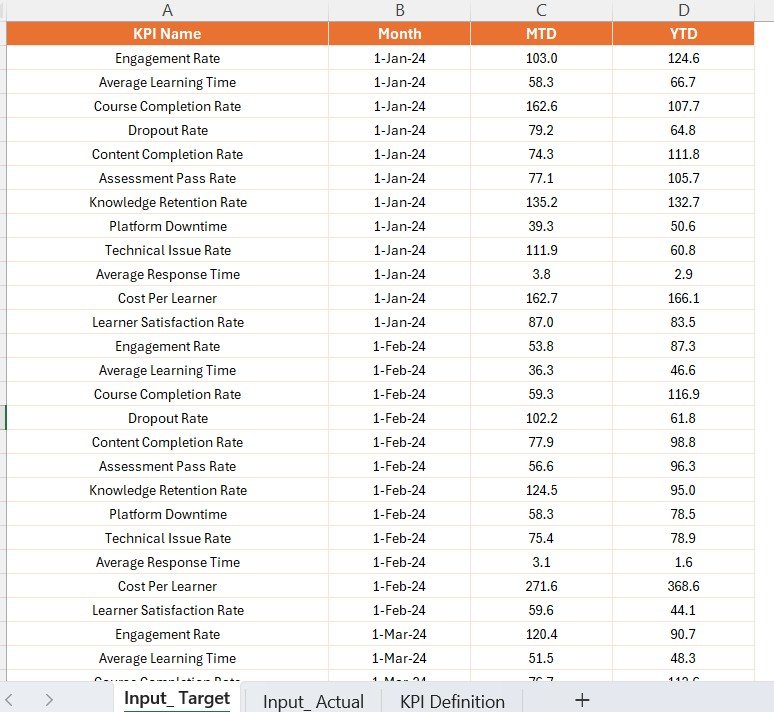
Input Target Sheet – Define monthly targets for each KPI
-
KPI Definition Sheet – Assign KPI numbers, groups, formulas, and types (UTB/LTB)
No Power BI coding or complex formulas needed—just update your Excel file and refresh!
✅ Advantages of Using This Dashboard
📈 Real-Time Learning Analytics
Get updated metrics on course completions, quiz scores, drop-off rates, and more.
📊 Visual Decision Support
With intuitive icons and charts, understand where your team or students are excelling—or falling behind.
📆 Year-Over-Year Comparisons
Identify performance improvements or patterns over time.
🧠 Better Strategy Planning
Use trends to fine-tune learning paths, optimize content delivery, and enhance learner retention.
🌐 Collaborative Insights
Publish to Power BI Service and securely share the dashboard across your organization.
🧠 Who Should Use This?
✅ Education Technology Administrators
✅ Online Course Providers
✅ Corporate Learning & Development Teams
✅ EdTech SaaS Companies
✅ HR and Training Managers
✅ Government Digital Literacy Programs
📘 Sample KPIs Tracked
-
Course Completion Rate (%)
-
Average Quiz Score
-
Daily Active Learners
-
Assignment Submission Rate
-
Dropout Rate (%) – LTB
-
Login Frequency – UTB
-
Time Spent per Module
-
Feedback Rating (%)
-
Certificate Issuance Rate
-
Support Request Resolution Time (LTB)
🧩 Best Practices for Use
🔁 Update Excel Sheets Monthly for accurate data
📌 Define KPIs Clearly in the definition sheet
📊 Use Color Icons to signal performance gaps
🧩 Limit KPI Overload – focus on what drives decisions
📢 Share Insights with Teams to drive accountability
🎓 Why Power BI for Digital Learning?
Unlike spreadsheets alone, Power BI allows you to:
-
Interact with your data in real time
-
Drill down without disrupting your view
-
Compare trends and targets visually
-
Publish securely to the cloud
📥 What You Get
-
Power BI (.pbix) Dashboard File
-
Excel Data Source Template
-
Pre-linked Slicers, Cards & Charts
-
Drill-through-enabled KPI definition page
-
Setup guide included
🎥Click here to read the Detailed blog post Learn More
📺 Visit our YouTube channel for full walkthroughs and training tips:
YouTube.com/@PKAnExcelExpert

Reviews
There are no reviews yet.