
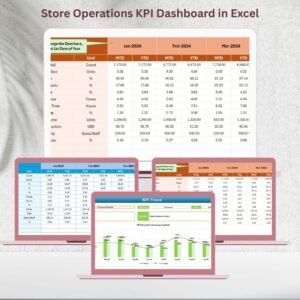
Department stores operate in an incredibly fast-paced retail environment. Customers expect excellent service, seamless checkout, fresh inventory, competitive pricing, and a consistent shopping experience across every visit. To deliver all this successfully, store leaders must analyze dozens of KPIs every month. Department Stores KPI Dashboard in Excel but when reporting is done manually, data becomes scattered, formulas break, and decision-makers waste hours trying to understand what’s really happening.
The Department Stores KPI Dashboard in Excel solves these challenges instantly. Department Stores KPI Dashboard in Excel It provides a powerful, automated, and easy-to-use reporting system that brings together sales performance, footfall analysis, stock movement, customer satisfaction, and operational KPIs—all in one place. Department Stores KPI Dashboard in Excel with clear visuals, trend charts, MTD/YTD comparisons, and conditional formatting arrows, retail teams get instant clarity on what is working and what needs urgent attention. 🚀
Department Stores KPI Dashboard in Excel Whether you’re managing one store or multiple locations, this dashboard helps you monitor performance quickly, identify opportunities, and make data-driven decisions that improve customer satisfaction and profitability.
Key Features of the Department Stores KPI Dashboard in Excel ✨
This dashboard is packed with professional features designed for modern retail teams:
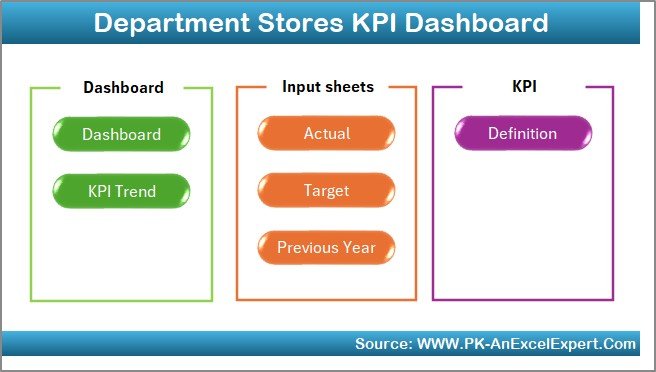
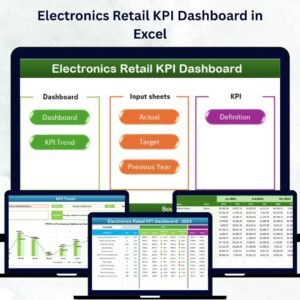
✨ Seven Smartly Designed Worksheets – Home, Dashboard, KPI Trend, Actual Input, Targets, Previous Year Data, and KPI Definitions
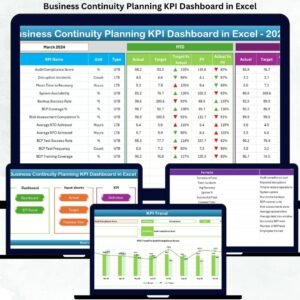
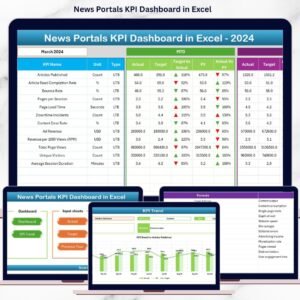
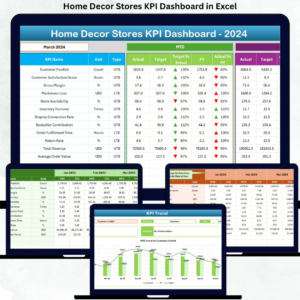
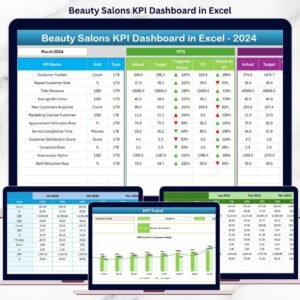
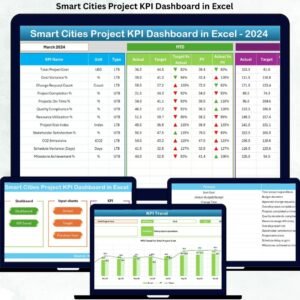
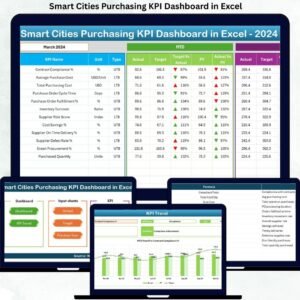
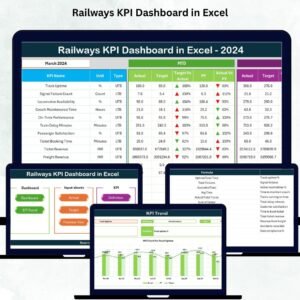
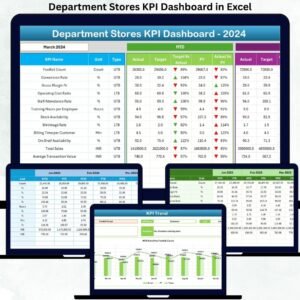
📊 Interactive Dashboard Page – View MTD/YTD KPIs with conditional arrows (▲ ▼) and percentage comparisons
📅 Monthly Selector – Instantly refresh the dashboard using a simple drop-down
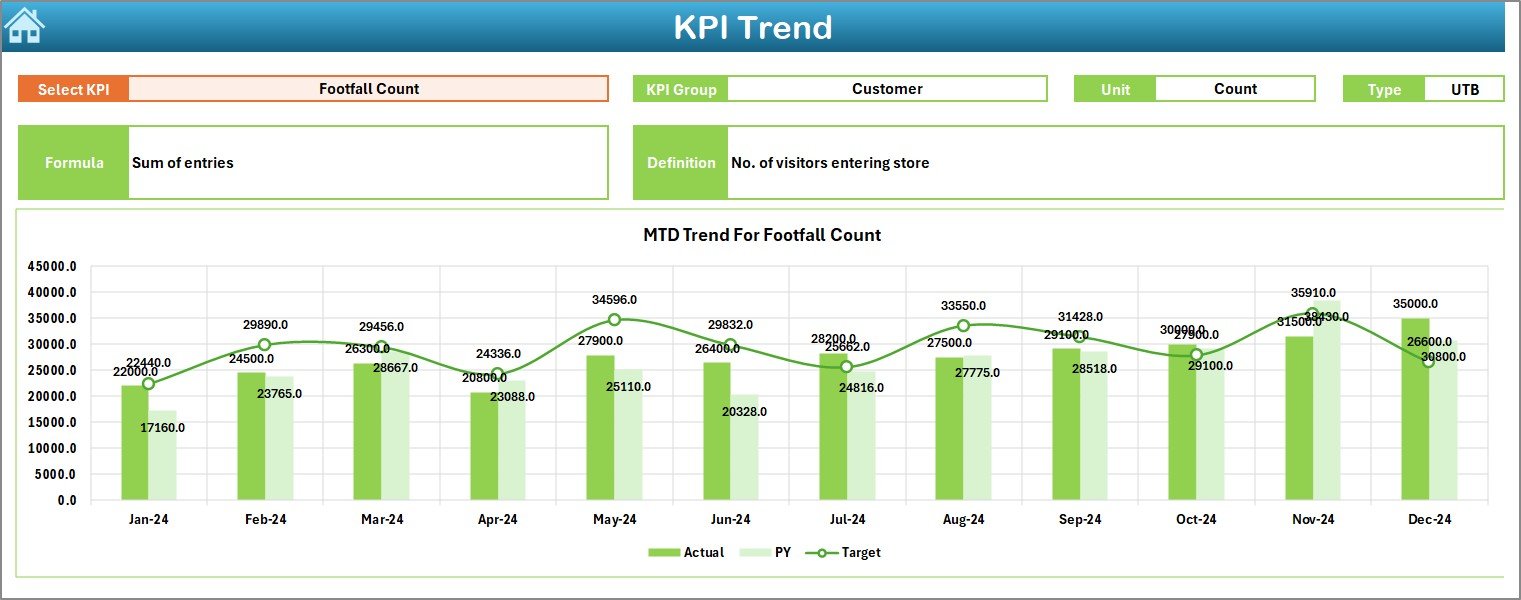
📈 Trend Analysis Charts – Identify performance patterns across months
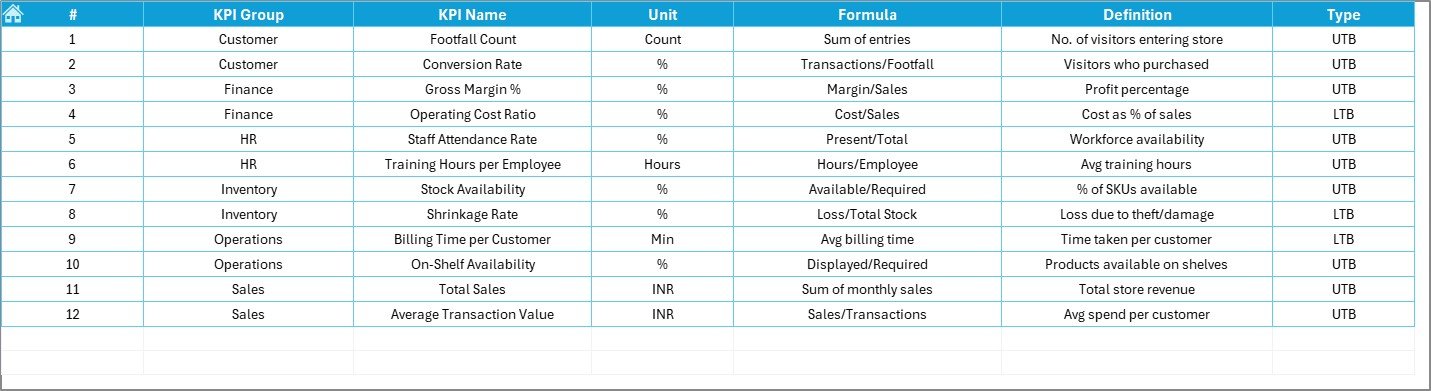
📘 KPI Metadata – Clear definitions, formulas, units, and KPI types for transparency
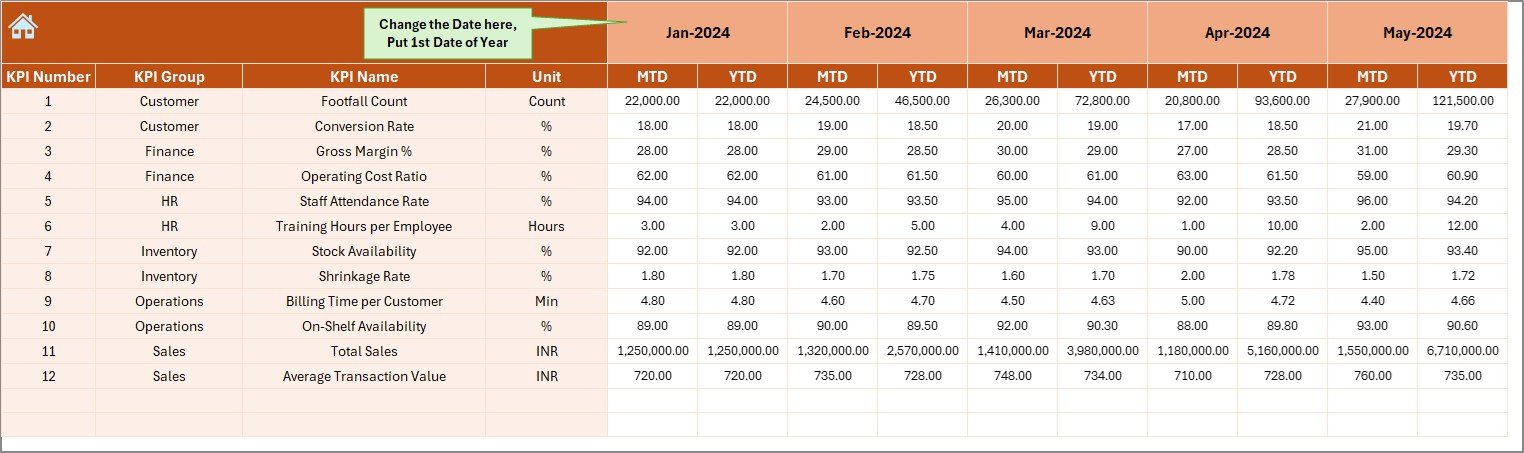
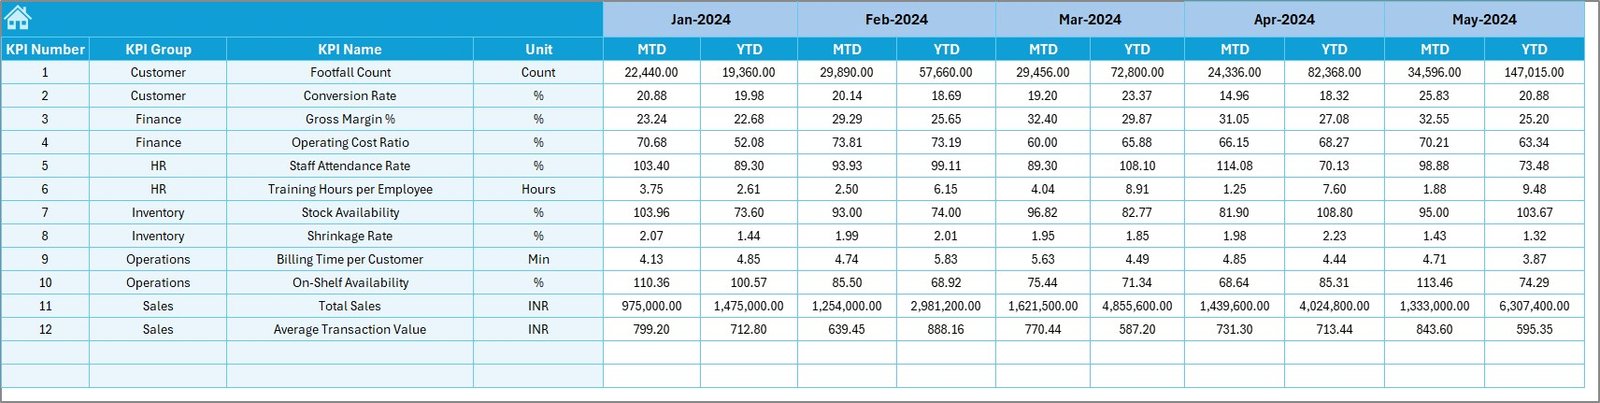
📝 Structured Data Entry Sheets – Actual, Target, and Previous Year sheets ensure clean and reliable inputs
📉 Comparison Insights – MTD vs Target, CY vs PY, and YTD trend tracking
🖥️ Beginner-Friendly Interface – Easy navigation buttons and clean layout for non-technical users
Designed to simplify complex retail reporting, this dashboard becomes your store’s central performance command center.
What’s Inside the Department Stores KPI Dashboard in Excel 📂
Here’s a full breakdown of the pages included:
📌 Home Page – Navigation buttons for effortless movement across sheets
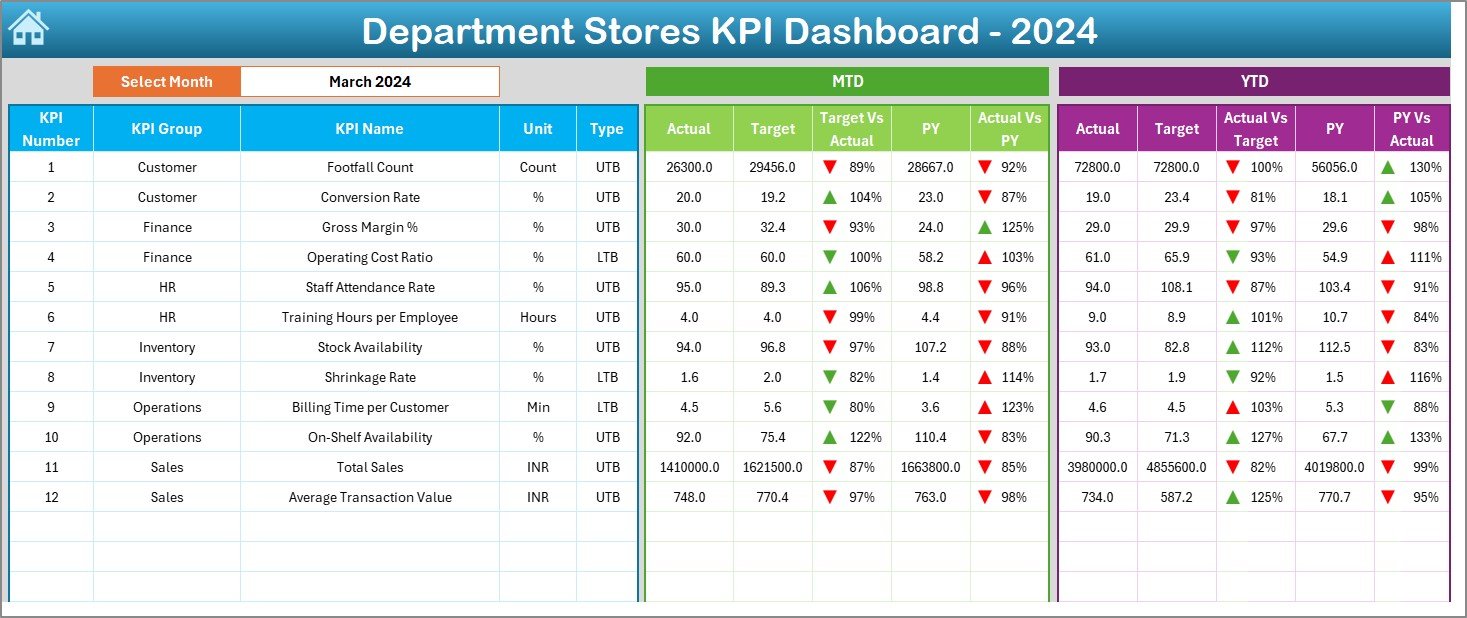
📌 Dashboard Page – Main page showing KPI cards, arrows, and MTD/YTD metrics
📌 KPI Trend Page – Select any KPI to view monthly trends and definitions
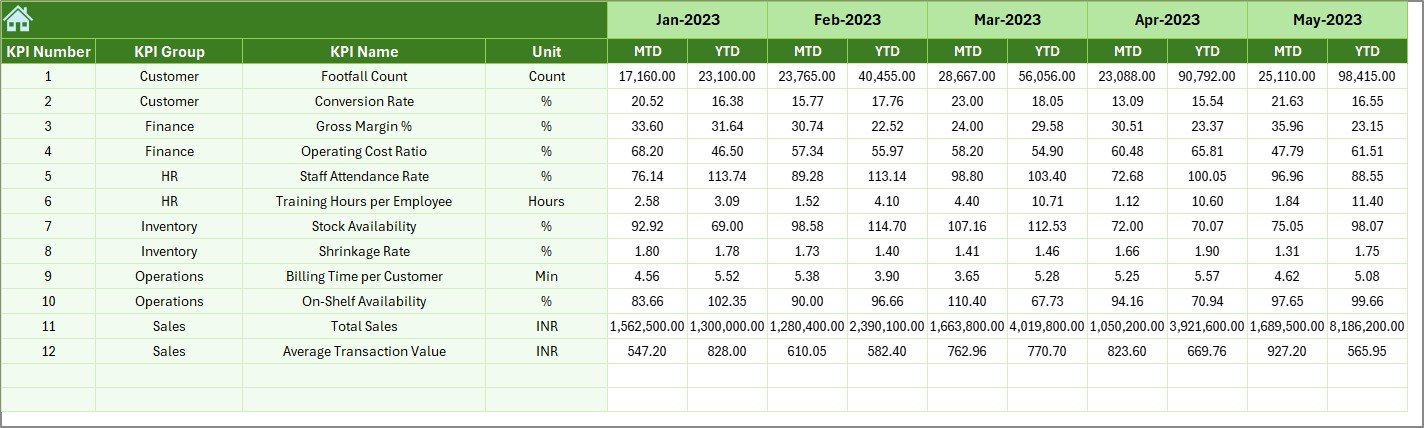
📌 Actual Numbers Input Sheet – Update MTD & YTD values easily
📌 Target Sheet – Store monthly KPI goals for accurate comparisons
📌 Previous Year Numbers Sheet – Keep historical benchmarks
📌 KPI Definition Sheet – Includes KPI names, groups, formulas, and meanings
Everything works together seamlessly to create a complete retail analytics system.
How to Use the Department Stores KPI Dashboard in Excel 🛠️
This dashboard is easy to use, even for beginners:
1️⃣ Choose the reporting month on the Dashboard page
2️⃣ Enter MTD and YTD actual values in the Actual Input sheet
3️⃣ Update monthly targets in the Target sheet
4️⃣ Keep previous year data up to date for accurate comparisons
5️⃣ Review arrows, percentages, and KPI cards in the Dashboard
6️⃣ Visit the KPI Trend page for deeper analysis and explanations
With just a few clicks, you get complete retail insights—no formulas, no manual charts, and no wasted time. ⚡
Who Can Benefit from This Department Stores KPI Dashboard? 👥
This tool is perfect for retail professionals across all levels:
🛍️ Store Managers – Monitor daily and monthly store operations
📈 Area & Regional Managers – Compare store performance easily
🧮 Retail Analysts – Analyze trends and KPIs for planning
📊 Leadership Teams – Use dashboard visuals for presentations
👥 Customer Experience Teams – Track satisfaction and returns
If your store wants better visibility, faster reporting, and stronger performance management—this dashboard is a must-have.


Reviews
There are no reviews yet.