Managing debt is one of the most critical responsibilities for finance teams and business owners. Organizations frequently rely on loans, credit facilities, and other financial instruments to fund operations, investments, and growth initiatives. However, when debt is not monitored carefully, it can quickly lead to financial instability, increasing interest costs, and higher financial risk.
This is where the Debt Management KPI Scorecard in Excel becomes a powerful financial monitoring tool.
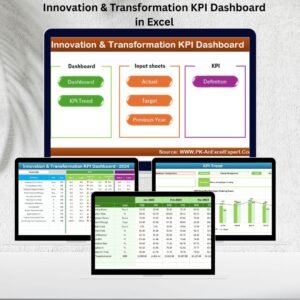
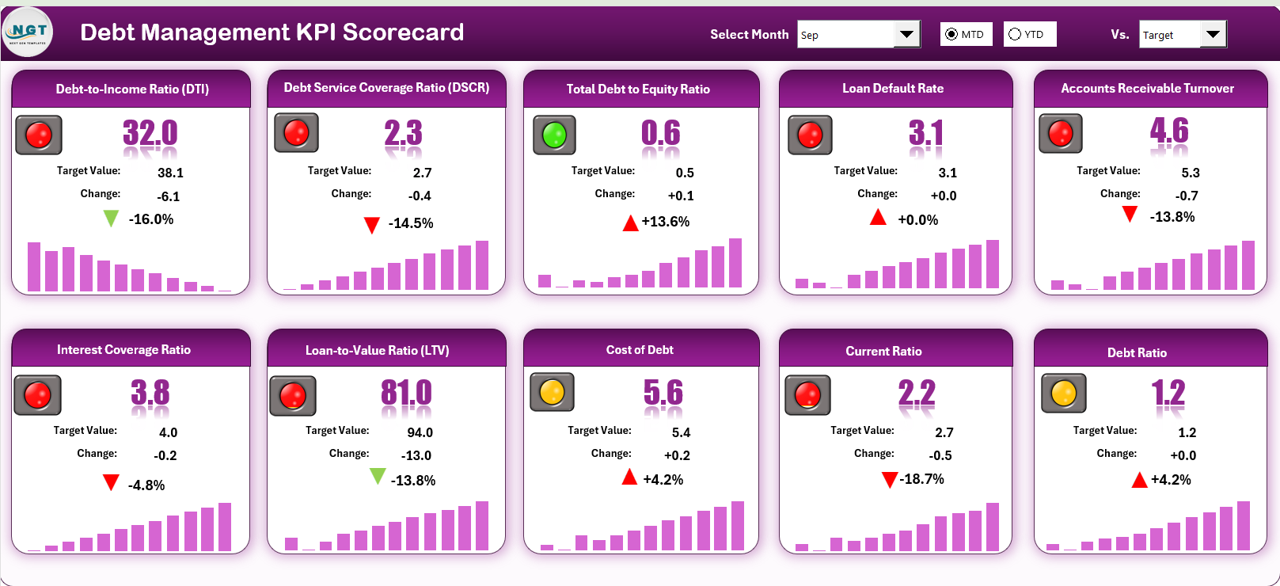
The Debt Management KPI Scorecard in Excel is a ready-to-use Excel template designed to help organizations track important debt-related KPIs in a structured and visual way. Instead of manually analyzing multiple financial reports, decision-makers can monitor debt performance from a single dashboard.
This template combines structured KPI tracking, visual performance indicators, and trend analysis, allowing finance teams to quickly evaluate debt health and make better financial decisions. With clear comparisons between actual values and targets, organizations can immediately detect performance gaps and take corrective actions.
Whether you manage corporate finances, run a small business, or monitor financial portfolios, this scorecard helps simplify debt monitoring and improve financial transparency.
🚀 Key Feature of Debt Management KPI Scorecard in Excel
The Debt Management KPI Scorecard provides a structured environment for monitoring financial performance related to loans, repayments, and debt obligations.
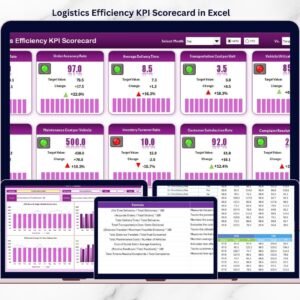
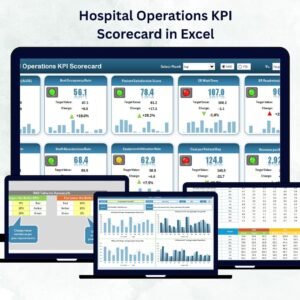
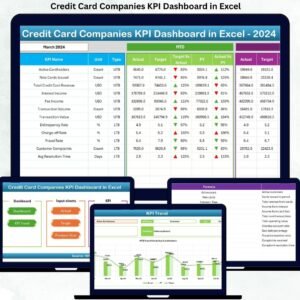
📊 Interactive KPI Dashboard
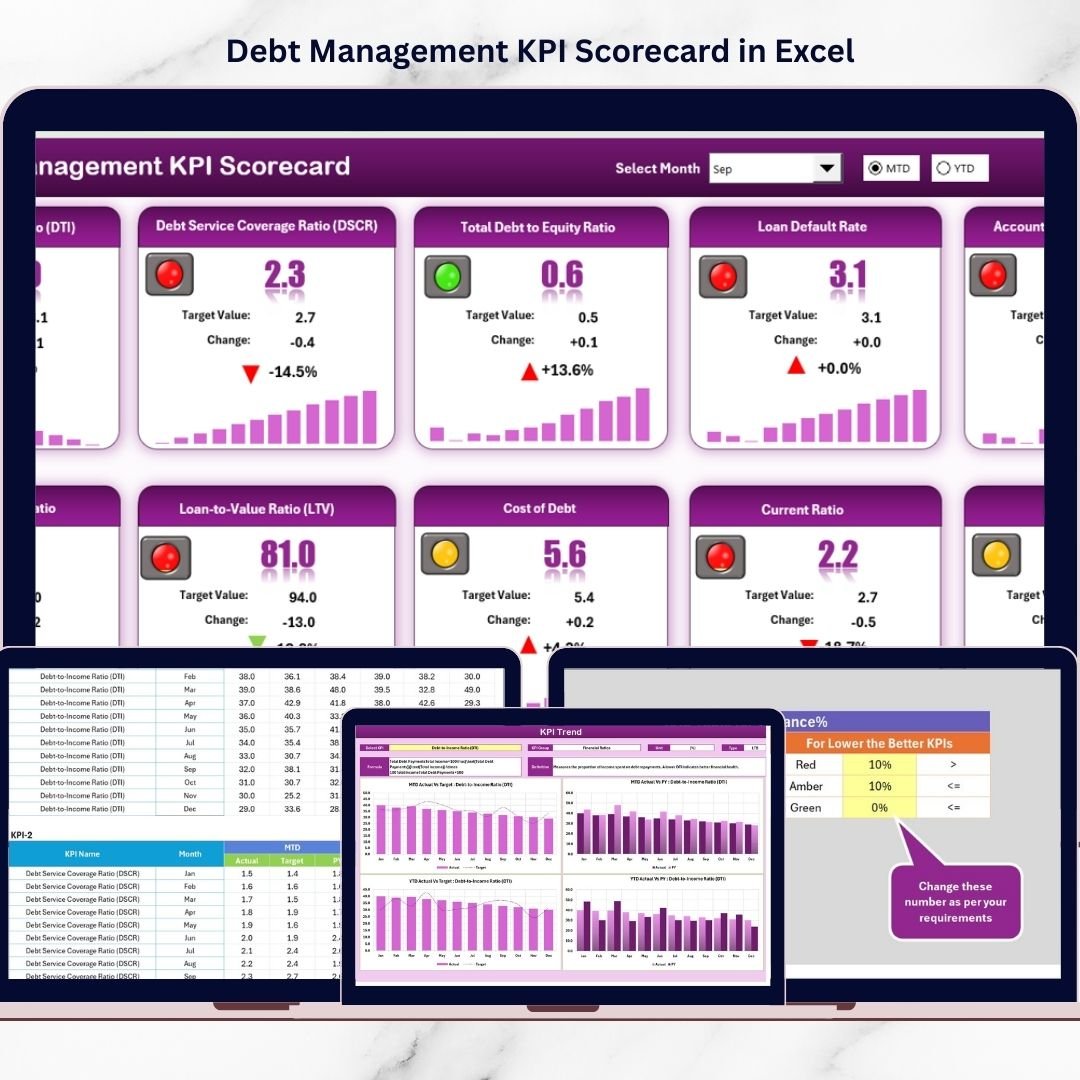
The scorecard sheet works as the main dashboard where users can instantly view KPI performance and compare results against targets.
📅 Month Selection with Dropdown
Users can easily analyze performance by selecting Month, MTD (Month-to-Date), or YTD (Year-to-Date) values using dropdown menus.
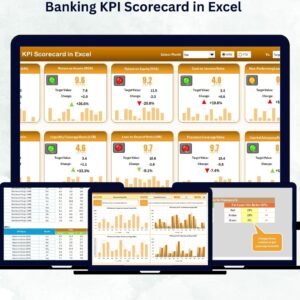
📈 Actual vs Target Performance Tracking
The dashboard clearly compares actual performance with target values, helping managers understand whether financial goals are being achieved.
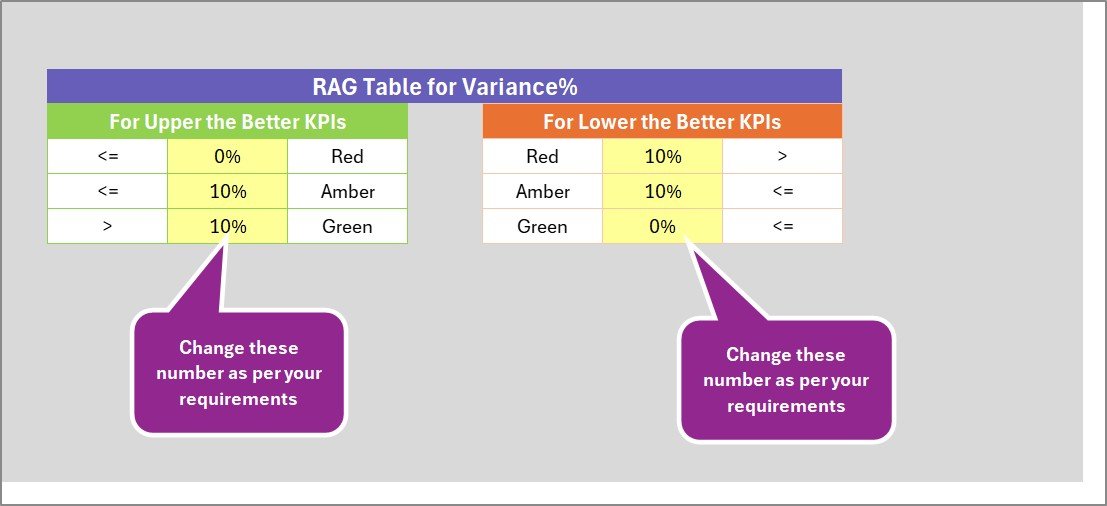
🚦 Visual Performance Indicators
Conditional formatting with color indicators and arrows highlights performance trends, allowing users to quickly identify improvements or risks.
📊 Track 10 Financial KPIs in One View
The dashboard displays ten critical debt management KPIs in a single interface, making financial monitoring fast and efficient.
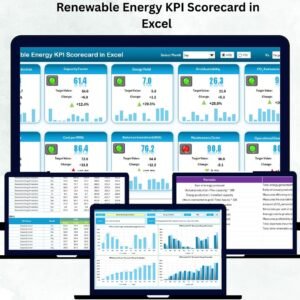
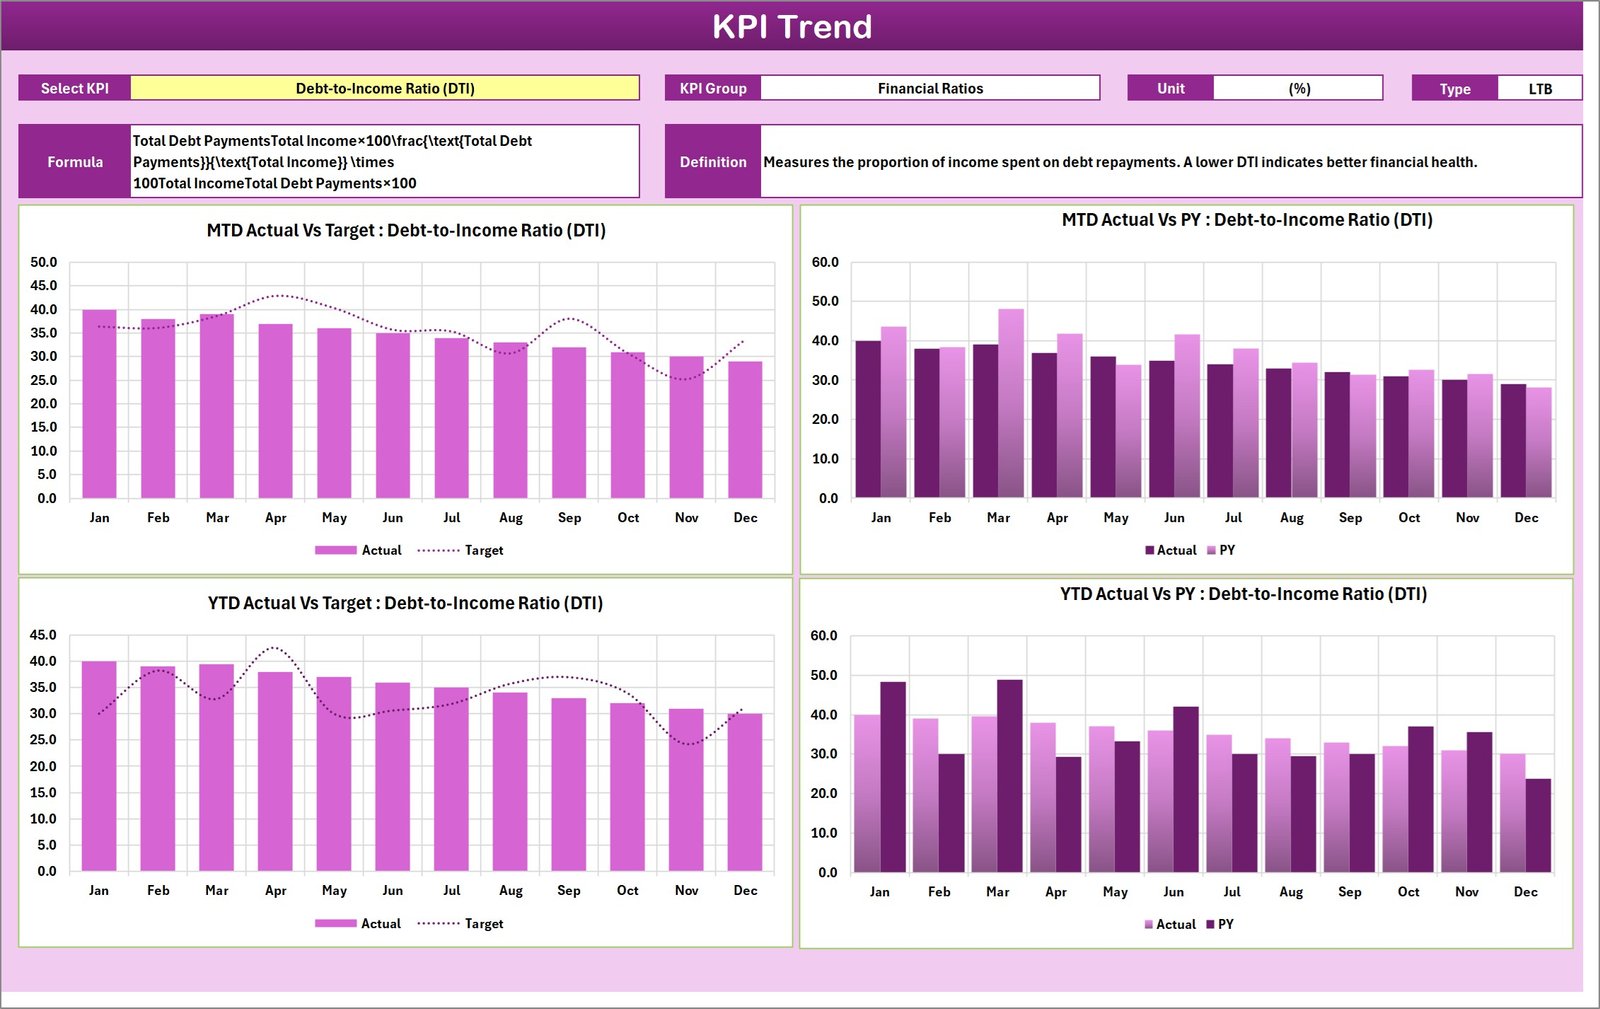
📉 KPI Trend Analysis
The KPI Trend sheet displays historical performance using charts, helping organizations evaluate trends and long-term debt performance patterns.
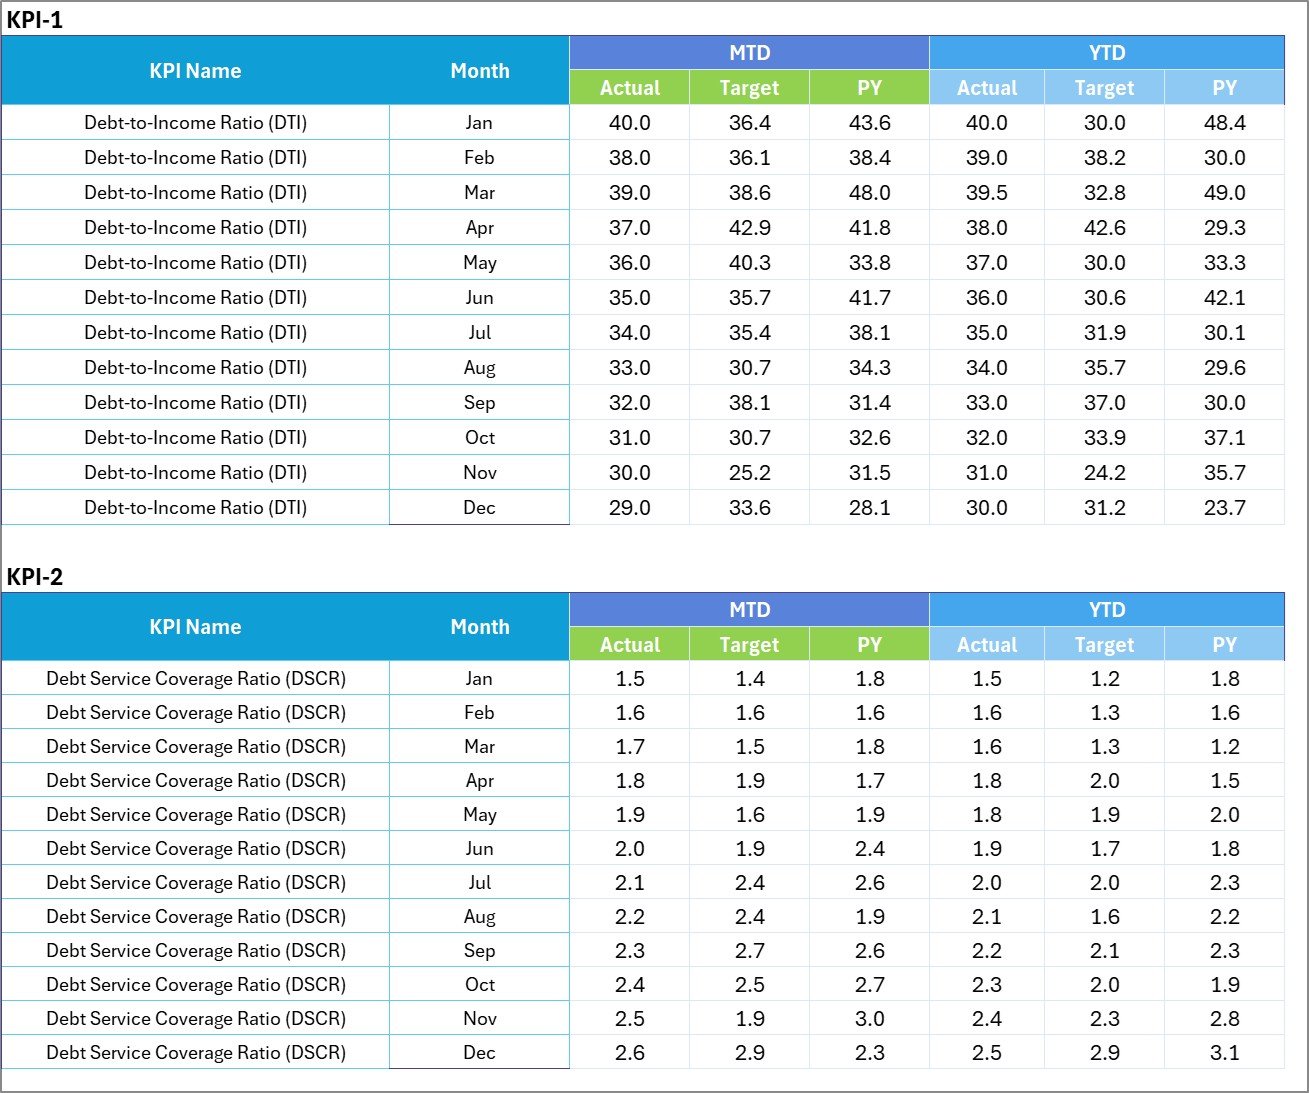
📂 Structured Data Management
The Input Data sheet ensures that all KPI values are recorded in one centralized location for accurate reporting.
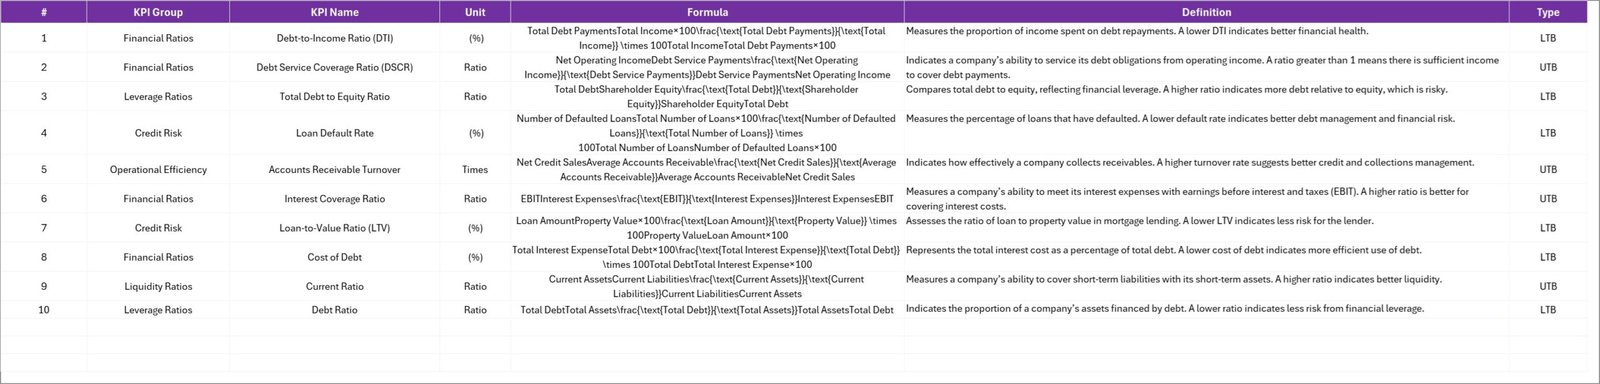
📘 Detailed KPI Documentation
The KPI Definition sheet explains each KPI with formulas, units, and definitions so teams can clearly understand every metric.
📦 What’s Inside the Debt Management KPI Scorecard in Excel
This ready-to-use template includes four professionally designed worksheets that simplify debt performance tracking.
📊 Scorecard Sheet – Main KPI Dashboard
Provides a complete overview of financial KPIs including Actual vs Target comparisons, MTD and YTD analysis, and performance indicators.
📈 KPI Trend Sheet – Performance Analysis
Displays KPI trend charts showing Actual, Target, and Previous Year performance, helping organizations identify financial patterns.
🧾 Input Data Sheet – Data Entry System
Allows users to record KPI values, targets, and monthly performance data in a structured format.
📚 KPI Definition Sheet – KPI Documentation
Contains detailed explanations of each KPI including KPI group, formula, measurement unit, and definition.
Together, these sheets create a complete financial monitoring system for debt performance management.
⚙️ How to Use the Debt Management KPI Scorecard in Excel
Using this Excel template is simple and requires no advanced technical skills.
Step 1 – Define Financial KPIs
Identify important debt performance indicators such as debt ratios, repayment efficiency, and interest costs.
Step 2 – Enter Data in the Input Sheet
Record monthly KPI values and target numbers in the Input Data worksheet.
Step 3 – Select Month or Analysis Type
Use the dropdown menu in the Scorecard sheet to select the desired reporting period.
Step 4 – Review KPI Performance
Analyze actual vs target values using visual indicators and conditional formatting.
Step 5 – Analyze Trends
Use the KPI Trend sheet to monitor historical performance and identify improvement opportunities.
By following these steps, organizations can build a consistent and reliable debt monitoring system.
👥 Who Can Benefit from This Debt Management KPI Scorecard in Excel
This template is useful for many professionals and organizations that need to monitor financial obligations.
🏢 Corporate Finance Teams – Monitor loans, repayments, and financial stability.
💼 Financial Analysts – Evaluate debt performance and identify financial risks.
📊 Business Owners & Entrepreneurs – Track borrowing costs and repayment efficiency.
🏦 Financial Institutions – Monitor loan portfolios and repayment performance.
📈 Accounting Professionals – Maintain structured financial monitoring systems.
🎓 Finance Students & Researchers – Study financial ratios and debt performance indicators.
Anyone responsible for managing financial obligations can use this template to gain better financial visibility and control.
Click here to read the Detailed blog post
Watch the step-by-step video tutorial:
Watch the step-by-step video tutorial: