In today’s fast-moving digital economy, data science and analytics teams are under constant pressure to deliver insights faster, track performance accurately, and justify business impact clearly. Data Science and Analytics KPI Dashboard in Power BI However, many teams still rely on disconnected Excel sheets, manual calculations, and static reports. As a result, reporting becomes slow, errors increase, and leadership struggles to understand real performance.
That is exactly where the Data Science and Analytics KPI Dashboard in Power BI becomes a powerful, game-changing solution 📊🔥.
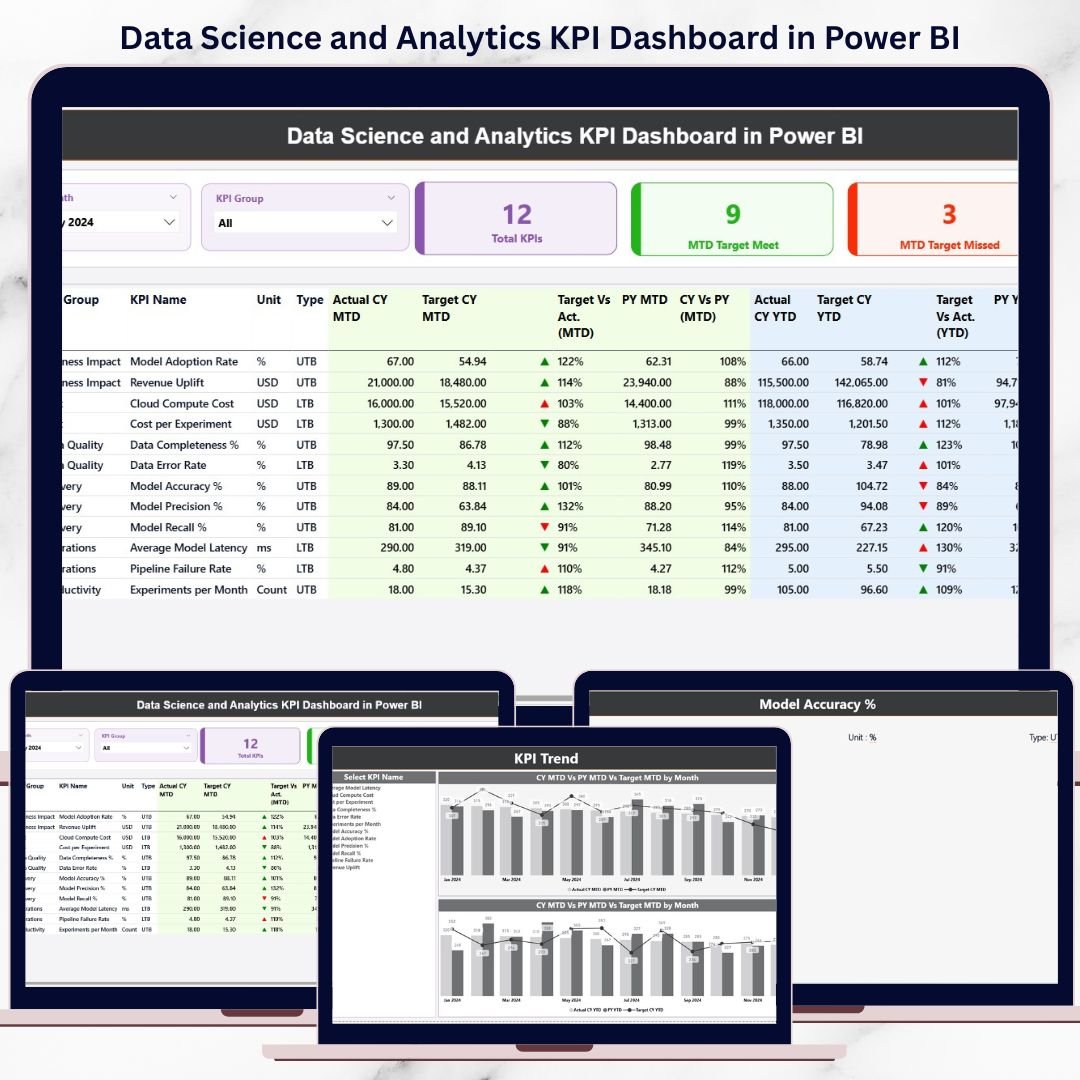
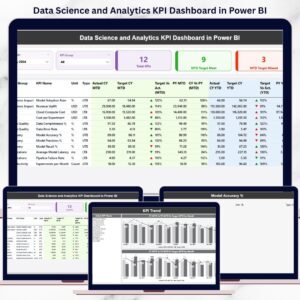
Data Science and Analytics KPI Dashboard in Power BI This ready-to-use Power BI dashboard transforms raw analytics data into clear, interactive, and business-ready insights. Instead of checking multiple reports, teams can monitor all key analytics KPIs in one centralized dashboard. With automated MTD, YTD, and Year-over-Year comparisons, this dashboard helps teams move from reporting data to managing performance with confidence.
Built using Excel as the data source and Power BI as the visualization engine, this dashboard is simple to use, easy to maintain, and scalable for growing analytics teams.
🔑 Key Features of Data Science and Analytics KPI Dashboard in Power BI
📊 Centralized KPI Monitoring
Track all data science and analytics KPIs from one interactive dashboard instead of juggling multiple reports.
📅 MTD & YTD Performance Tracking
Monitor Month-to-Date and Year-to-Date performance to balance short-term execution with long-term analytics goals.
🎯 Target vs Actual Comparison
Instantly identify KPIs that meet or miss targets using visual indicators and percentage comparisons.
📈 Year-over-Year Growth Analysis
Compare Current Year vs Previous Year performance to measure real improvement in analytics maturity.
🎛️ Interactive Slicers
Use Month and KPI Group slicers to focus on specific periods or KPI categories effortlessly.
🔍 Drill-Through KPI Definitions
Access KPI formulas and definitions directly from the dashboard for transparency and audit readiness.
📦 What’s Inside the Data Science and Analytics KPI Dashboard in Power BI
This professionally designed Power BI file includes three powerful analytical pages; each created for a specific reporting purpose:
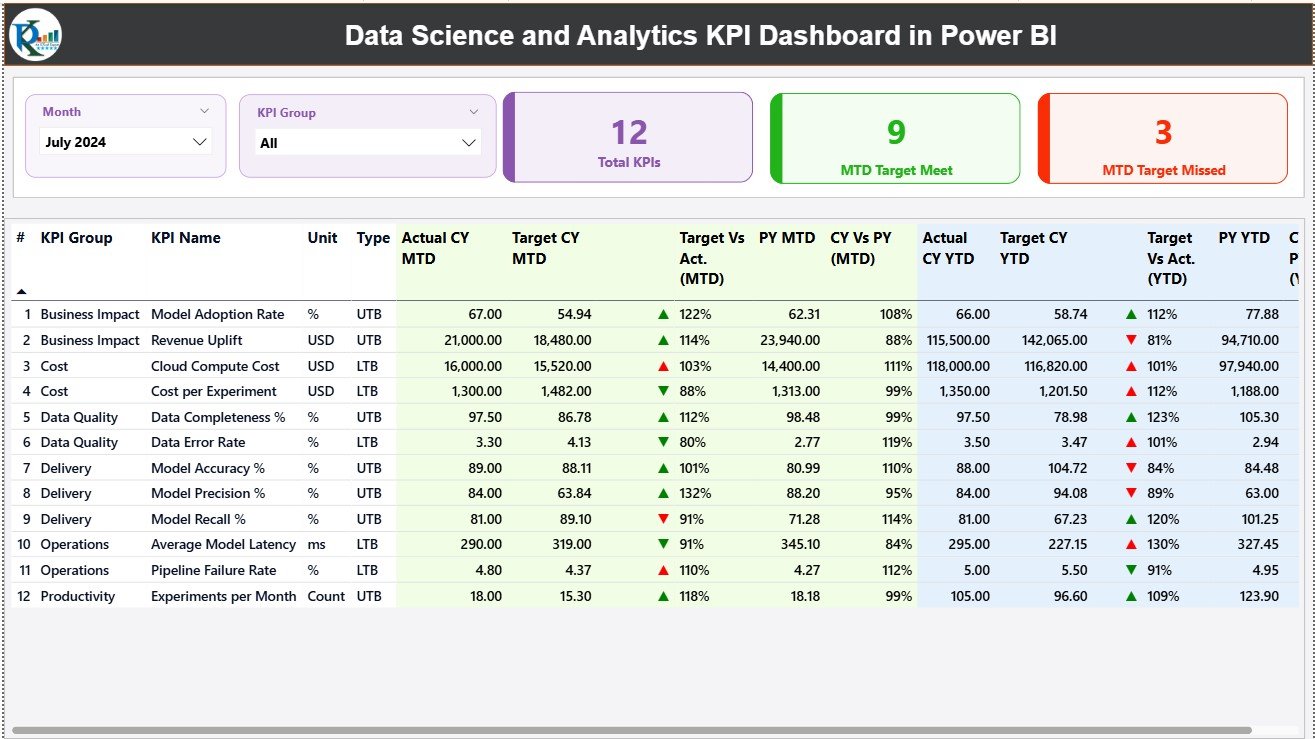
📊 Summary Page
The main landing page that provides:
-
Month and KPI Group slicers
-
KPI cards showing Total KPIs, MTD Target Met, and MTD Target Missed
-
A detailed KPI table with Actual, Target, and Previous Year values for both MTD and YTD
-
Performance icons (▲▼) for instant status identification
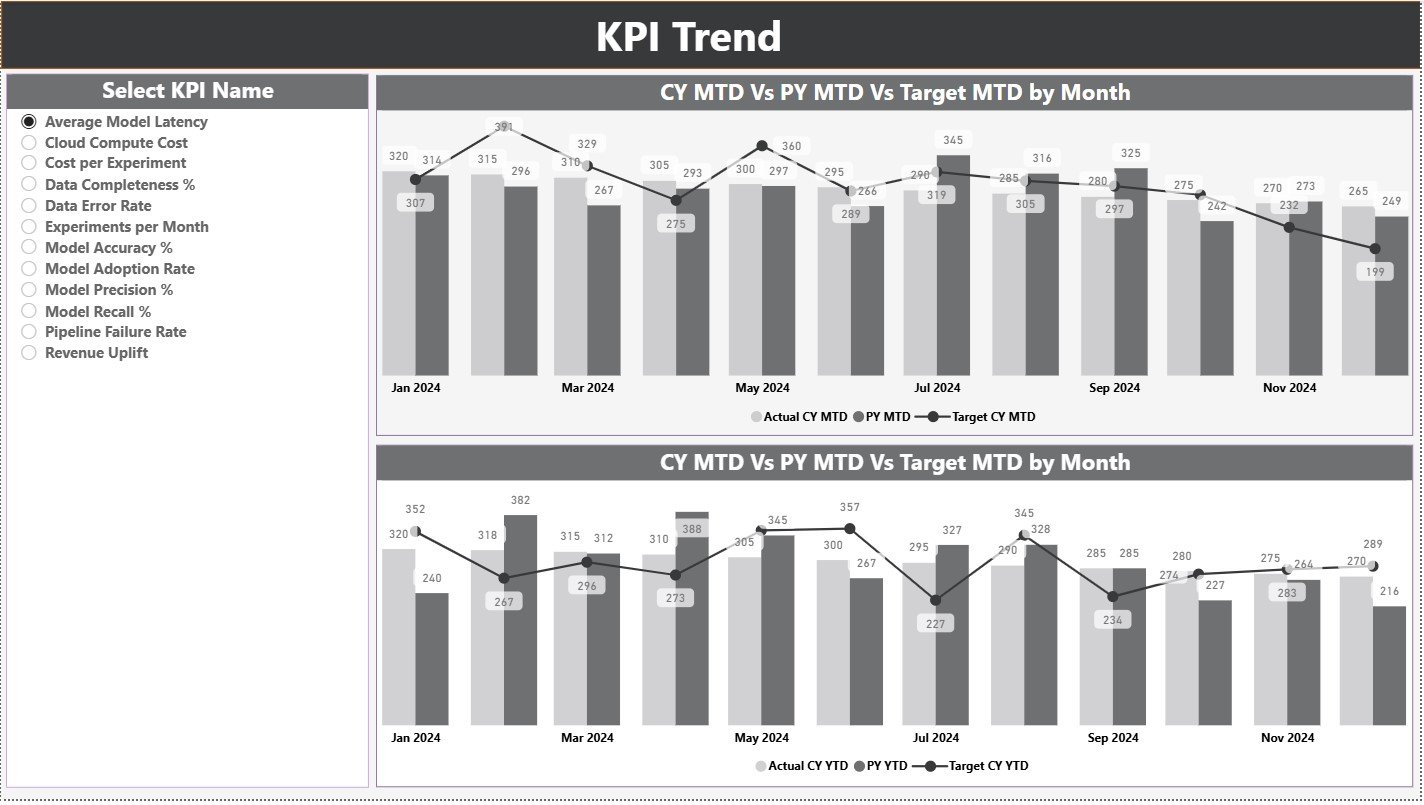
📉 KPI Trend Page
Analyze performance trends using:
-
KPI Name slicer
-
MTD trend combo chart (Actual, Target, PY)
-
YTD trend combo chart (Actual, Target, PY)
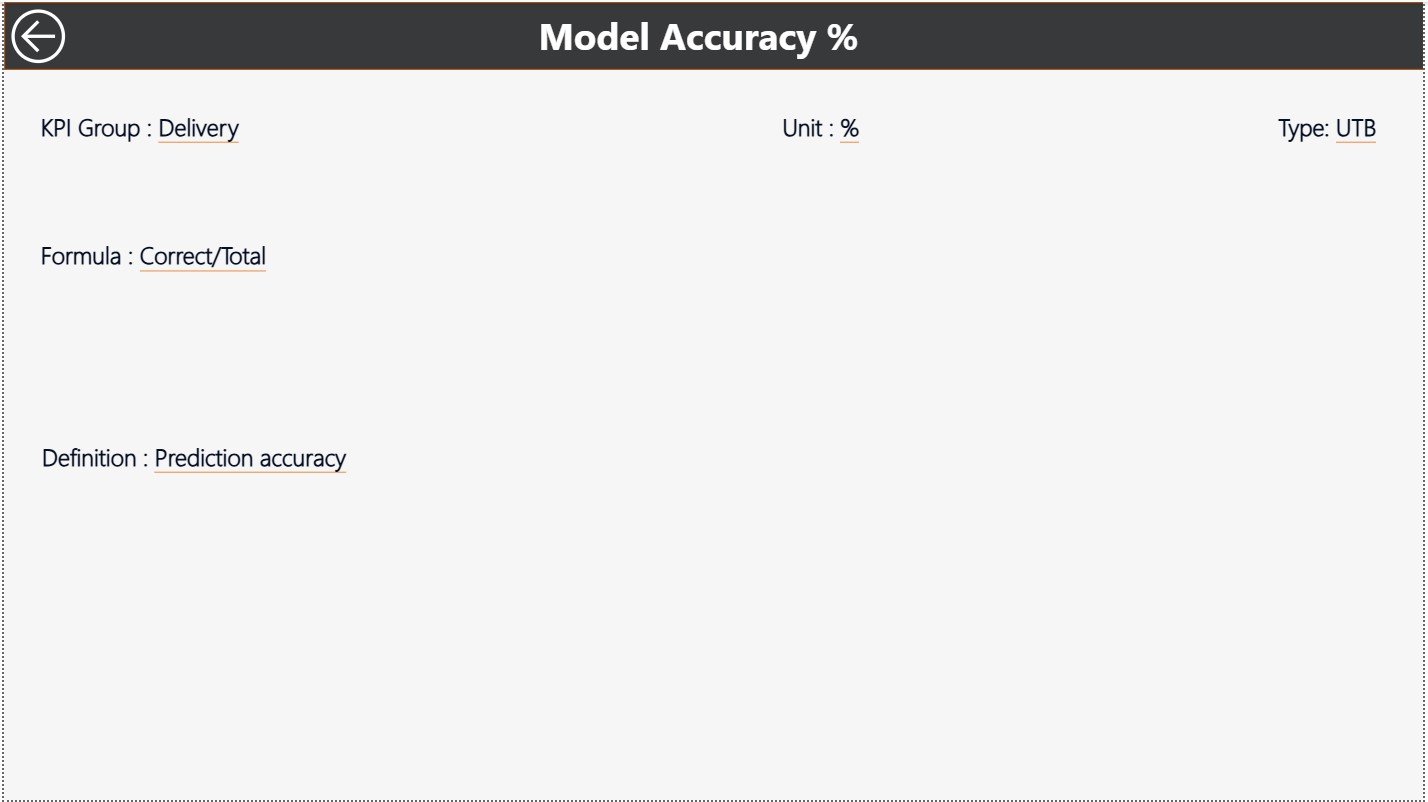
📘 KPI Definition Page (Drill-Through)
A hidden reference page that displays:
-
KPI formula
-
KPI definition
-
Unit and KPI type (LTB or UTB)
Additionally, the dashboard connects seamlessly to an Excel input file with structured sheets for Actuals, Targets, and KPI Definitions—making updates quick and error-free.
🛠️ How to Use the Data Science and Analytics KPI Dashboard in Power BI
Using this dashboard is straightforward and user-friendly:
1️⃣ Enter Actual MTD and YTD values in Excel
2️⃣ Define monthly and yearly targets
3️⃣ Maintain KPI definitions and types
4️⃣ Refresh the Power BI file
5️⃣ Instantly view updated insights and visuals
Because all calculations are automated, teams reduce manual effort and focus on delivering insights that matter.
👥 Who Can Benefit from This Data Science and Analytics KPI Dashboard in Power BI
This dashboard is ideal for:
📈 Data Science Teams
📊 Analytics & BI Managers
🏢 Business Intelligence Teams
📦 Product & Growth Teams
🧠 CXOs & Leadership Teams
🤝 Consulting & Analytics Firms
Whether you manage models, analytics delivery, or business impact, this dashboard helps communicate performance clearly and confidently.


Reviews
There are no reviews yet.