The Dairy Industry Dashboard moves fast. Milk prices fluctuate daily. Demand shifts weekly. Distribution costs rise frequently. Therefore, dairy businesses must monitor performance closely to protect margins and maintain profitability.
However, many dairy companies still rely on scattered spreadsheets. As a result, managers struggle to track sales, costs, profit margins, and pending orders in one place. They miss trends. They lose control over sales channels. They fail to identify profitable product categories.
That is exactly why the Dairy Industry Dashboard in Excel becomes a powerful business solution 🥛📊.
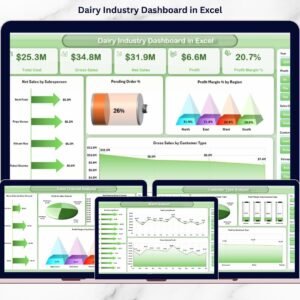
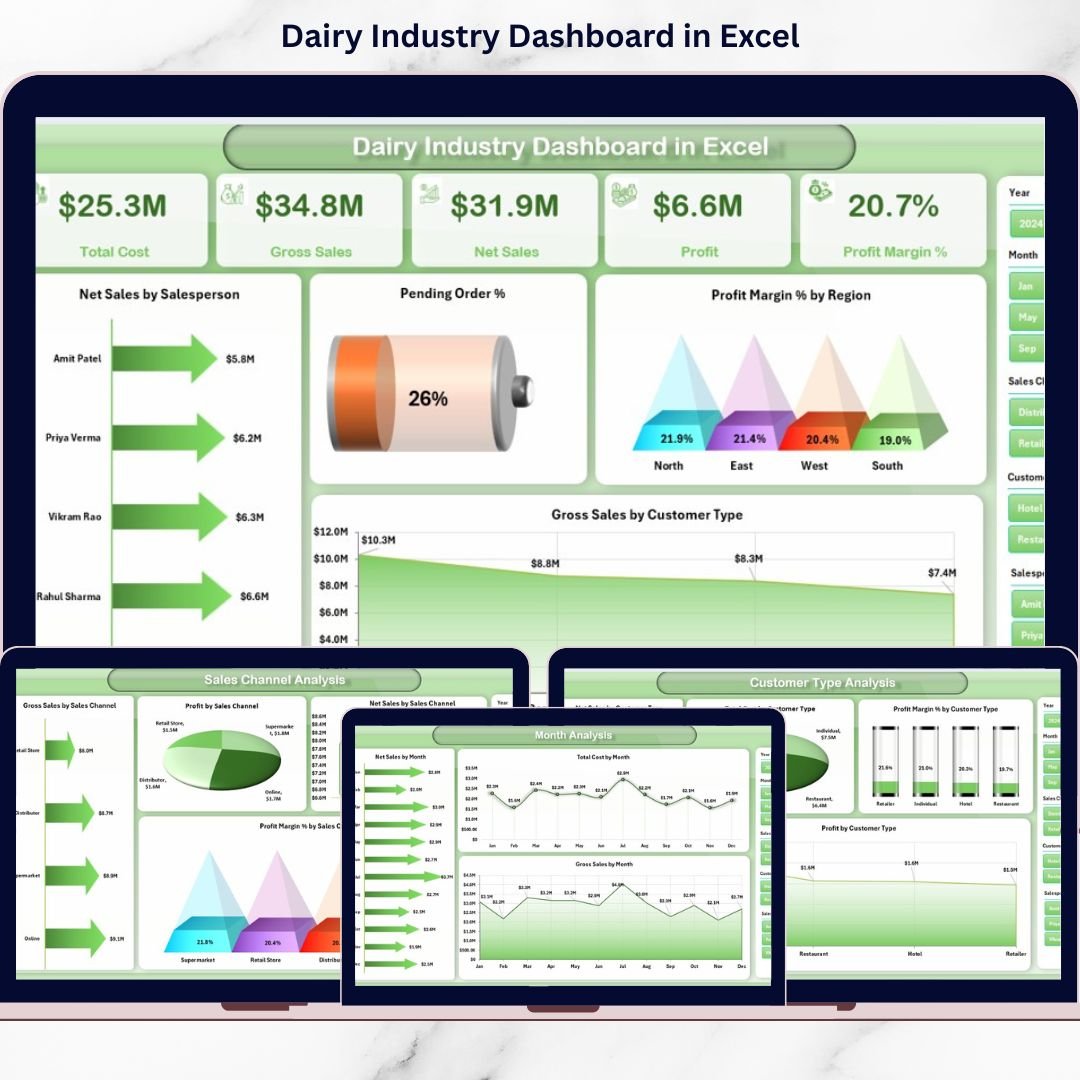
This ready-to-use Excel dashboard converts raw dairy sales and operational data into structured, interactive insights. Instead of juggling multiple sheets, you manage everything in one centralized system. With dynamic slicers, pivot charts, and KPI cards, you instantly see Net Sales, Gross Sales, Total Cost, Profit Margin %, Pending Orders %, and performance by region, channel, product, and customer type.
Because it runs inside Excel desktop, you avoid expensive BI tools. Simply update the Data Sheet — and the dashboard updates automatically.
🔑 Key Features of Dairy Industry Dashboard in Excel
🥛 Comprehensive KPI Tracking
Monitor Net Sales, Gross Sales, Cost, Profit, and Margin in one place.
📊 5 Interactive Analytical Pages
Analyze performance by Product, Channel, Customer, and Month.
🎯 Salesperson Performance Monitoring
Identify top and underperforming team members instantly.
📈 Profit Margin Focused Insights
Go beyond sales and track true profitability.
📅 Seasonal Trend Analysis
Track monthly fluctuations and demand cycles.
🎛️ Interactive Slicers & Pivot Charts
Filter data dynamically by month, region, category, or channel.
📂 Data & Support Sheets Included
Structured backend ensures smooth dashboard functionality.
📦 What’s Inside the Dairy Industry Dashboard in Excel
This dashboard includes 5 analytical pages plus Support & Data Sheets.
1️⃣ Overview Page – Executive Snapshot
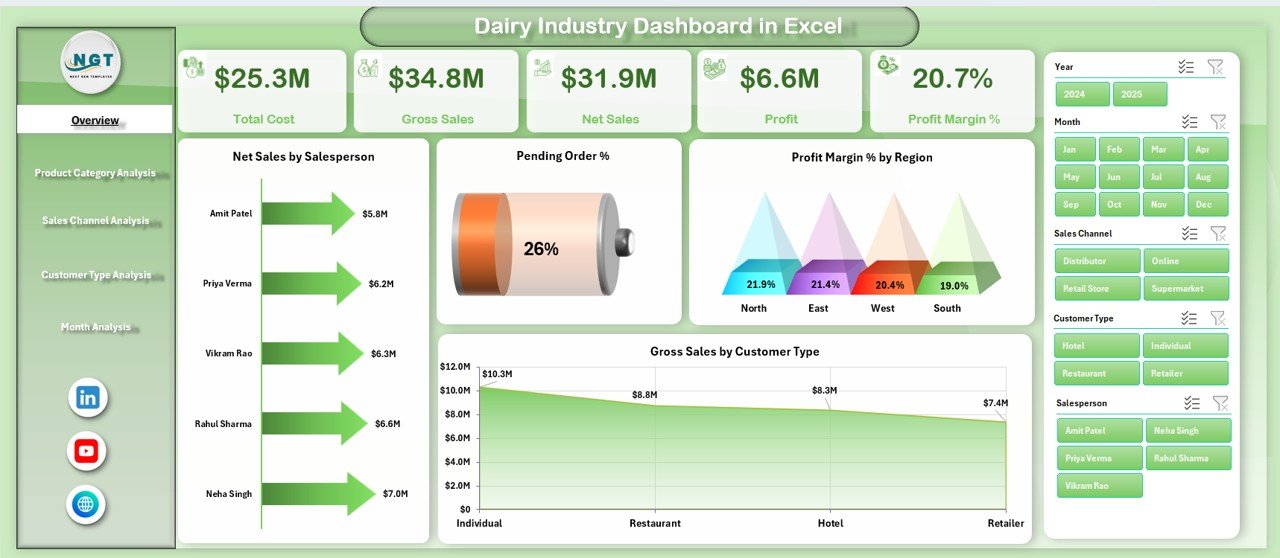
Your control center for dairy operations.
🔹 4 KPI Cards:
-
Total Net Sales
-
Total Gross Sales
-
Total Cost
-
Profit Margin %
🔹 4 Key Charts:
-
Net Sales by Salesperson
-
Pending Order %
-
Profit Margin % by Region
-
Gross Sales by Customer Type
Get a 360-degree performance view instantly.
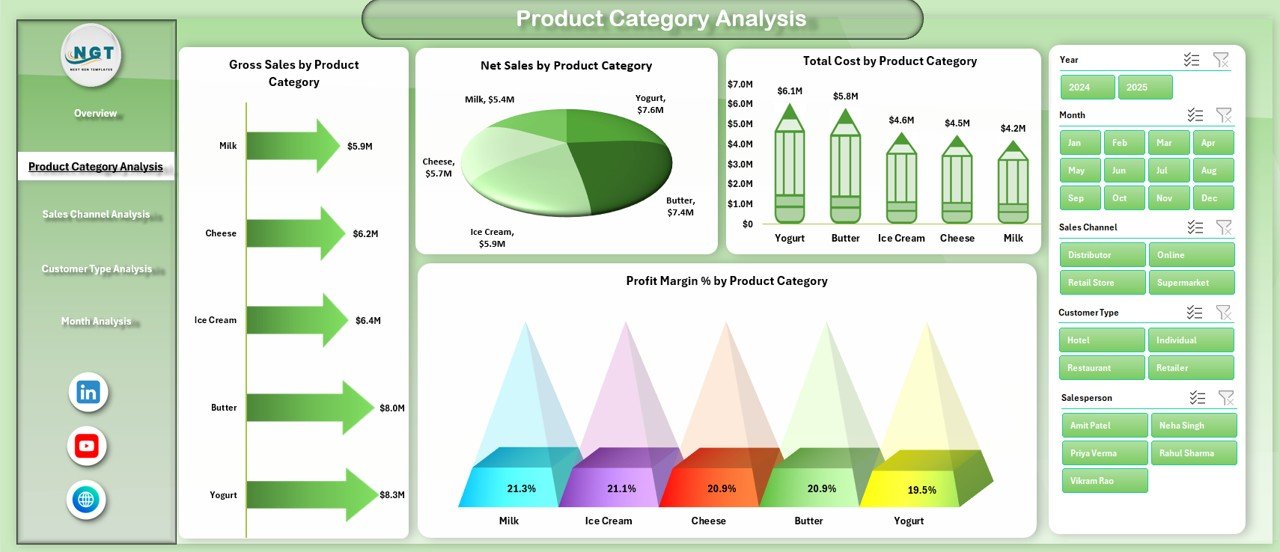
2️⃣ Product Category Analysis Page
Analyze performance by product categories such as:
Milk
Butter
Cheese
Yogurt
Cream
Paneer
Ice Cream
🔹 Charts Include:
-
Gross Sales by Product Category
-
Net Sales by Product Category
-
Total Cost by Product Category
-
Profit Margin % by Product Category
Identify high-volume vs high-margin products easily.
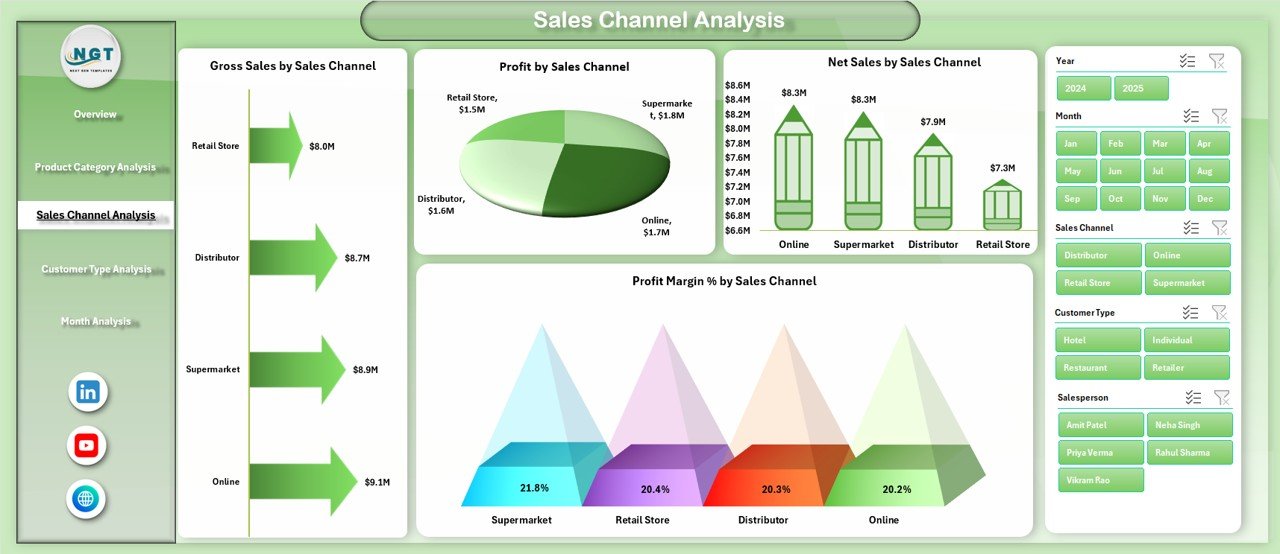
3️⃣ Sales Channel Analysis Page
Compare performance across:
Retail Stores
Supermarkets
Distributors
Online Sales
Direct Sales
🔹 Charts Include:
-
Gross Sales by Sales Channel
-
Net Sales by Sales Channel
-
Profit by Sales Channel
-
Profit Margin % by Sales Channel
Optimize channel strategy and improve ROI.
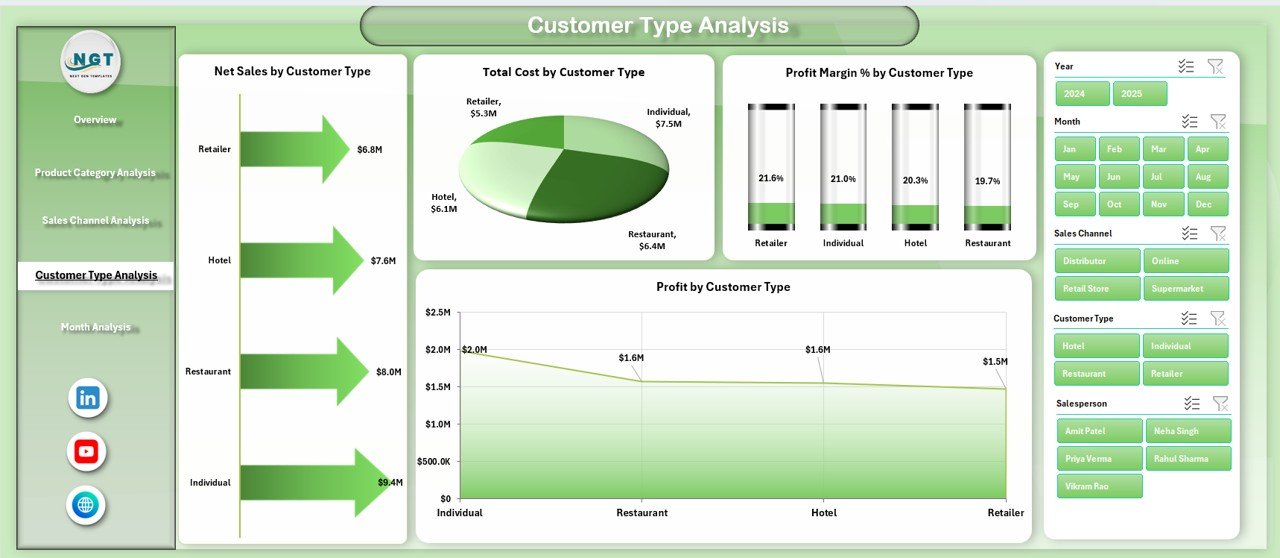
4️⃣ Customer Type Analysis Page
Analyze profitability by:
Wholesalers
Retailers
Institutional Buyers
Direct Consumers
🔹 Charts Include:
-
Total Cost by Customer Type
-
Net Sales by Customer Type
-
Profit by Customer Type
-
Profit Margin % by Customer Type
Strengthen high-value customer relationships.
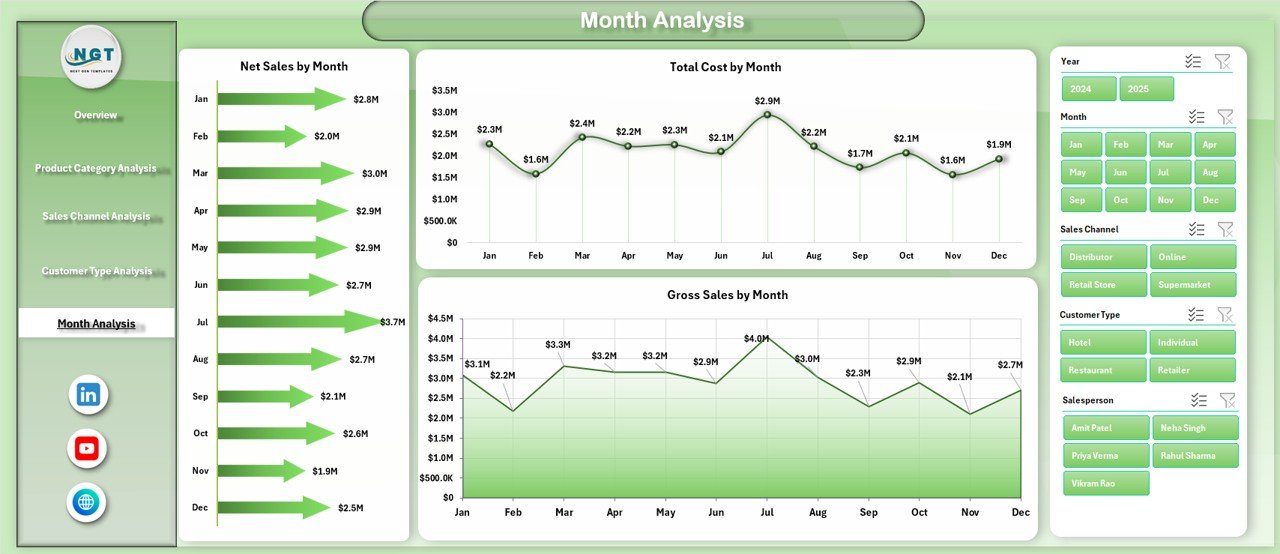
5️⃣ Month Analysis Page
Track seasonal and monthly trends.
🔹 Charts Include:
-
Total Cost by Month
-
Net Sales by Month
-
Gross Sales by Month
Plan production and distribution strategically.
🛠️ How to Use the Dairy Industry Dashboard in Excel
1️⃣ Enter sales and cost data in the Data Sheet
2️⃣ Ensure columns include Date, Salesperson, Region, Product Category, Customer Type, Sales Channel, Gross Sales, Cost
3️⃣ Refresh Pivot Tables
4️⃣ Use slicers to filter performance
5️⃣ Review KPI cards and charts
6️⃣ Identify high-margin products & channels
7️⃣ Take corrective actions
Within minutes, your dairy data turns into business intelligence.
👥 Who Can Benefit from This Dairy Industry Dashboard in Excel
🥛 Dairy Manufacturers
🚚 Dairy Distributors
🏬 Retail Dairy Chains
📊 Sales Managers
💰 Financial Controllers
📦 Supply Chain Managers
If you manage dairy sales, cost, or distribution performance, this dashboard strengthens control and profitability.