Tired of manually tracking customer complaints and struggling to improve satisfaction rates? 😫
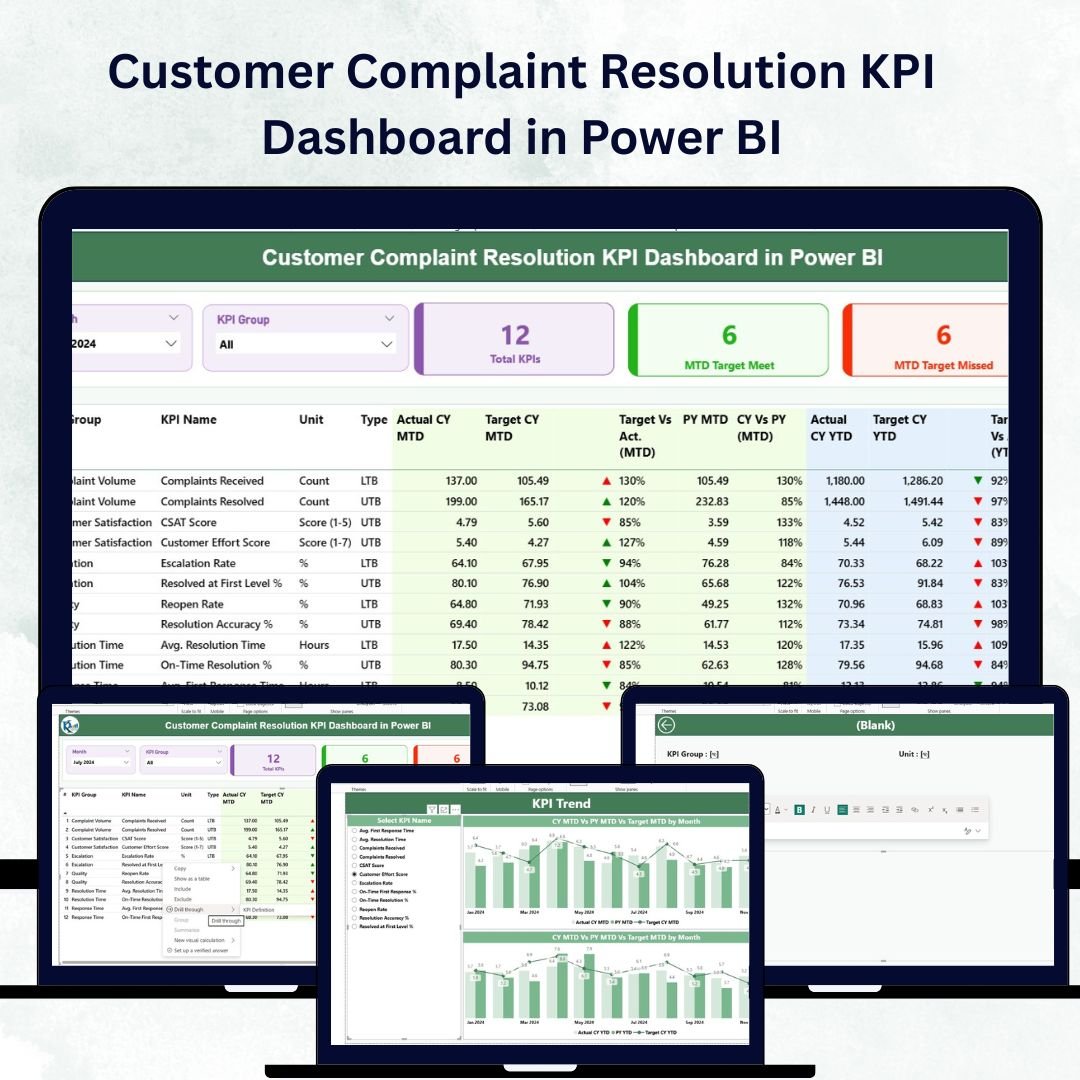
Say hello to the Customer Complaint Resolution KPI Dashboard in Power BI — your all-in-one solution for visualizing complaint trends, monitoring KPIs, and driving service excellence 📊.Customer Complaint Resolution KPI Dashboard in Power BI
Built with Power BI’s interactive visuals and Excel integration, this dashboard transforms raw data into powerful insights. Whether you manage a customer service team, operations center, or feedback department, this tool helps you analyze performance in real-time and resolve issues faster than ever.Customer Complaint Resolution KPI Dashboard in Power BI
✨ Key Features of Customer Complaint Resolution KPI Dashboard in Power BI
✅ 3 Interactive Dashboard Pages — Includes Summary, KPI Trend, and KPI Definition pages to cover every analytical angle.
✅ Real-Time Data Visualization — Track key metrics like Resolution Rate, Response Time, and Customer Satisfaction in one view.Customer Complaint Resolution KPI Dashboard in Power BI
✅ Excel Integration — Seamlessly updates from your Excel file, ensuring accurate and current data every time you refresh Power BI.Customer Complaint Resolution KPI Dashboard in Power BI
✅ Automated Insights — Instantly view Month-to-Date (MTD) and Year-to-Date (YTD) performance across KPIs.
✅ Performance Icons & Color Indicators — Spot issues instantly with up/down arrows and conditional formatting.
✅ Drill-Through Functionality — Click any KPI to view its formula, type (LTB/UTB), and definition in detail.
✅ Dynamic Filtering — Analyze performance by month, KPI group, or specific KPI name using interactive slicers.
✅ Customizable Design — Tailor KPIs, visuals, and themes to fit your business needs or department goals.Customer Complaint Resolution KPI Dashboard in Power BI
📂 What’s Inside the Customer Complaint Resolution KPI Dashboard
This ready-to-use Power BI dashboard is structured into three key pages for seamless analysis:
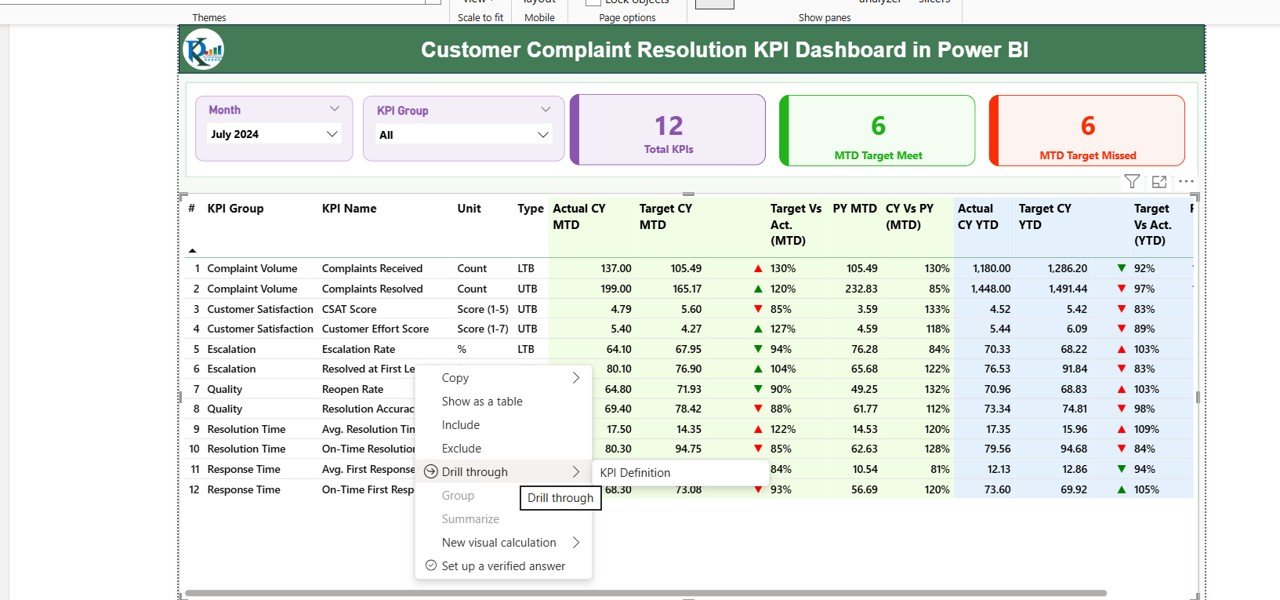
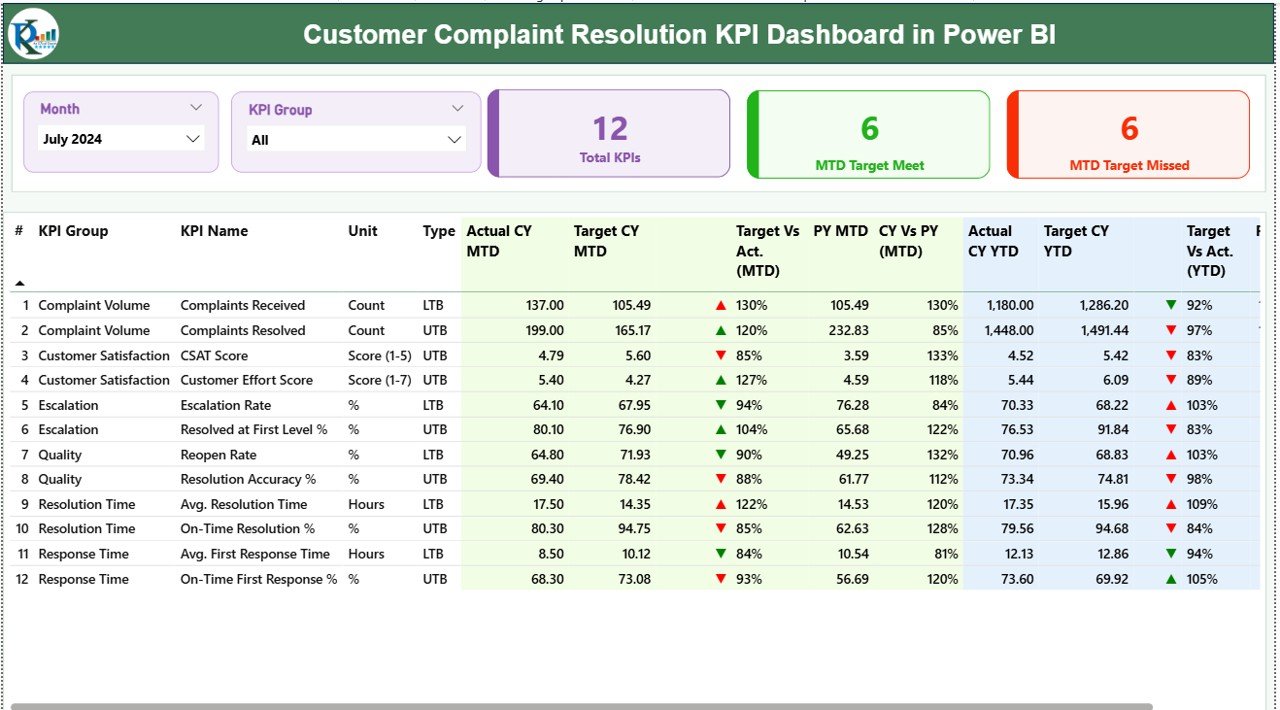
1️⃣ Summary Page:Customer Complaint Resolution KPI Dashboard in Power BI
-
Displays total KPIs, MTD Target Met, and Target Missed counts.
-
Includes a detailed table showing Actual vs Target and Current vs Previous Year data with performance icons.
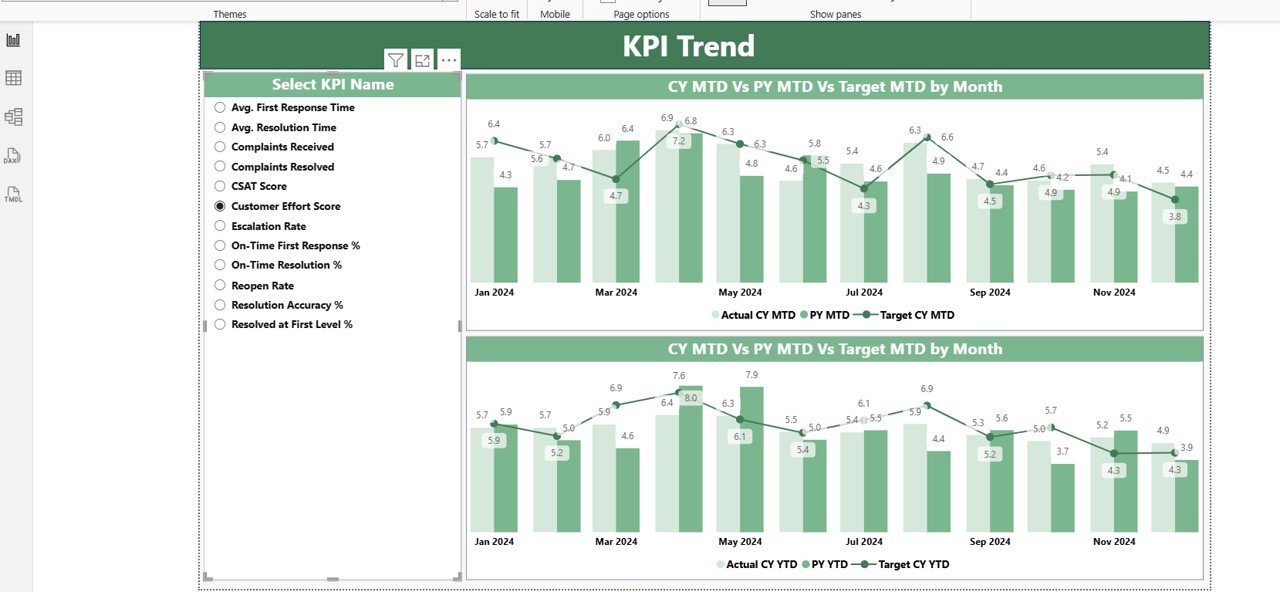
2️⃣ KPI Trend Page:
-
Two combo charts compare Actual, Target, and Previous Year performance.
-
A dynamic slicer lets you focus on any single KPI to see historical trends.
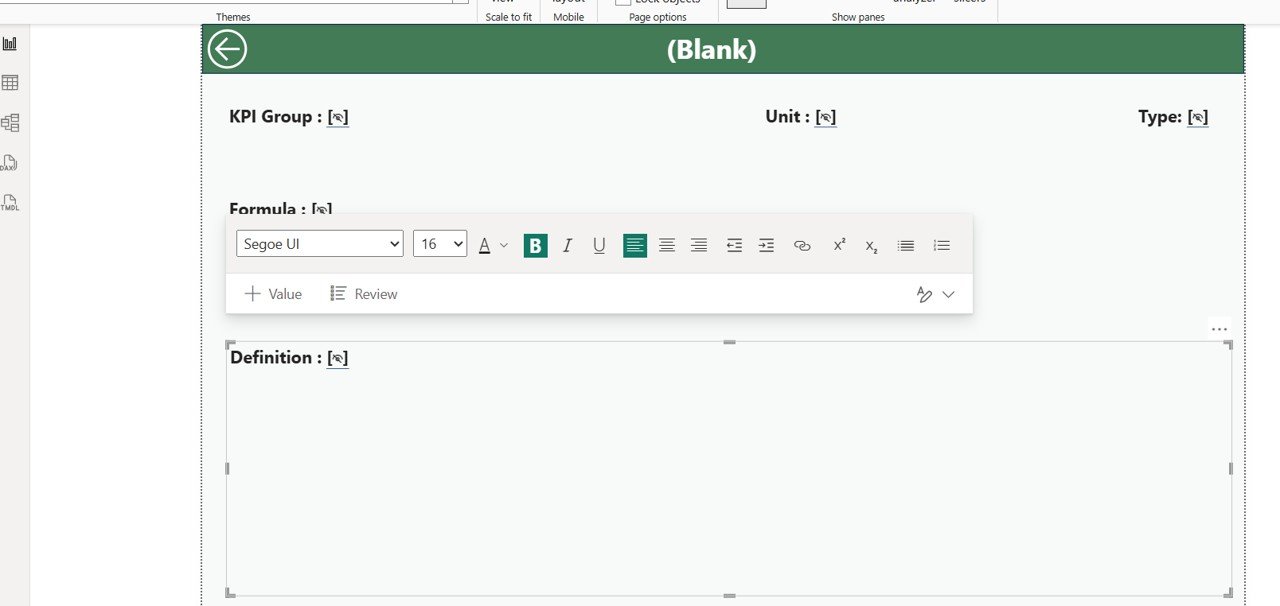
3️⃣ KPI Definition Page:
-
Lists each KPI’s formula, type (LTB or UTB), and definition.
-
Includes a “Back” button for quick navigation to the main page.
📘 Excel Data Source Included:
The dashboard connects directly to an Excel workbook containing:
-
Input_Actual Sheet (Actual values by month and KPI)
-
Input_Target Sheet (Monthly and yearly targets)
-
KPI Definition Sheet (Details of KPI name, formula, and type)
⚙️ How to Use the Customer Complaint Resolution KPI Dashboard
1️⃣ Update Excel Monthly: Enter the latest actual and target data before refreshing Power BI.
2️⃣ Open in Power BI Desktop: Load the dashboard and click “Refresh” to update visuals instantly.
3️⃣ Use Slicers: Filter by Month or KPI Group for focused analysis.
4️⃣ Track Icons: Green ▲ = Success; Red ▼ = Improvement Needed.
5️⃣ Drill Through: Right-click on any KPI to view its full definition and formula.
💡 Pro Tip: Schedule Power BI auto-refresh to keep data live and up-to-date at all times!
👥 Who Can Benefit from This Dashboard
🌐 Customer Service Teams – Monitor complaint resolution efficiency in real-time.
🏢 Operations Managers – Identify bottlenecks and allocate resources efficiently.
📈 Quality Assurance Professionals – Measure response time and satisfaction trends.
💬 CX (Customer Experience) Specialists – Improve feedback loops and reduce repeat complaints.
🧭 Executives & Business Leaders – Gain quick insights into service performance through KPI summaries.
No matter your business size or industry, this dashboard gives you the clarity you need to take action faster and deliver world-class service.


Reviews
There are no reviews yet.