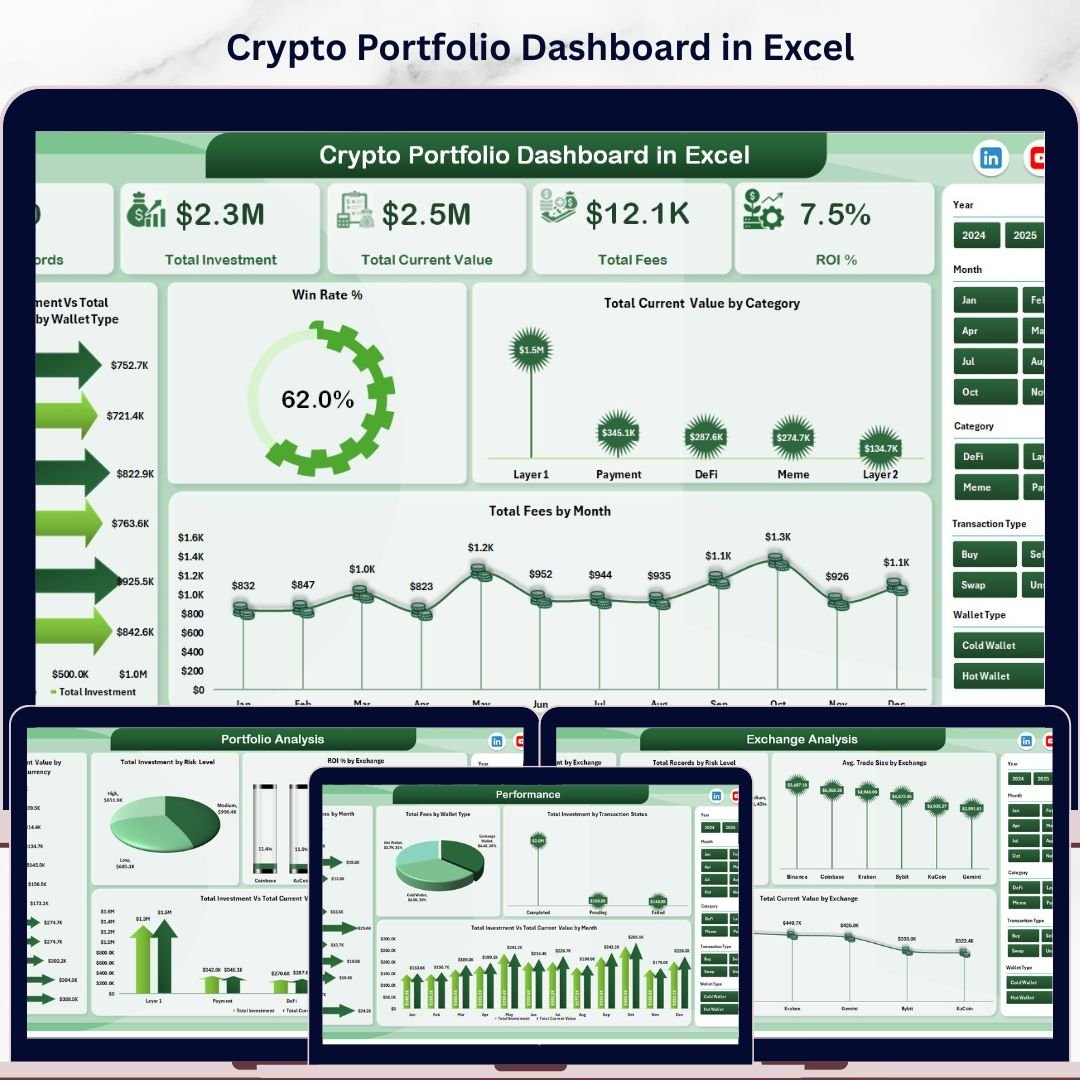

Crypto Portfolio Dashboard in Excel is a professionally designed cryptocurrency analytics template built for crypto investors, traders, portfolio managers, and finance enthusiasts who want to monitor Total Investment, Total Current Value, Total Fees, and ROI % from a single, powerful Excel dashboard. This template includes 5 interactive dashboard pages covering Overview, Portfolio Analysis, Performance, Exchange Analysis, and Risk Overview — making it one of the most comprehensive Excel Dashboard Templates available for crypto portfolio management.
Whether you manage a diversified crypto portfolio or track daily trading performance across multiple exchanges, this dashboard transforms raw transaction data into stunning, actionable visual insights. If you have been searching for a reliable, data-driven way to monitor portfolio performance, analyze exchange-level metrics, evaluate risk exposure, and track monthly gain/loss trends, the Crypto Portfolio Dashboard in Excel is the solution you need. Also explore our Small Business CFO Dashboard in Excel for comprehensive financial tracking.
🔑 Key Features of Crypto Portfolio Dashboard in Excel
This dashboard delivers everything you need to manage your cryptocurrency investments effectively. It tracks 5 key financial metrics including Total Records, Total Investment, Total Current Value, Total Fees, and ROI %. The template features 12+ professional charts across 5 dashboard pages, dynamic slicers for instant filtering, and a pivot-powered engine that auto-refreshes when data is updated. Every chart is designed to help you identify trends, compare performance, and make smarter investment decisions.
📦 What’s Inside the Crypto Portfolio Dashboard in Excel
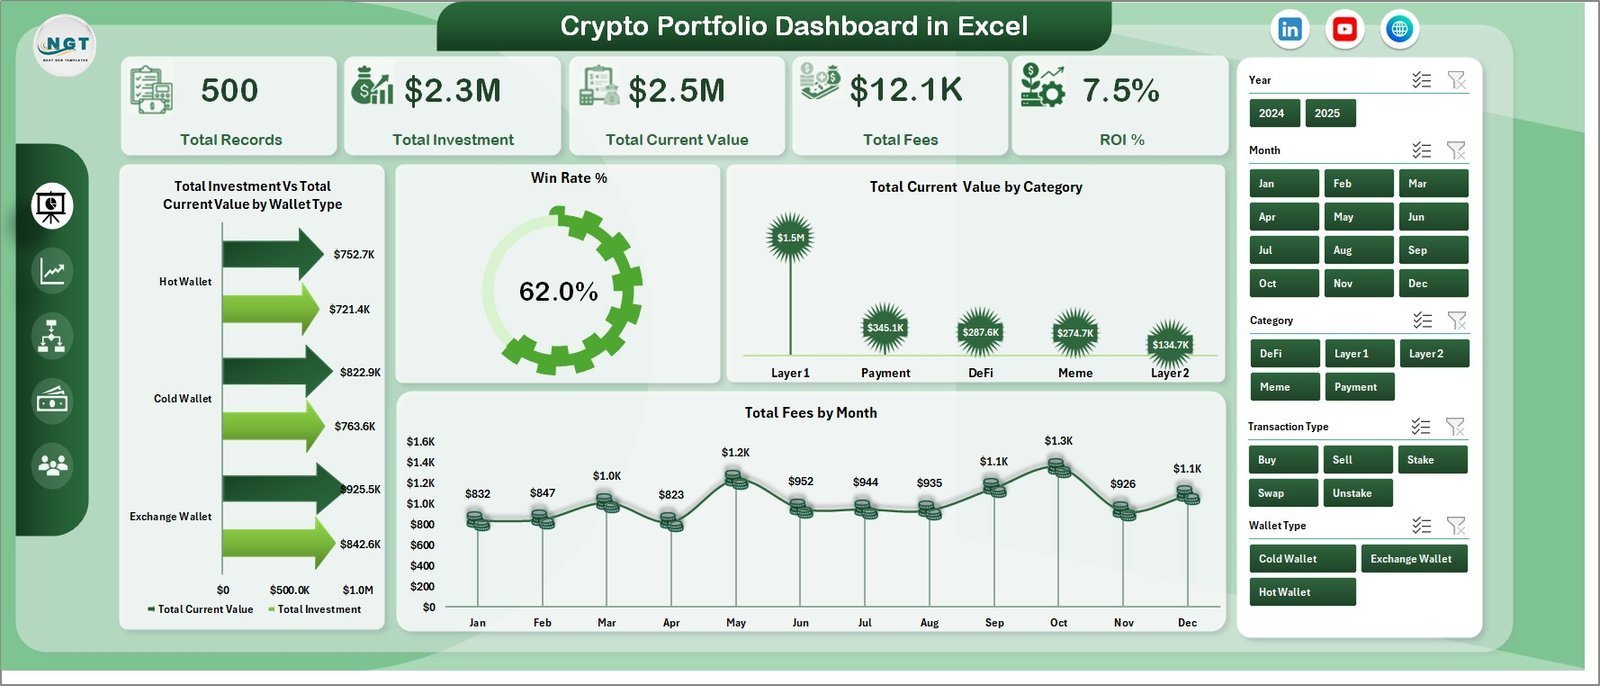
📊 Overview Page – High-level KPI cards showing Total Records, Total Investment, Total Current Value, Total Fees, and ROI %. Charts include Total Investment Vs Total Current Value by Wallet Type, Win Rate %, Total Current Value by Category, and Total Fees by Month. Dynamic slicers let you filter the entire dashboard instantly.
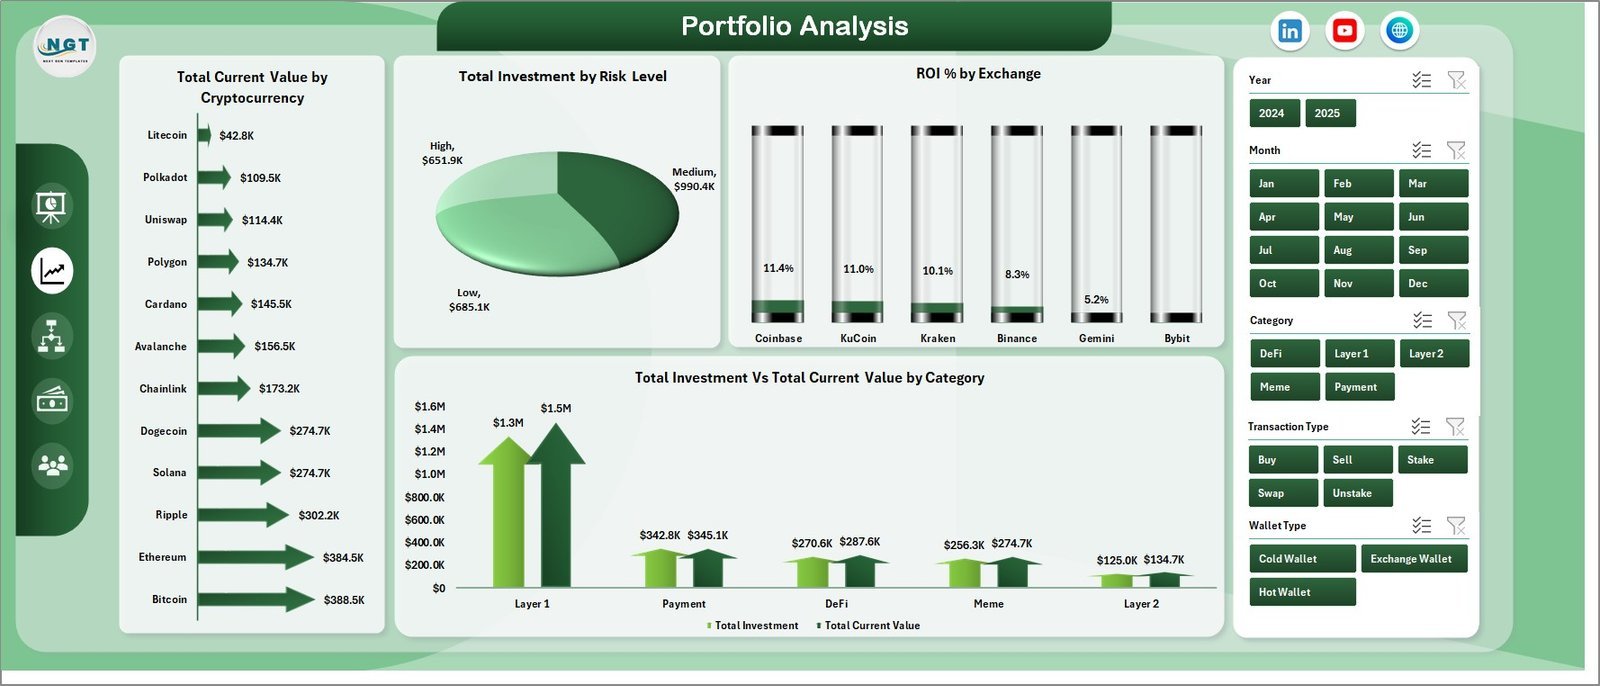
📊 Portfolio Analysis Page – Deep-dive analysis featuring Total Current Value by Cryptocurrency, Total Investment by Risk Level, ROI % by Exchange, and Total Investment Vs Total Current Value by Category.
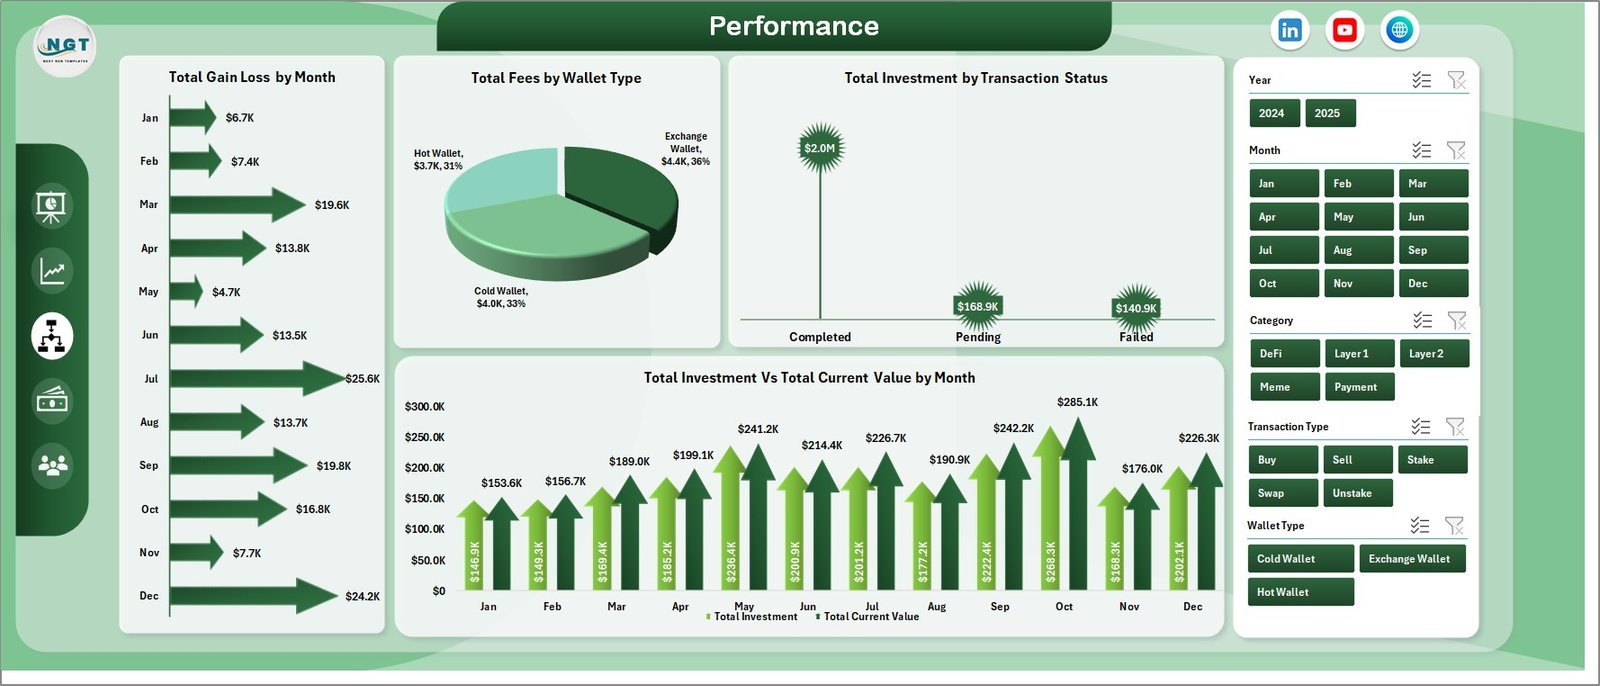
📊 Performance Page – Monthly trends with Total Gain/Loss by Month, Total Fees by Wallet Type, Total Investment by Transaction Status, and Total Investment Vs Total Current Value by Month.
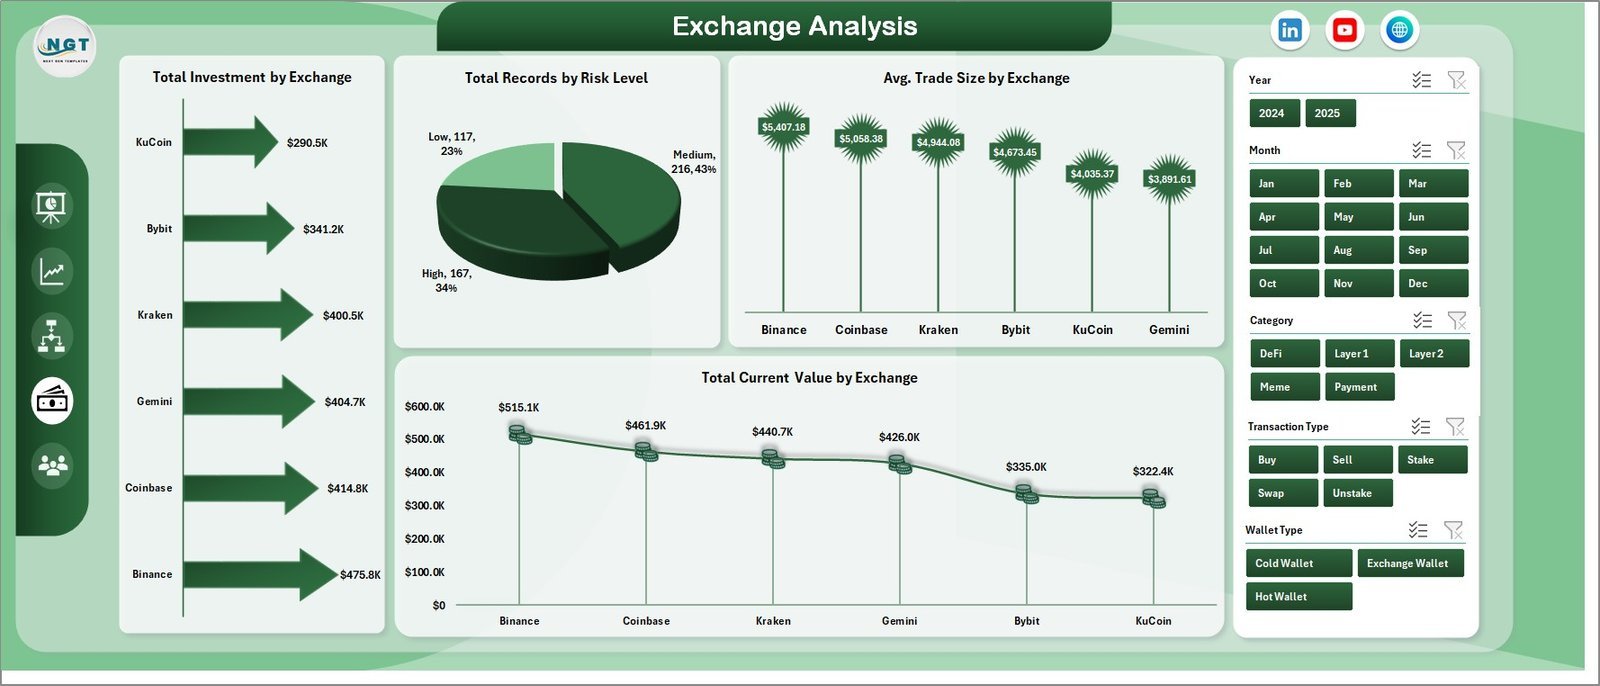
📊 Exchange Analysis Page – Exchange-level breakdown with Total Investment by Exchange, Total Records by Risk Level, Avg. Trade Size by Exchange, and Total Current Value by Exchange.
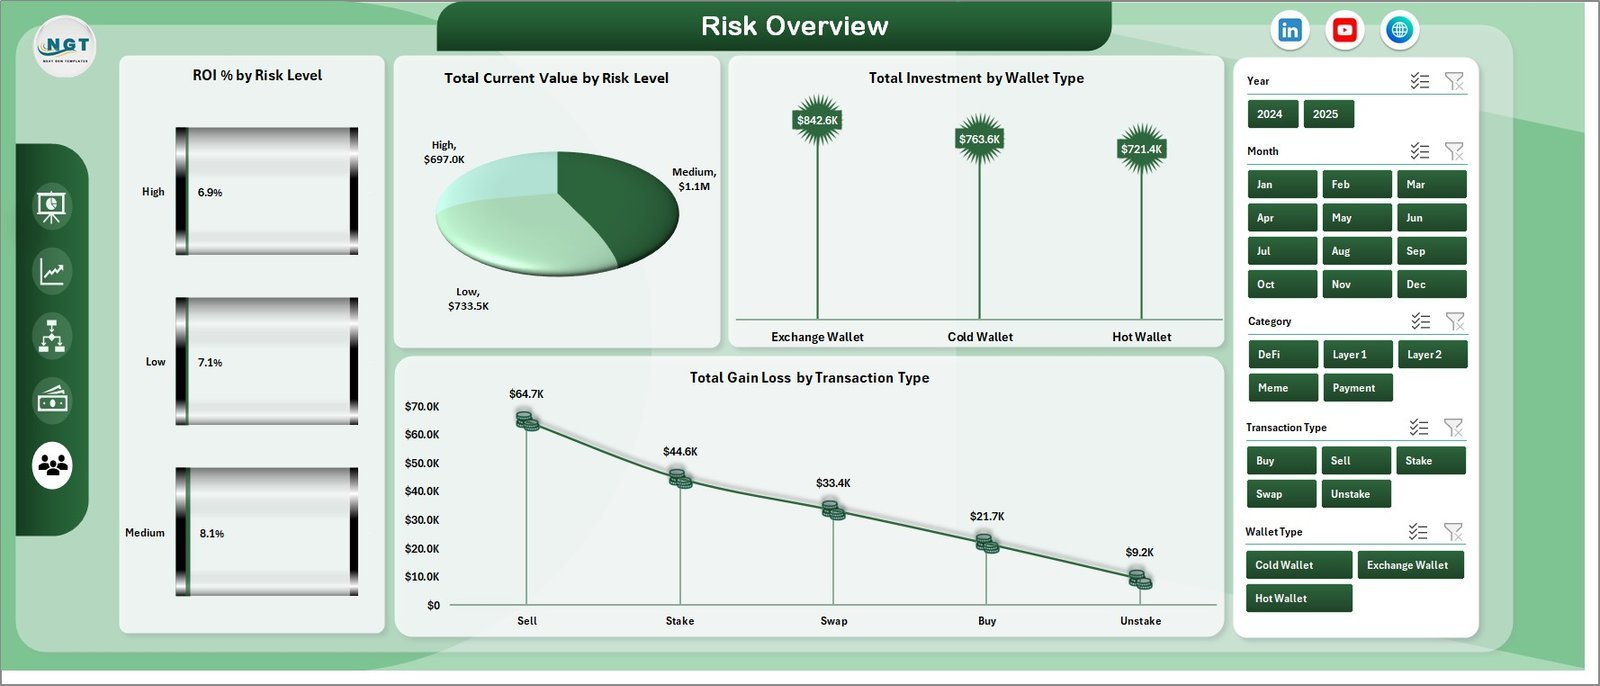
📊 Risk Overview Page – Risk assessment featuring ROI % by Risk Level, Total Current Value by Risk Level, Total Investment by Wallet Type, and Total Gain/Loss by Transaction Type.
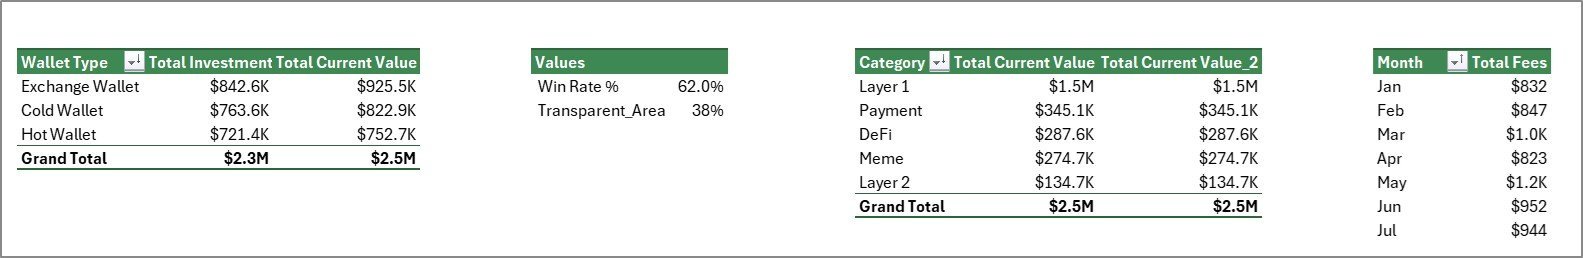
📊 Data Sheet – Enter your crypto transaction data here in the provided format. The dashboard reads from this sheet.
📊 Support Sheet – Contains all pivot tables that power the dashboard. Refresh data from the Excel Ribbon after updating the Data Sheet and all visuals update automatically.
⚙️ How to Use the Crypto Portfolio Dashboard in Excel
1️⃣ Open the downloaded Excel file in Microsoft Excel (desktop version recommended)
2️⃣ Navigate to the Data Sheet tab and replace sample data with your crypto transactions
3️⃣ Go to the Data tab in Excel Ribbon and click Refresh All to update all pivot tables
4️⃣ Explore each dashboard page using the sheet tabs at the bottom
5️⃣ Use slicers on the Overview page to filter data by Wallet Type, Exchange, Category, and more
6️⃣ Keep the Support Sheet hidden — it powers all the charts automatically
👥 Who Can Benefit from This Crypto Portfolio Dashboard in Excel
🎯 Cryptocurrency investors tracking multiple coins and tokens across exchanges
🎯 Day traders and swing traders monitoring win rate and ROI performance
🎯 Portfolio managers overseeing crypto fund allocations and risk exposure
🎯 Finance students and analysts studying cryptocurrency market trends
🎯 Anyone who wants a professional, ready-to-use Excel dashboard for crypto tracking
❓ Frequently Asked Questions
What KPIs does the Crypto Portfolio Dashboard in Excel track?
The Crypto Portfolio Dashboard in Excel tracks 5 key performance indicators including Total Records, Total Investment, Total Current Value, Total Fees, and ROI %. It also calculates Win Rate % and provides Gain/Loss analysis by month, exchange, and risk level across 5 interactive dashboard pages.
Do I need advanced Excel skills to use this crypto dashboard?
No. Simply replace the sample data in the Data Sheet with your own crypto transaction data and click Refresh All in the Data tab. All pivot tables, charts, and KPI cards update automatically without any manual formula work.
Can I track multiple cryptocurrencies and exchanges in this template?
Yes. The dashboard supports tracking unlimited cryptocurrencies across multiple exchanges and wallet types. The Exchange Analysis page provides dedicated charts for comparing performance across different trading platforms.
How do I filter the dashboard by specific criteria?
The Overview page includes dynamic slicers that allow you to instantly filter the entire dashboard by Wallet Type, Exchange, Category, Risk Level, and other dimensions. Simply click on any slicer value to see filtered results across all charts.
Is this template compatible with Google Sheets or Mac Excel?
This template is optimized for Microsoft Excel desktop version (Windows). Some features like slicers and pivot charts may not work fully in Google Sheets or Excel Online. For the best experience, use Excel 2016 or later on Windows.
🔗 Explore Related Templates
📌 Net Worth Tracker in Excel – Track your complete financial net worth including assets and liabilities
📌 Personal Finance KPI Scorecard in Excel – Monitor savings, expenses, and financial goals with KPI scorecards
📌 Debt Management KPI Scorecard in Excel – Track and manage debt repayment progress with visual KPIs
📖 Click here to read the Detailed Blog Post
🎥 Visit our YouTube channel to learn step-by-step video tutorials
👉 YouTube.com/@NextGenTemplates
Watch the step-by-step video tutorial:
YouTube


Reviews
There are no reviews yet.