


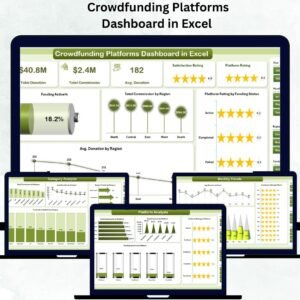
Managing multiple crowdfunding campaigns across regions, platforms, and categories can be challenging without proper visibility. The Crowdfunding Platforms Dashboard in Excel provides a smart, ready-to-use solution to monitor every aspect of crowdfunding performance — from donations and commissions to ratings and success rates — all in one analytical file.
Built entirely in Microsoft Excel, this interactive dashboard transforms raw campaign data into dynamic visuals and actionable insights. Whether you’re running a fundraising platform, analyzing donor behavior, or tracking campaign performance, this tool helps you manage it all effortlessly.
⚙️ Key Features of the Crowdfunding Platforms Dashboard in Excel
📊 Five Analytical Pages – Overview, Platform Analysis, Category Analysis, Campaign Type Analysis, and Monthly Trends.
📅 Interactive Filters – Switch between months, regions, and platforms for instant insights.
🎯 KPI Cards & Metrics – View key stats like total campaigns, total funding, average donations, and satisfaction ratings.
📈 Dynamic Charts – Visualize donations, commissions, completion rates, and ratings in one click.
📘 Support & Data Sheets – Keep reference lists and raw data organized for seamless updates.
💡 Fully Automated Design – All visuals refresh automatically when new data is added.
🧩 Customizable Dashboard – Add KPIs, charts, or new categories anytime.
💻 No Coding Required – 100% Excel-based and easy for beginners.
📤 Export-Ready Reports – Perfect for management summaries or investor presentations.
📂 What’s Inside the Crowdfunding Platforms Dashboard
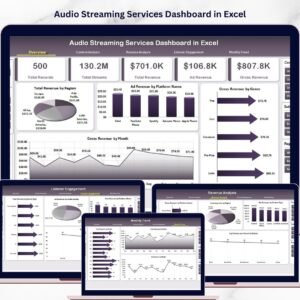
🏠 1️⃣ Overview Page – The Command Center

This page gives you a complete view of your crowdfunding landscape.
-
Left-side Page Navigator for quick movement between sections.
-
Right-side slicers to filter by month, region, or platform.
-
Five KPI cards summarizing:
-
Total Campaigns
-
Total Funding Raised
-
Average Donation Amount
-
Platform Rating
-
Funding Active %
-
Key Charts:
-
Funding Active %
-
Total Commission by Region
-
Platform Rating by Funding Status
-
Average Donation by Region
It’s the perfect one-page summary of your fundraising performance.
💼 2️⃣ Platform Analysis – Compare Platform Performance
Evaluate which crowdfunding platforms drive the best results.
-
Filter by platform, region, or period.
-
Analyze revenue, donations, and satisfaction side by side.
Visuals Include:
✅ Total Commission by Platform
✅ Total Donation by Platform
✅ Funding Active % by Platform
✅ Platform Rating by Platform
Use it to identify your top-performing platforms and plan marketing resources effectively.
🧠 3️⃣ Category Analysis – Measure by Project Type
See which types of campaigns attract the most donors.
-
Total Commission by Category
-
Average Donation by Category
-
Funding Completed % by Category
-
Support Tickets by Category
💡 Example: Education projects might reach 95% completion rates, while Tech Startups lag behind — perfect for refining focus areas.
🏷️ 4️⃣ Campaign Type Analysis – Understand Fundraising Models
Compare donation-based, reward-based, and equity-based campaigns.
Charts include:
-
Total Donations by Campaign Type
-
Funding Completed % by Type
-
Average Donation by Type
-
Platform Rating by Type
Find out which model performs best for your audience.
📅 5️⃣ Monthly Trends – Discover Growth Patterns
Track your long-term fundraising success.
Visuals include:
-
Average Donation by Month
-
Satisfaction Rating by Month
-
Funding Completed % by Month
✅ Identify high-performing months
✅ Track donor engagement trends
✅ Forecast future campaign results
⚙️ Support Sheet & Data Sheet
The Support Sheet stores lists of campaign types, regions, and platforms — ensuring dropdowns and slicers work correctly.
The Data Sheet holds all raw campaign data — including donation values, commissions, and ratings. Simply update it to refresh every chart automatically.
🌟 Advantages of Using the Crowdfunding Platforms Dashboard
✅ Comprehensive Performance View – Monitor campaigns, platforms, and categories in one place.
✅ Instant Visual Insights – Spot trends and patterns in seconds.
✅ Improved Decision-Making – Data-driven results for better strategy.
✅ Time Savings – Automates calculations and charts.
✅ Error Reduction – Built-in formulas ensure accuracy.
✅ Customizable Framework – Adapt it to your organization’s KPIs.
✅ Professional Design – Ideal for reports, presentations, and board reviews.
💡 Who Can Benefit from This Dashboard
💼 Platform Owners – Track funding, commissions, and campaign success.
📈 Marketing Teams – Analyze donor patterns and optimize outreach.
🧮 Analysts & Investors – Evaluate profitability and ROI.
🌍 Nonprofits & NGOs – Monitor fundraising impact across regions.
🚀 Startups – Manage multiple crowdfunding campaigns easily.


Reviews
There are no reviews yet.