Managing global trade operations requires constant monitoring of performance, compliance, logistics efficiency, and service delivery. Businesses that provide cross-border trade services operate across multiple countries and deal with complex documentation, customs regulations, financial transactions, and operational coordination. Without proper analytics tools, tracking this performance becomes extremely difficult.
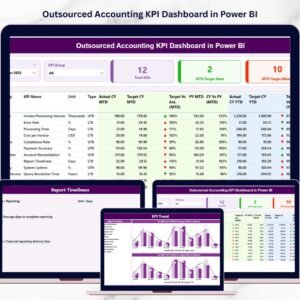
The Cross-border Trade Services KPI Dashboard in Power BI is a powerful, ready-to-use business intelligence solution designed to help organizations track, analyze, and visualize trade performance metrics in one centralized platform.
Instead of relying on scattered spreadsheets and manual reports, this dashboard converts raw KPI data into interactive visual insights that decision-makers can understand instantly. With features such as KPI cards, trend charts, slicers, and drill-through analysis, managers can monitor operational performance in real time.
This dashboard enables organizations to compare Actual vs Target performance, analyze Month-to-Date (MTD) and Year-to-Date (YTD) progress, and evaluate year-over-year growth. Because the dashboard integrates with Excel data sources, updating KPI data becomes simple and efficient.
As a result, companies involved in cross-border trade services can improve operational transparency, identify performance gaps quickly, and make better strategic decisions.
Key Feature of Cross-border Trade Services KPI Dashboard in Power BI 📊
The Cross-border Trade Services KPI Dashboard in Power BI includes advanced features designed to simplify performance monitoring and improve decision-making.
📈 Interactive KPI Monitoring Dashboard
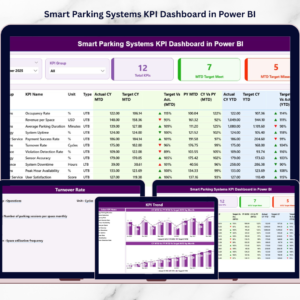
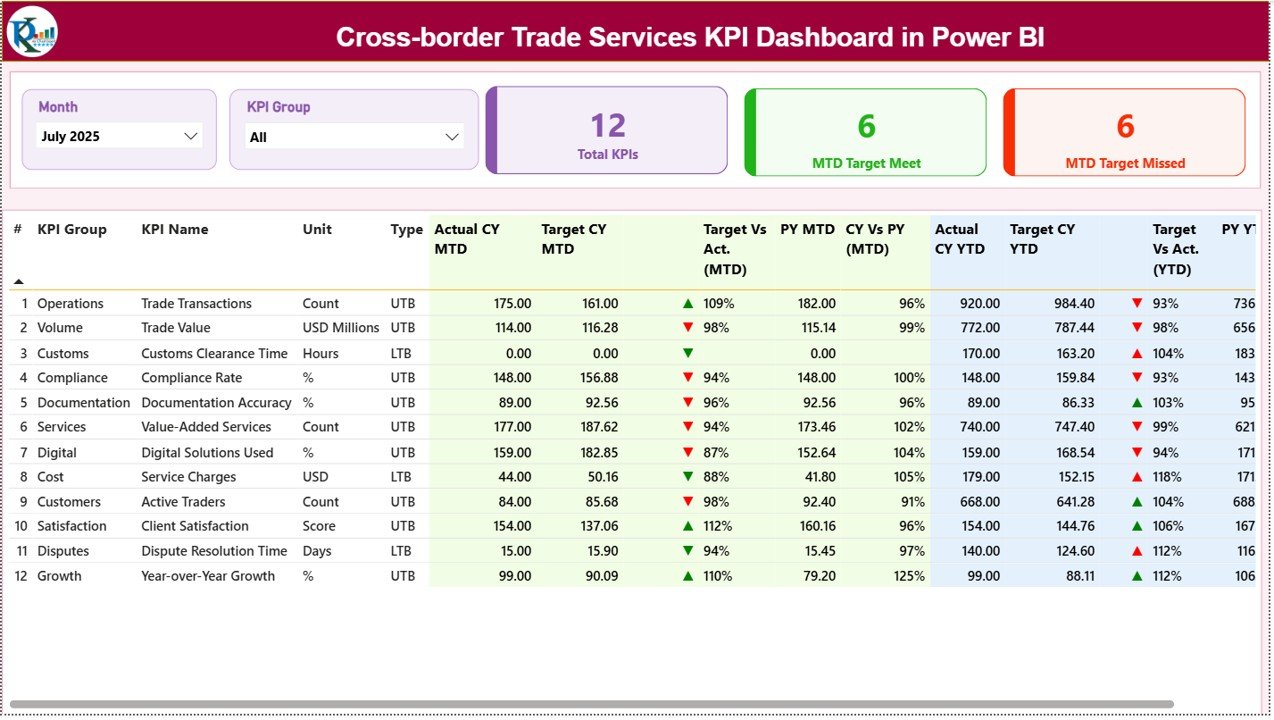
The Summary Page provides a centralized view of all KPIs, allowing managers to monitor operational performance instantly.
🎯 Dynamic KPI Slicers
Users can filter the dashboard by Month and KPI Group, making it easy to analyze performance for specific periods or departments.
📊 Performance KPI Cards
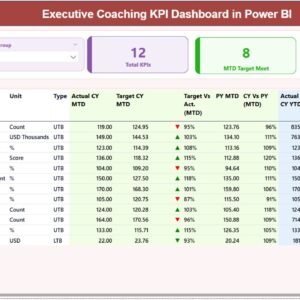
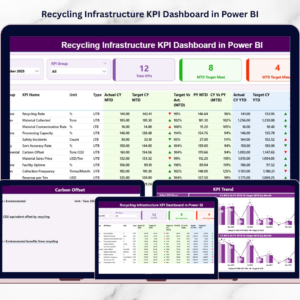
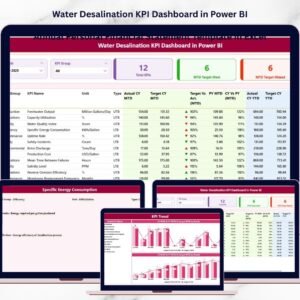
The dashboard displays key summary indicators such as Total KPIs, Target Achieved KPIs, and Target Missed KPIs.
📉 MTD and YTD Performance Tracking
The dashboard monitors Month-To-Date (MTD) and Year-To-Date (YTD) KPI performance to evaluate short-term and long-term progress.
🔍 Actual vs Target Analysis
Users can compare actual KPI performance with target values to determine whether goals are achieved.
📅 Year-over-Year Performance Comparison
Managers can evaluate performance trends by comparing Current Year results with Previous Year performance.
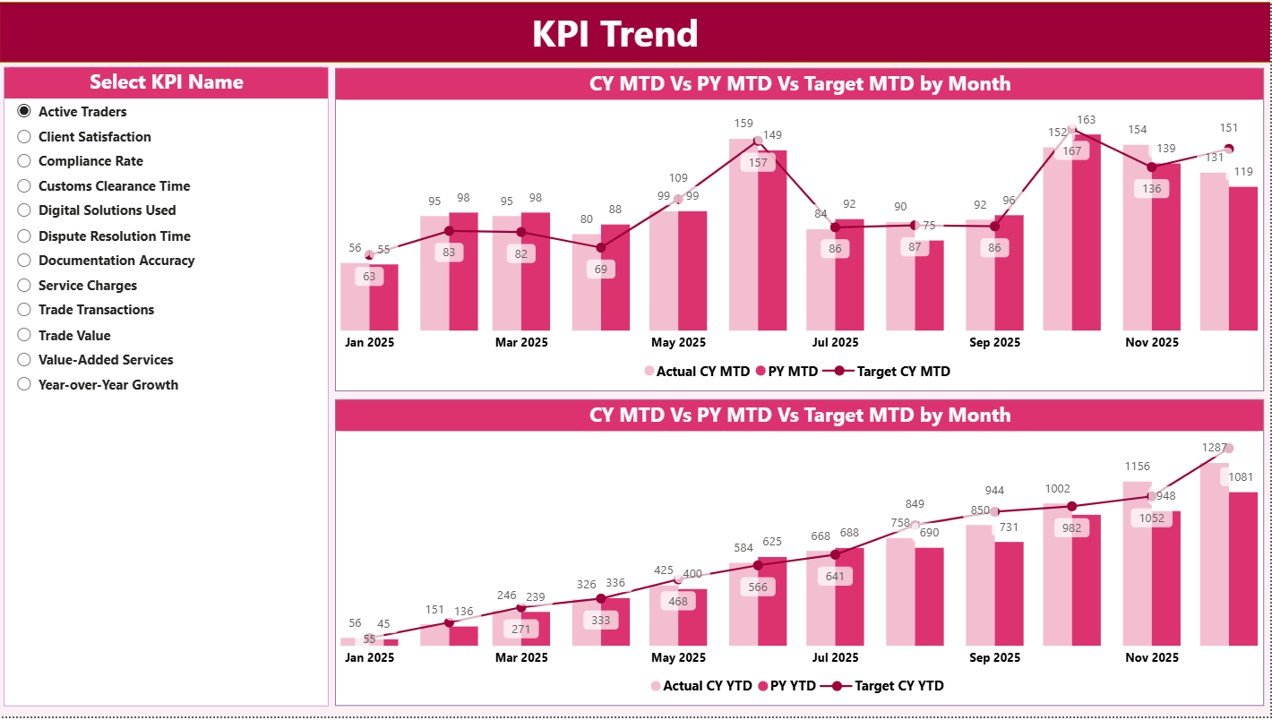
📊 KPI Trend Visualization
Interactive combo charts show KPI performance trends over time.
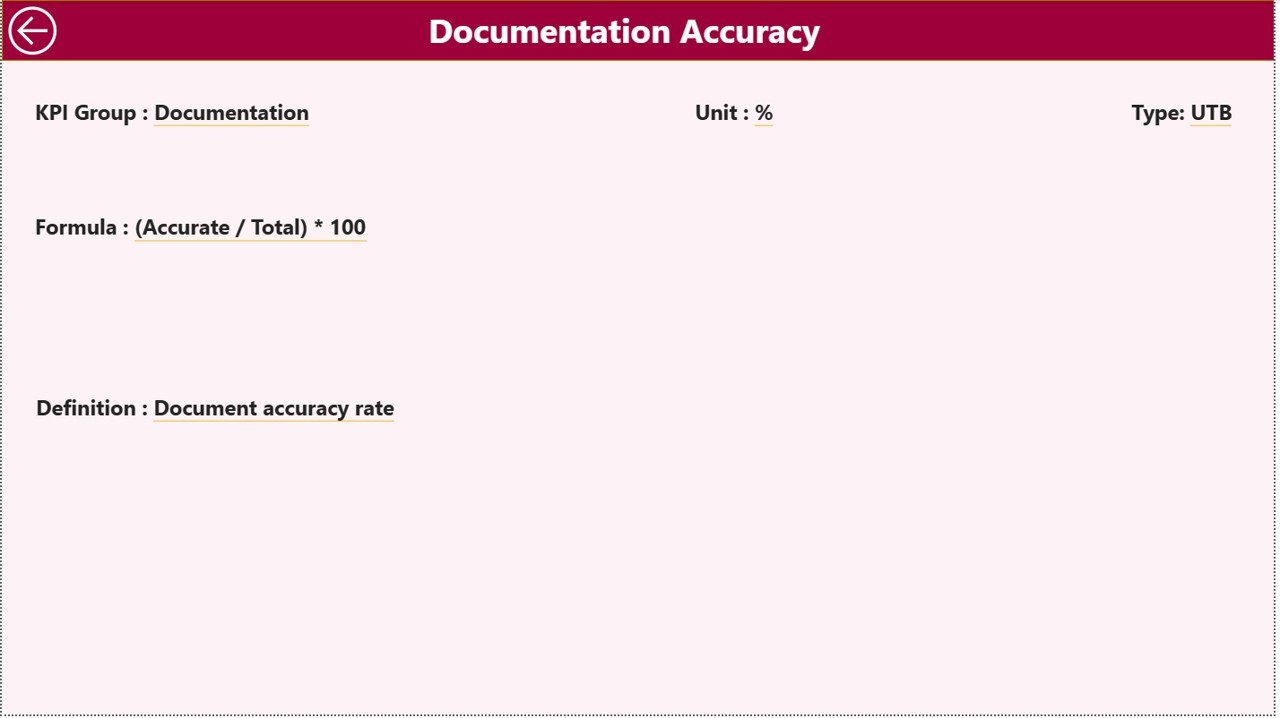
📘 Drill-through KPI Definition Page
Users can access detailed KPI definitions, formulas, measurement units, and KPI categories through drill-through functionality.
🔄 Excel Data Integration
The dashboard connects with Excel data sources, allowing organizations to update KPI values easily.
⚡ Automatic Data Refresh
Once Excel data is updated, Power BI automatically refreshes the dashboard visuals.
What’s Inside the Cross-border Trade Services KPI Dashboard in Power BI 📂
This Power BI solution includes three analytical pages designed to provide comprehensive KPI insights.
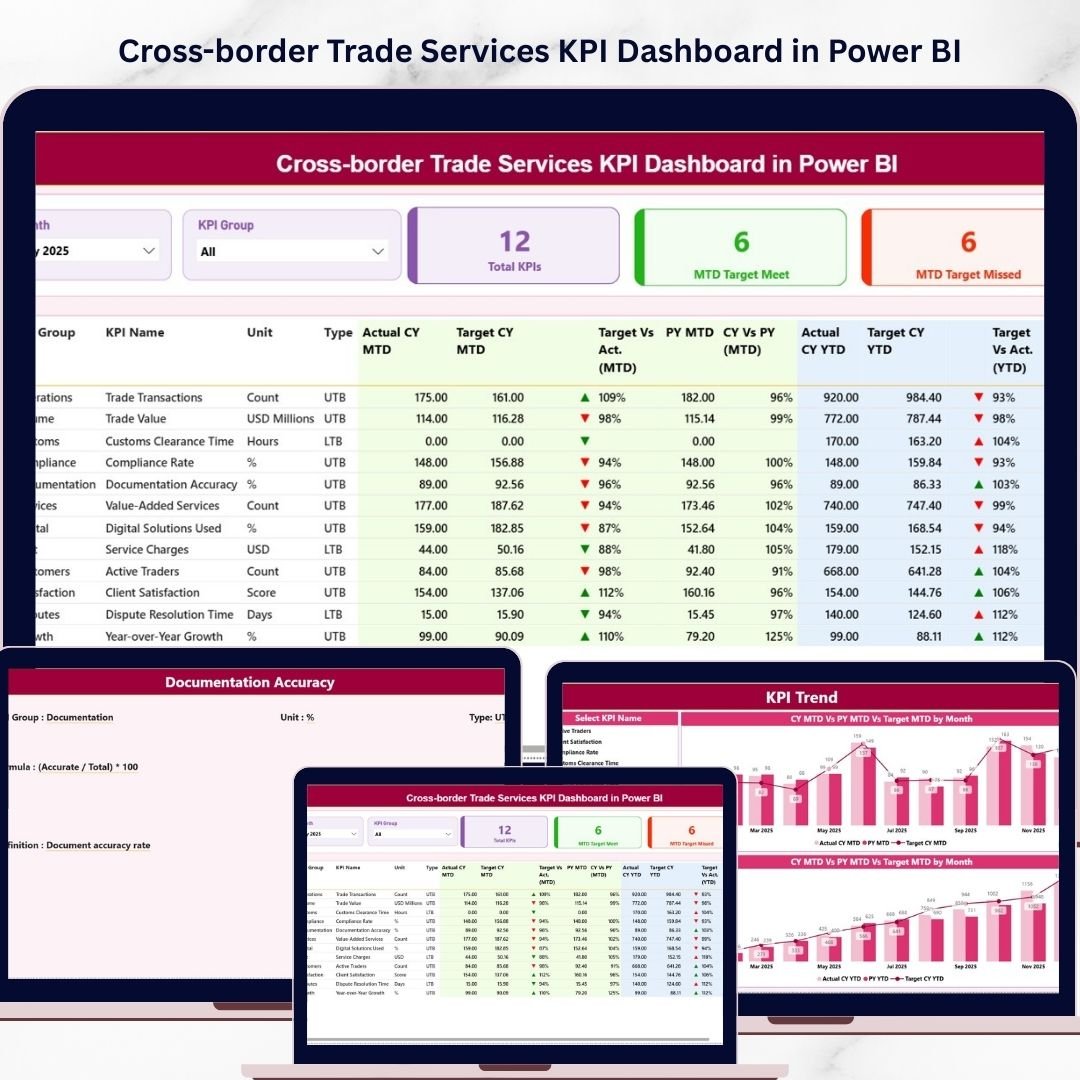
📊 Summary Dashboard Page
The main dashboard displays KPI cards, performance indicators, and a detailed KPI table showing MTD and YTD performance comparisons.
📈 KPI Trend Analysis Page
This page includes combo charts that compare Actual Values, Target Values, and Previous Year performance to analyze KPI trends over time.
📘 KPI Definition Drill-through Page
Users can access detailed KPI information including KPI formula, definition, measurement unit, and KPI type.
In addition to the Power BI file, the dashboard includes an Excel data source workbook that contains structured sheets for KPI input.
📑 Input Actual Sheet – Stores actual KPI performance data.
📑 Input Target Sheet – Contains KPI target values.
📑 KPI Definition Sheet – Defines KPI structure and measurement details.
Together, these components create a powerful and flexible KPI monitoring system.
How to Use the Cross-border Trade Services KPI Dashboard in Power BI ⚙️
Using this dashboard is simple and requires minimal setup.
1️⃣ Open the Excel data source file.
2️⃣ Enter KPI data in the Input Actual sheet.
3️⃣ Enter target values in the Input Target sheet.
4️⃣ Define KPI details in the KPI Definition sheet.
5️⃣ Refresh the Power BI dashboard to update visuals.
6️⃣ Use the Month slicer to analyze performance for a specific period.
7️⃣ Use the KPI Group slicer to evaluate departmental performance.
8️⃣ Explore KPI trends and drill-through details for deeper insights.
Because of this structured workflow, organizations can easily monitor cross-border trade performance.
Who Can Benefit from This Cross-border Trade Services KPI Dashboard in Power BI 👥
This dashboard is ideal for organizations involved in international trade operations.
🌍 International Trade Service Providers – Track service efficiency and operational performance.
🚢 Logistics and Supply Chain Companies – Monitor trade transactions, delivery performance, and operational metrics.
🏦 Financial Service Providers – Track financial KPIs related to international transactions.
📦 Import & Export Companies – Monitor global trade activities and performance indicators.
📊 Business Consultants – Analyze cross-border trade performance for clients.
🏢 Corporate Strategy Teams – Use KPI insights to support strategic planning.
Organizations that rely on cross-border operations can use this dashboard to gain better visibility into performance and improve decision-making.
Click hare to read the Detailed blog post
Visit our YouTube channel to learn step-by-step video tutorials
🔗 https://www.youtube.com/@PKAnExcelExpert