Modern financial institutions operate in an intensely competitive and data-driven environment where every transaction matters. Credit card companies process millions of payments daily while simultaneously managing approvals, monitoring customer behavior, analyzing revenue streams, and tracking regional performance. However, when organizations rely on scattered spreadsheets and manual reports, extracting meaningful insights becomes slow and inefficient.
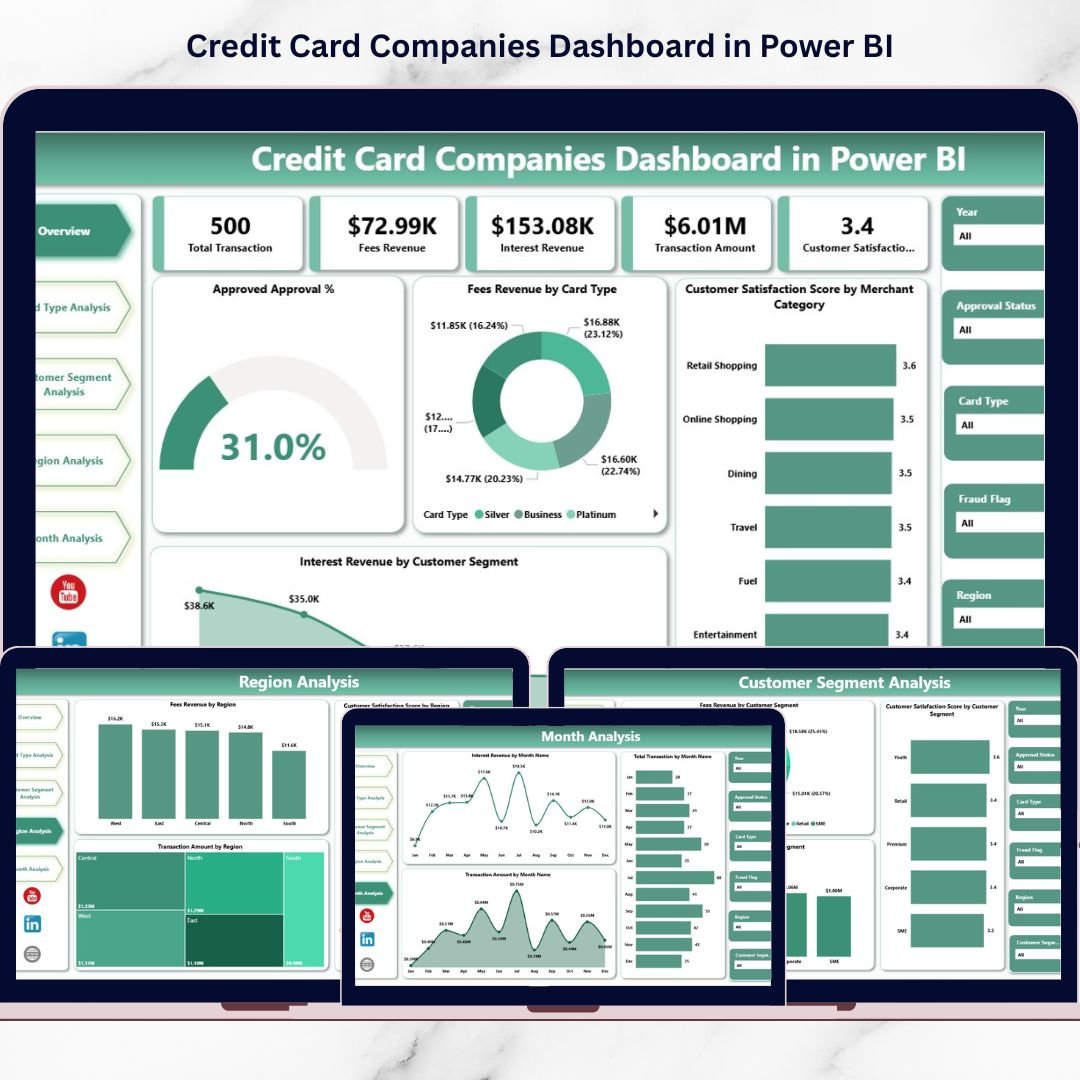
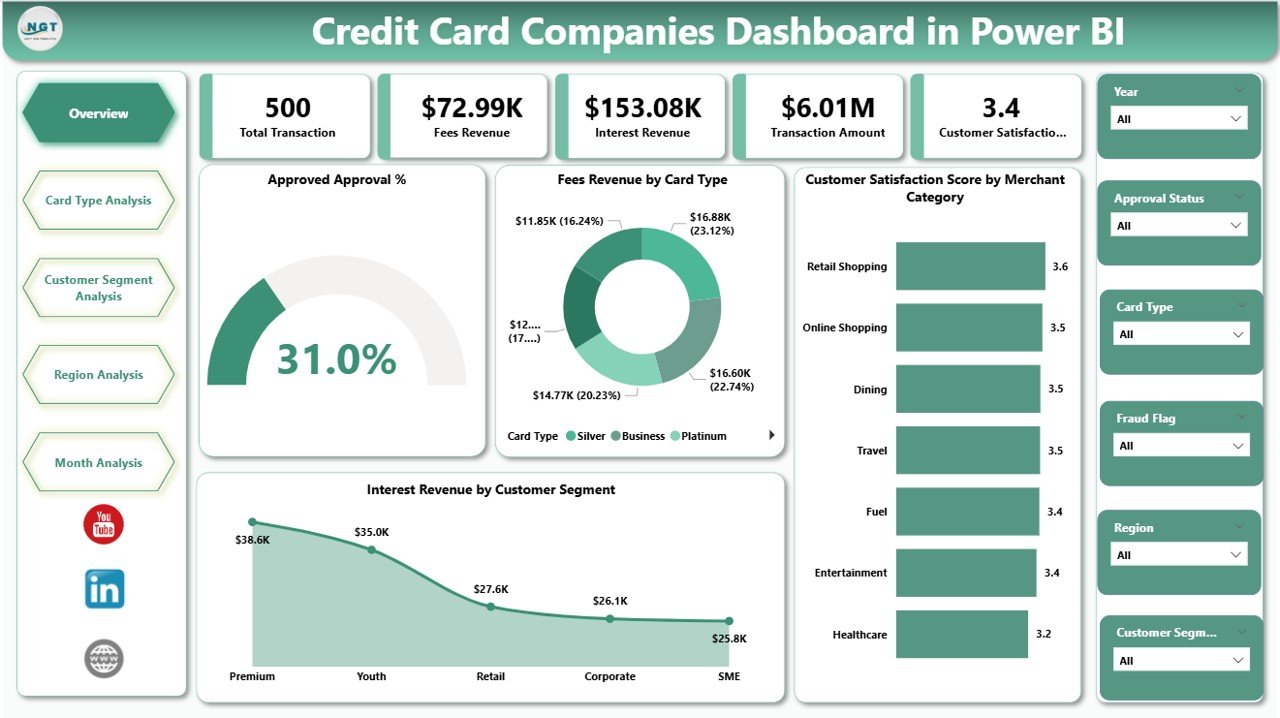
The Credit Card Companies Dashboard in Power BI is a powerful, ready-to-use analytics solution designed to transform complex financial data into clear, interactive, and actionable business intelligence. Instead of reviewing multiple reports separately, decision-makers can monitor approvals, transaction performance, fee income, interest revenue, and customer satisfaction from one centralized dashboard.
Built using Microsoft Power BI, this dashboard provides dynamic visualizations, automated calculations, and interactive filtering that allow financial teams to explore data instantly. Because Power BI automatically refreshes visuals when datasets are updated, organizations gain real-time visibility into performance trends and operational health.
Whether you are a bank executive, financial analyst, product manager, or operations leader, this dashboard helps shift reporting from manual analysis to intelligent decision-making. As a result, organizations improve profitability, enhance customer experience, and optimize business strategy using data-backed insights.
🚀 Key Feature of Credit Card Companies Dashboard in Power BI
💳 Executive Performance Overview
Monitor approval rates, revenues, and satisfaction metrics through KPI cards and visual summaries.
📊 Interactive Financial Analytics
Analyze transactions, fees, and interest income using dynamic charts.
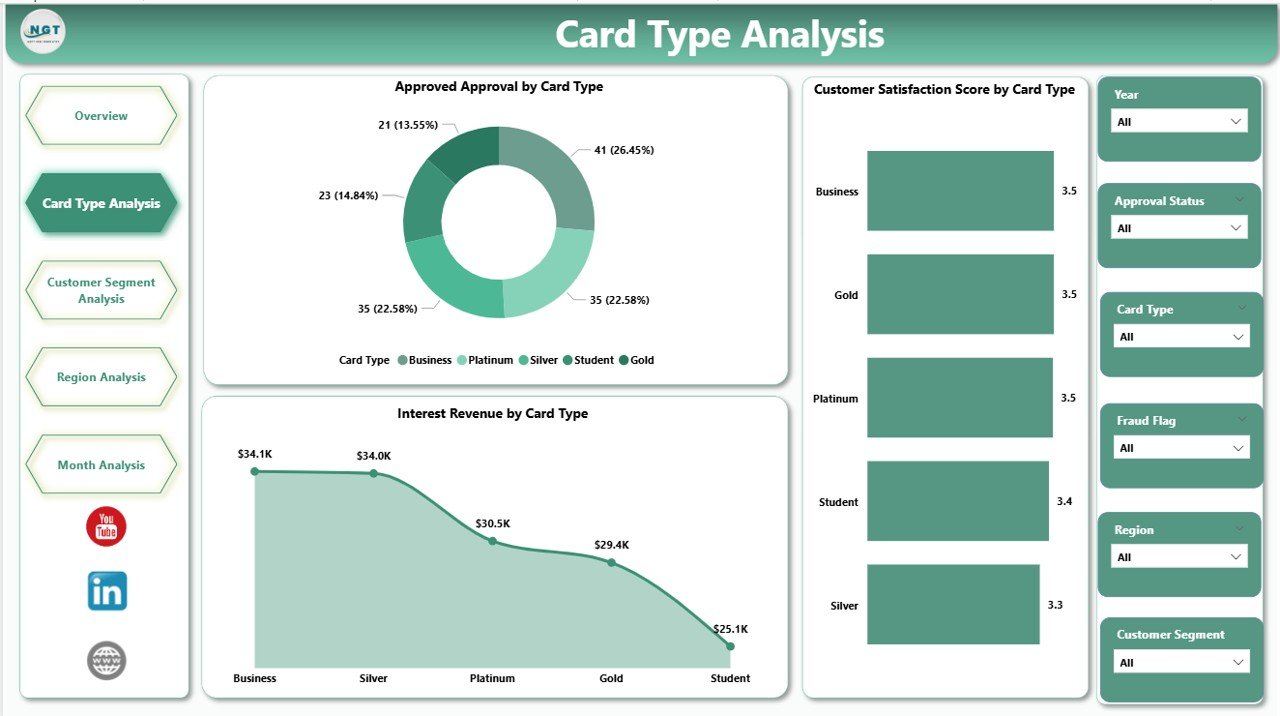
🎯 Card Type Performance Analysis
Compare profitability and performance across different credit card categories.
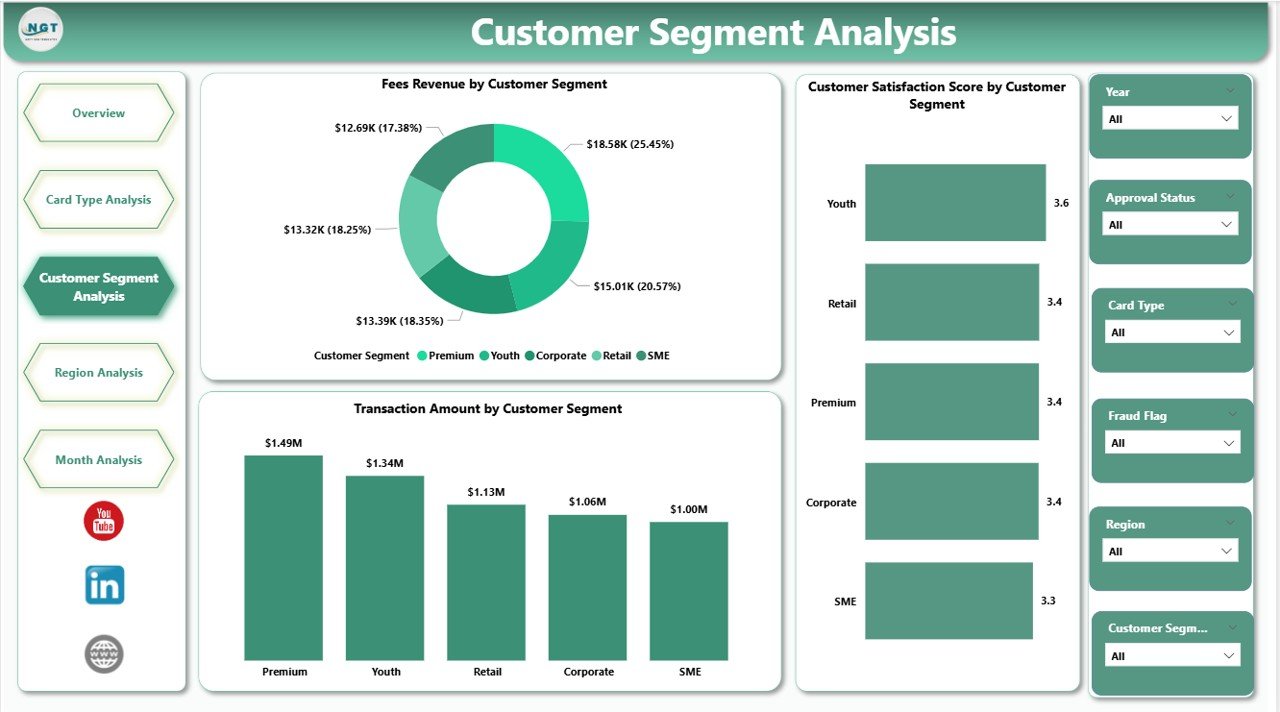
👥 Customer Segment Insights
Understand spending behavior and revenue contribution by customer groups.
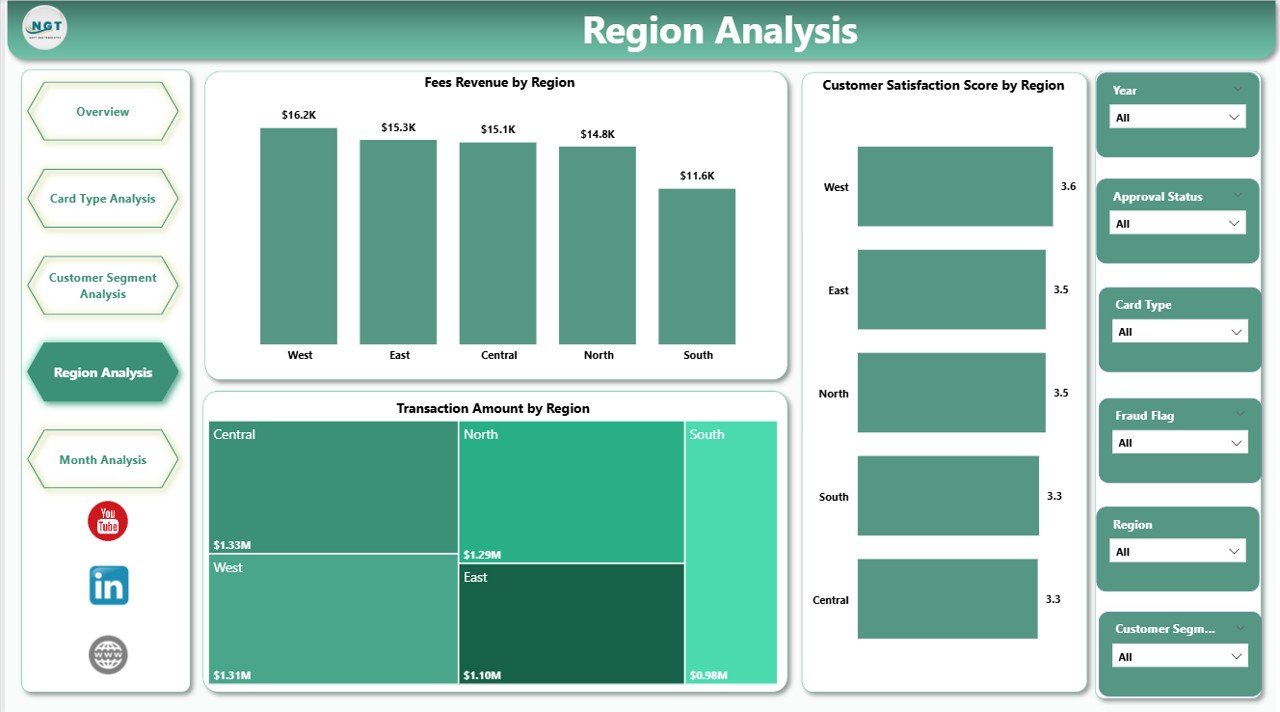
🌍 Regional Performance Monitoring
Evaluate geographic trends to optimize marketing and operational strategies.
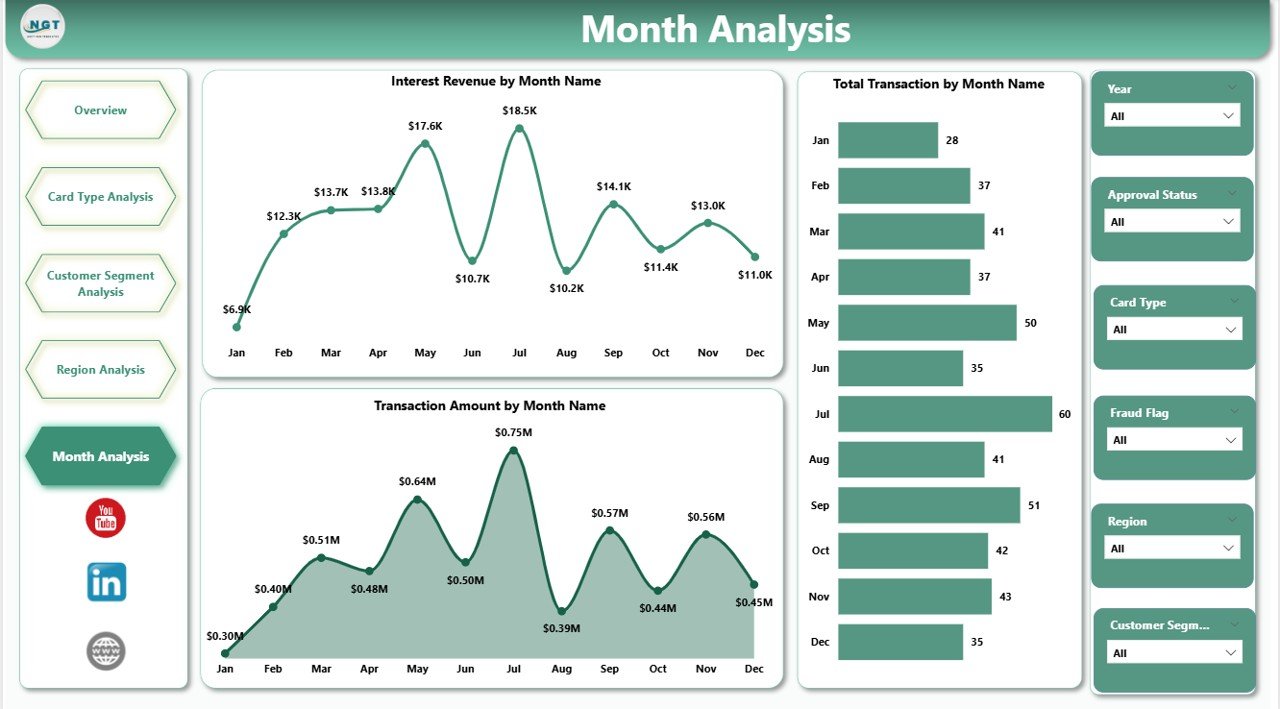
📅 Monthly Trend Analysis
Track revenue growth and transaction patterns over time.
⚡ Real-Time Dashboard Updates
Refresh data and instantly view updated analytics.
🔎 Dynamic Slicers & Drill-Down Analysis
Filter insights by card type, customer segment, or region effortlessly.
📦 What’s Inside the Credit Card Companies Dashboard in Power BI
This ready-to-use dashboard includes a complete financial analytics framework:
✅ Five Interactive Dashboard Pages
-
Overview Page
-
Card Type Analysis
-
Customer Segment Analysis
-
Region Analysis
-
Month Analysis
✅ KPI Cards for Executive Reporting
✅ Interactive Charts & Visual Analytics
✅ Professional Financial Dashboard Layout
✅ Dynamic Filters & Slicers
✅ Structured Data Model for Easy Integration
Simply connect your data source and start analyzing immediately.
🛠️ How to Use the Credit Card Companies Dashboard in Power BI
Getting started is simple and user-friendly:
1️⃣ Import transaction and customer datasets into Power BI.
2️⃣ Refresh the dashboard to update visuals automatically.
3️⃣ Use slicers to filter analysis by region, segment, or card type.
4️⃣ Navigate across analytical pages for deeper insights.
5️⃣ Review KPI cards and charts to identify trends.
6️⃣ Share dashboards securely with executives and teams.
No advanced technical skills are required to explore insights effectively.
👥 Who Can Benefit from This Credit Card Companies Dashboard in Power BI
This dashboard is ideal for professionals across financial organizations:
🏦 Banking & Credit Card Executives
📊 Financial Analysts & BI Teams
💼 Product & Strategy Managers
📈 Marketing & Customer Experience Teams
⚙️ Operations & Risk Management Teams
💰 Revenue Monitoring Departments
Organizations of all sizes can leverage this dashboard to improve analytics maturity and decision speed.
By implementing this dashboard, companies centralize reporting, reduce manual workload, enhance transparency, and uncover hidden performance opportunities. Instead of spending hours preparing reports, teams gain instant insights that support faster and smarter financial decisions.
### Click here to read the Detailed blog post
Visit our YouTube channel to learn step-by-step video tutorials:
👉 https://youtube.com/@PKAnExcelExpert


