Managing corporate training programs without clear performance insights can quickly become overwhelming. Training providers handle multiple programs, instructors, clients, sessions, and financial metrics at the same time. Without a structured monitoring system, it becomes difficult to evaluate training effectiveness, measure ROI, and track operational performance.
That is where the Corporate Training Providers KPI Dashboard in Excel becomes an incredibly powerful solution.
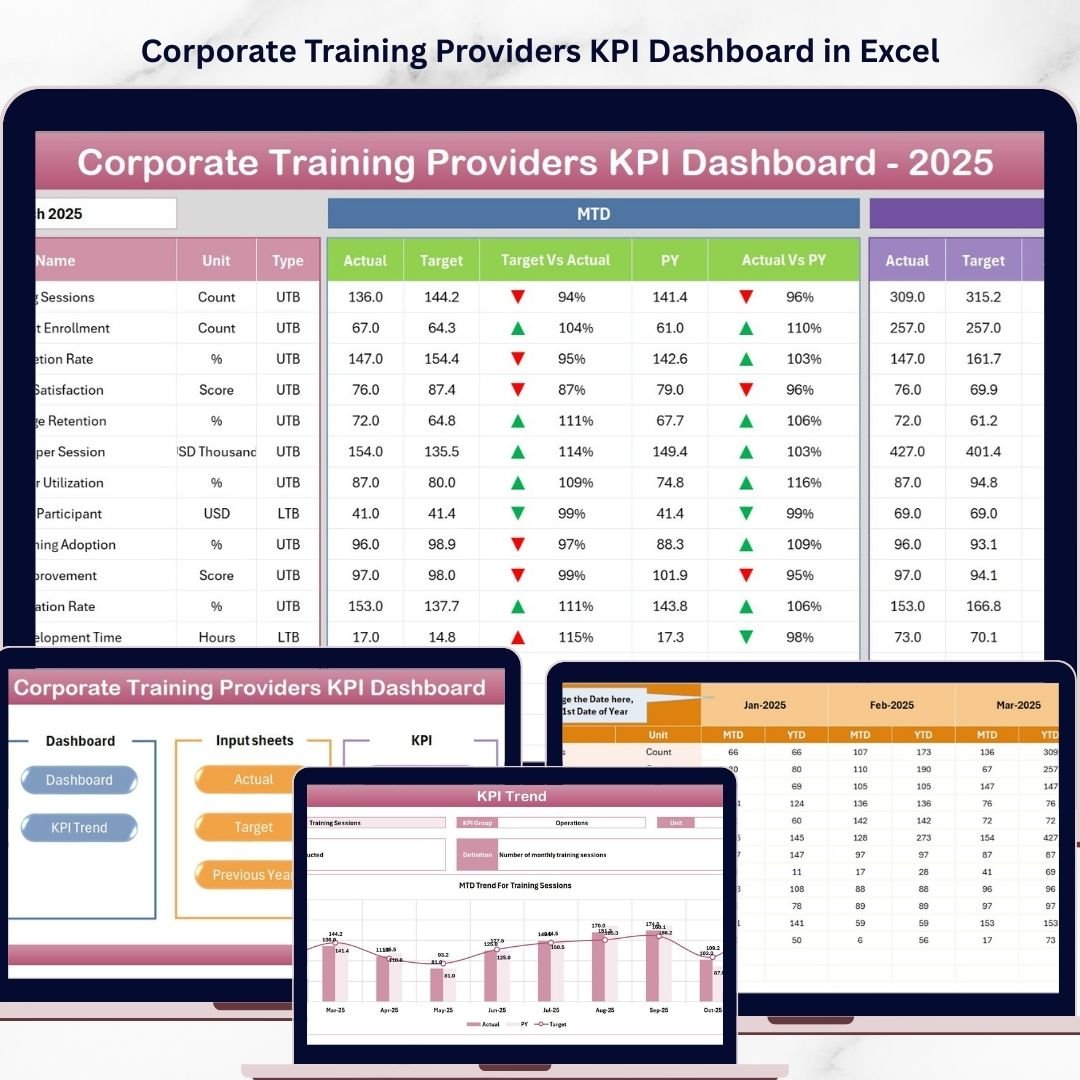
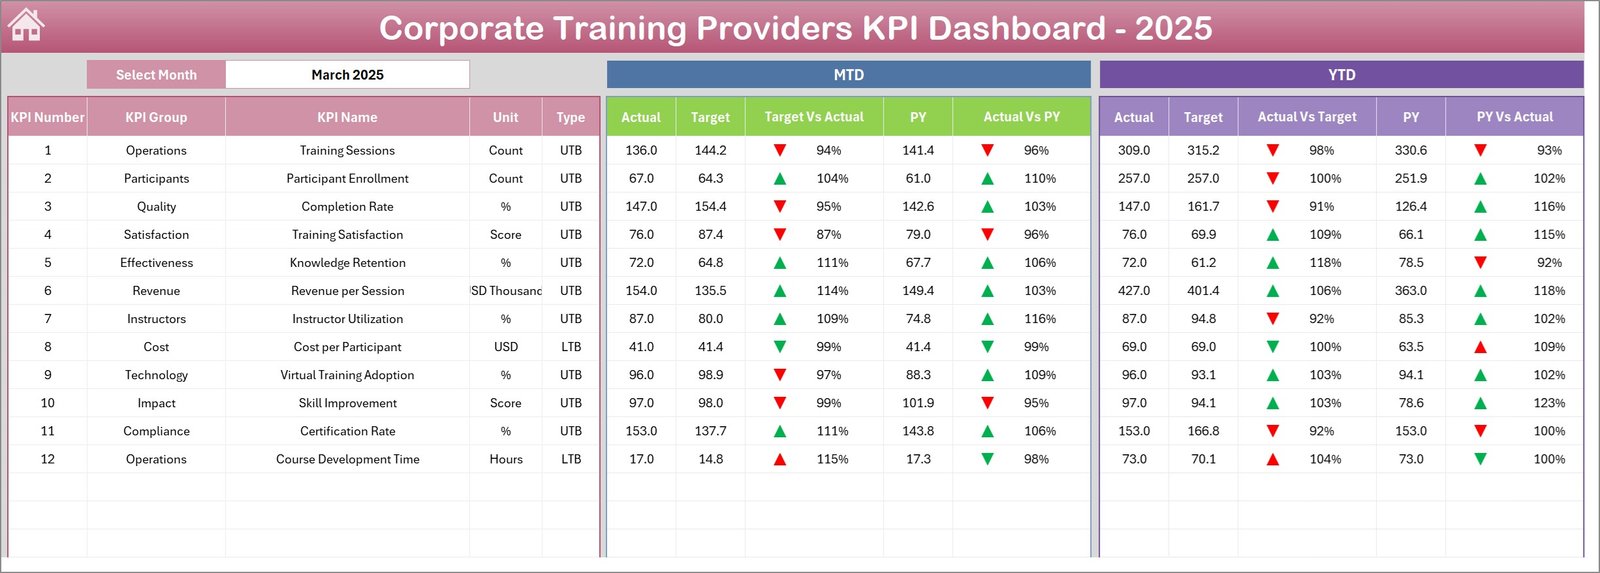
This ready-to-use Excel dashboard helps corporate training providers monitor key performance indicators, analyze training outcomes, track financial performance, and evaluate operational efficiency—all in one centralized dashboard.
Designed using Excel’s powerful analytics tools such as Pivot Tables, charts, slicers, formulas, and conditional formatting, the dashboard transforms complex training data into clear and actionable insights.
Whether you manage corporate training programs, leadership workshops, employee development initiatives, or compliance training, this dashboard helps you monitor performance and make smarter business decisions.
📊 Key Feature of Corporate Training Providers KPI Dashboard in Excel
🚀 Interactive KPI Monitoring
Track important training KPIs such as completion rate, revenue, and training performance using a visually structured dashboard.
📅 Dynamic Month Selection
Select any month using the dropdown menu and instantly update all dashboard metrics for quick performance analysis.
📈 MTD & YTD Performance Tracking
Analyze both Month-to-Date (MTD) and Year-to-Date (YTD) performance to understand short-term and long-term training outcomes.
🎯 Target vs Actual Comparison
Compare actual performance with predefined targets to quickly identify gaps and improvement areas.
📊 Previous Year Comparison
Evaluate year-over-year performance to understand growth patterns and training demand trends.
📉 Conditional Formatting Indicators
Visual arrows automatically indicate performance improvements or declines.
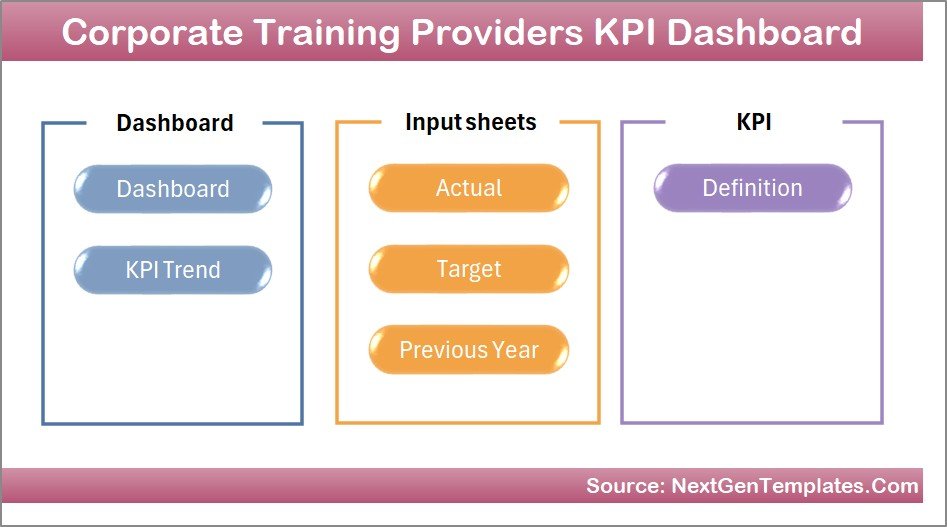
🧭 User-Friendly Navigation Page
The summary sheet acts as a central navigation hub, allowing users to jump directly to different dashboard sections.
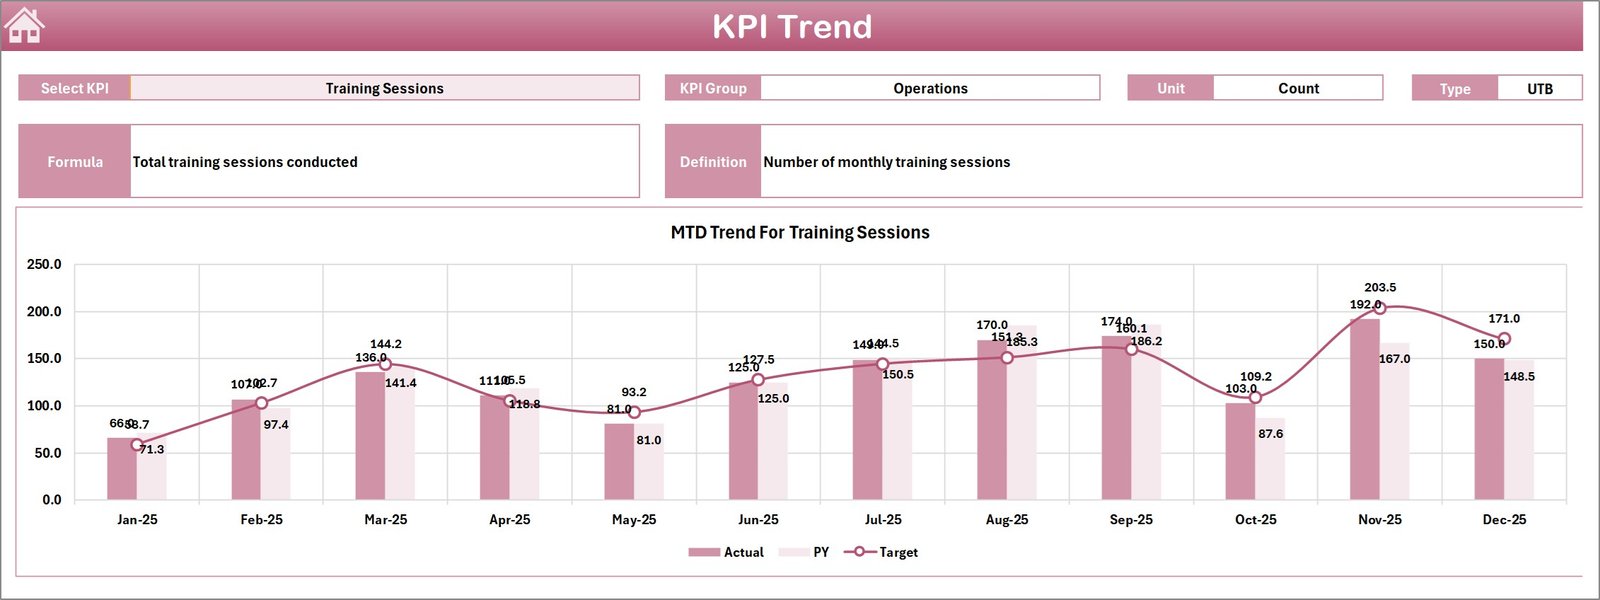
📊 KPI Trend Analysis
Track KPI performance trends over time using dynamic charts that compare Actual, Target, and Previous Year values.
⚙️ Flexible Fiscal Year Setup
Easily configure the starting month of your fiscal year to match your organization’s reporting cycle.
📂 Centralized KPI Database
Define KPI formulas, groups, definitions, and units in a dedicated KPI Definition sheet.
📁 What’s Inside the Corporate Training Providers KPI Dashboard in Excel
This dashboard includes 7 well-structured worksheets designed for complete KPI monitoring.
📑 Summary Page
A navigation index page with shortcut buttons to easily access all dashboard sections.
📊 Dashboard Sheet
The main reporting page showing all KPI performance metrics in one screen.
📈 Trend Analysis Sheet
Displays dynamic trend charts for selected KPIs with comparisons between Actual, Target, and Previous Year values.
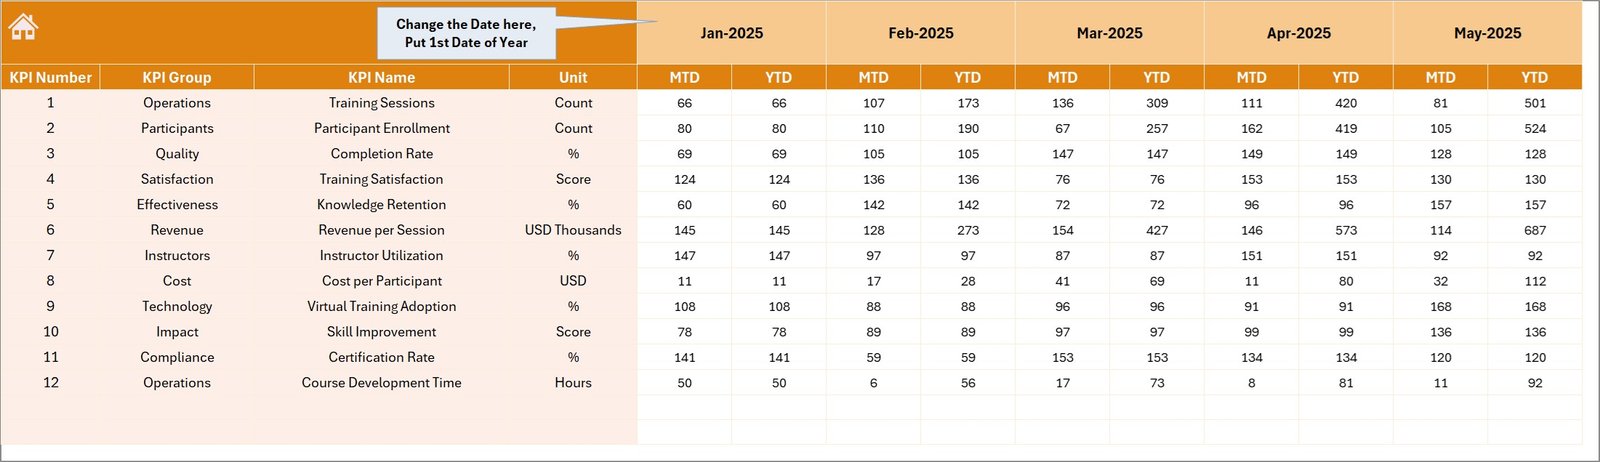
📝 Actual Numbers Input Sheet
A structured data entry sheet where users input actual KPI performance values.
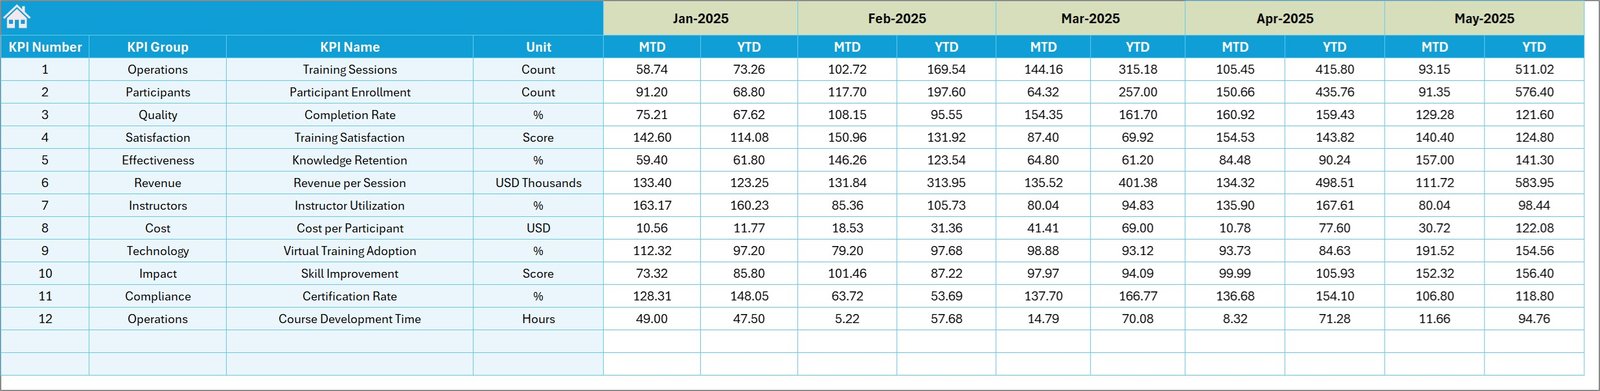
🎯 Target Sheet
Stores predefined KPI targets to compare performance against goals.
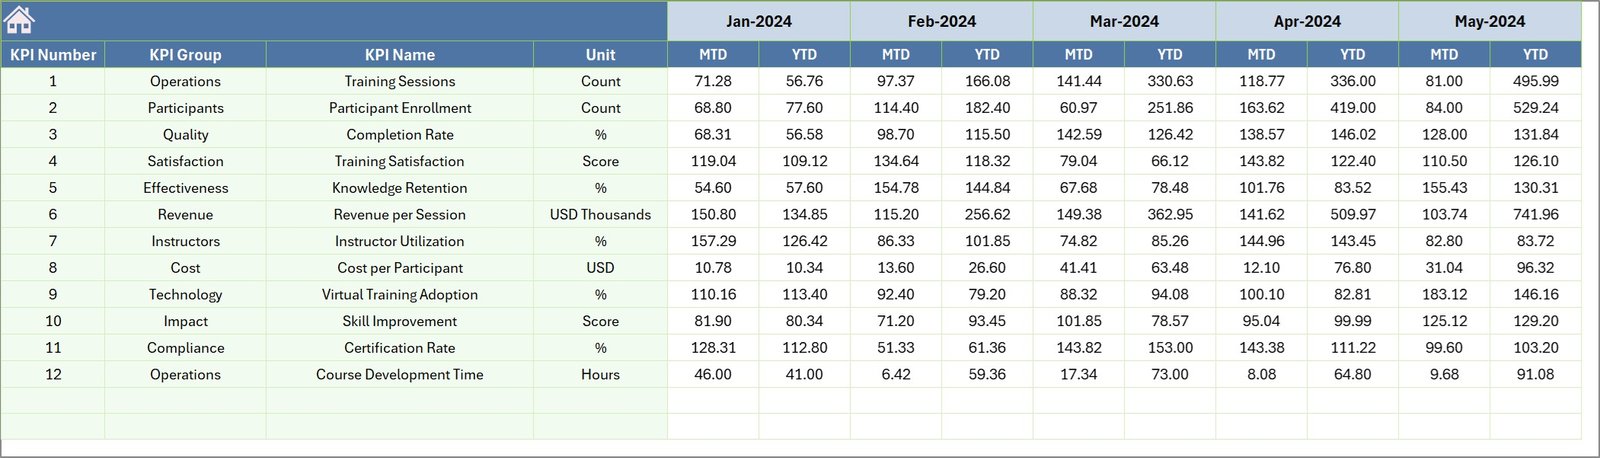
📊 Previous Year Sheet
Allows historical KPI comparisons to analyze year-over-year improvements.
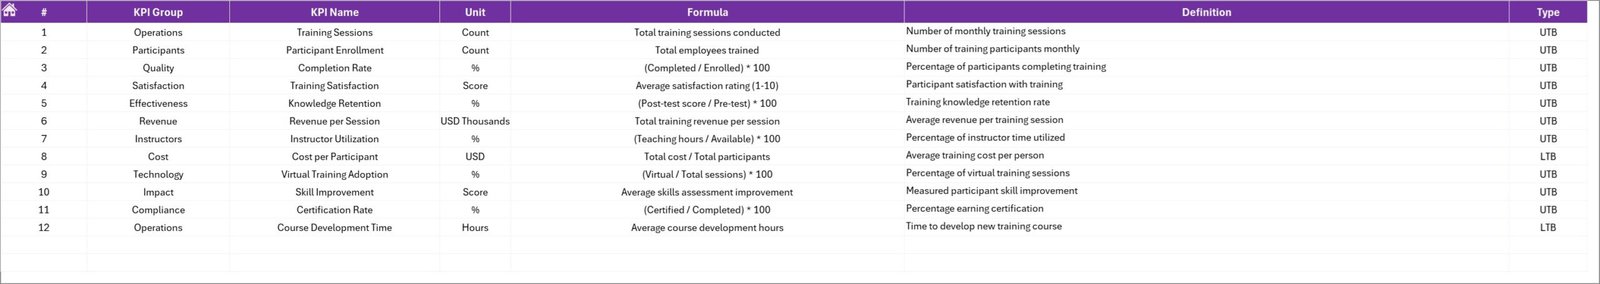
📚 KPI Definition Sheet
The central database containing KPI names, groups, formulas, units, and descriptions.
Together, these sheets provide a complete KPI performance tracking system for corporate training organizations.
⚙️ How to Use the Corporate Training Providers KPI Dashboard in Excel
Using this dashboard is simple and beginner-friendly.
1️⃣ Enter KPI Definitions
Start by defining KPI names, formulas, and categories in the KPI Definition sheet.
2️⃣ Set KPI Targets
Input monthly and yearly targets in the Target sheet.
3️⃣ Enter Actual KPI Values
Update the Actual Numbers Input sheet with current KPI performance data.
4️⃣ Add Previous Year Data
Input historical KPI numbers for year-over-year comparisons.
5️⃣ Select a Month on the Dashboard
Use the dropdown in the dashboard to filter performance metrics for any month.
6️⃣ Analyze Insights Instantly
The dashboard automatically updates charts, KPI comparisons, and performance indicators.
Within seconds, you can analyze training performance, financial results, and operational efficiency.
👥 Who Can Benefit from This Corporate Training Providers KPI Dashboard in Excel
This dashboard is ideal for professionals working in corporate training and learning development.
👨🏫 Corporate Training Providers
Track program performance and training outcomes.
👩💼 HR & Learning Development Teams
Monitor employee training initiatives and skill development programs.
📊 Training Managers
Analyze instructor performance, training completion rates, and engagement metrics.
📈 Training Consultants
Measure the impact of corporate training programs for clients.
🏢 Professional Development Organizations
Track training delivery performance and revenue growth.
📚 Educational & Training Institutions
Manage professional certification programs and learning initiatives.
Any organization delivering corporate training services can use this dashboard to improve performance tracking and strategic decision-making.
Click here to read the Detailed blog post
Watch the step-by-step video tutorial: