

Corporate training teams handle a huge volume of data every day—trainer ratings, employee feedback, cost analysis, training completion, regional performance, and more. When this information stays scattered across spreadsheets and reports, it becomes difficult to measure true training impact. That’s where the Corporate Training Dashboard in Power BI becomes your ultimate solution. It transforms complex learning and development (L&D) data into clean visuals that help companies understand performance instantly.
This dashboard gives HR teams, L&D managers, department heads, and leadership a centralized view of all training activities. It comes with five powerful pages that track training types, department performance, trainer ratings, regional outcomes, and monthly learning trends. With dynamic slicers, real-time visuals, and automated updates, this dashboard helps companies build stronger employees and smarter decisions.
Whether your organization runs soft skills training, technical workshops, leadership programs, or global L&D initiatives—this dashboard brings clarity, speed, and accuracy to your entire training strategy.
📦 What’s Inside the Corporate Training Dashboard in Power BI
This dashboard includes five analytical pages, each designed to show specific insights that help companies improve training performance.
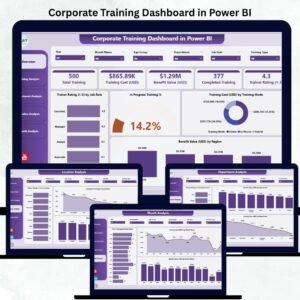
⭐ 1. Overview Page – Instant Training Summary in One Place

The Overview Page is the main hub of the dashboard. It includes slicers to filter training data by month, location, department, or training type.
KPI Cards on this page:
-
Total Training Count
-
Total In-Progress Trainings
-
Average Trainer Rating
-
Total Benefit Value (USD)
Charts displayed:
-
Trainer Rating by Job Role
-
In Progress Training %
-
Training Cost (USD) by Training Mode
-
Benefit Value (USD) by Region
This page provides a high-level understanding of training effectiveness, employee progress, and regional performance.
⭐ 2. Training Analysis Page – Understand Training Type Performance
This page focuses on how different training types perform across the company.
Charts displayed:
-
Trainer Rating by Training Type
-
Satisfaction by Training Type
-
Benefit Value (USD) by Training Type
Teams can instantly identify which training types deliver the best experiences, which need improvement, and where to invest more.
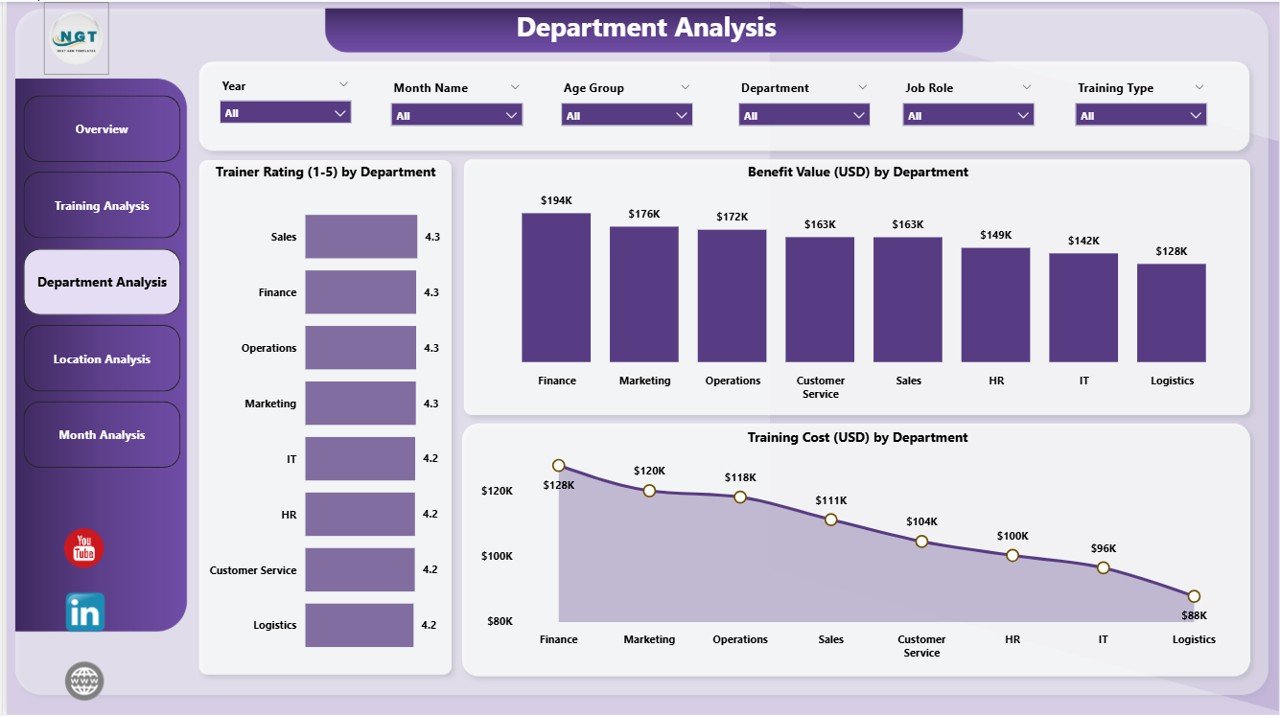
⭐ 3. Department Analysis Page – Identify Strong & Weak Departments
Every department has different training needs. This page highlights departmental success and improvement areas.
Charts displayed:
-
Trainer Rating by Department
-
Benefit Value (USD) by Department
-
Training Cost (USD) by Department
These insights help HR and department heads plan training budgets, redesign learning plans, and improve training outcomes.
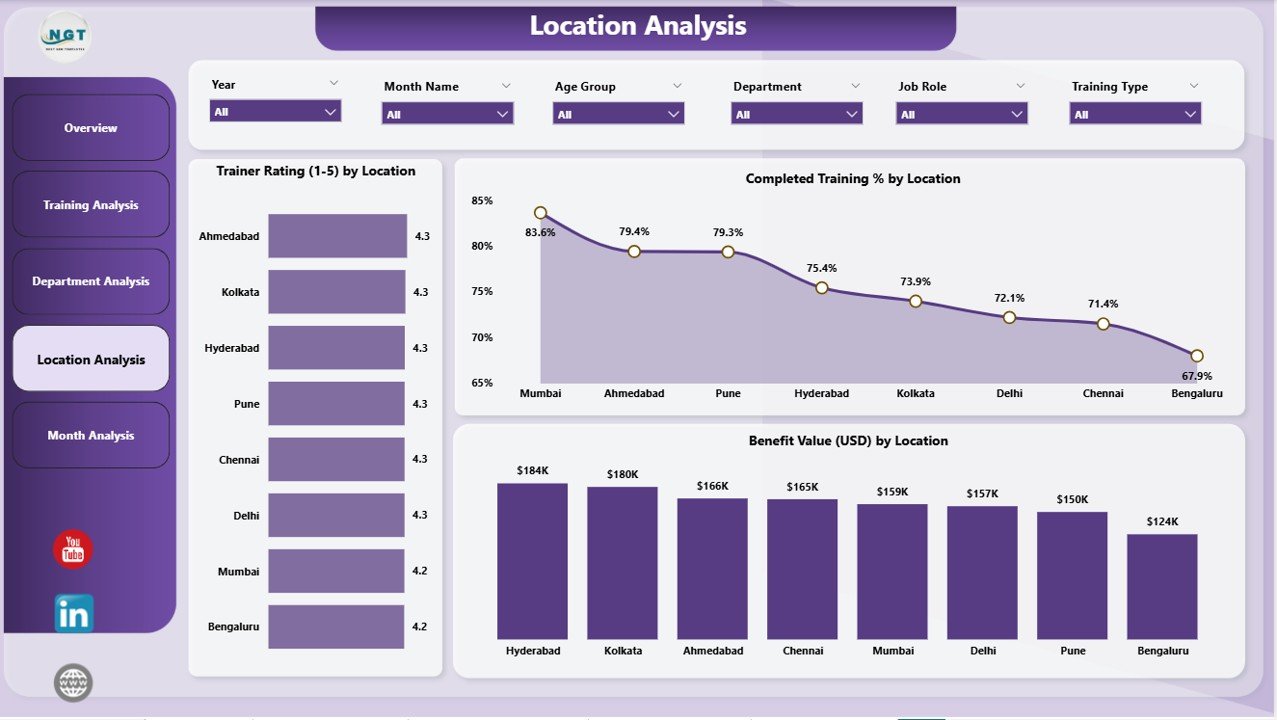
⭐ 4. Location Analysis Page – Compare Training Results Across Locations
If your company operates across cities or countries, location-wise analysis becomes essential.
Charts displayed:
-
Trainer Rating by Location
-
Benefit Value (USD) by Location
-
Completed Value (USD) by Location
This page helps organizations discover which regions need more support and which locations produce the strongest results.
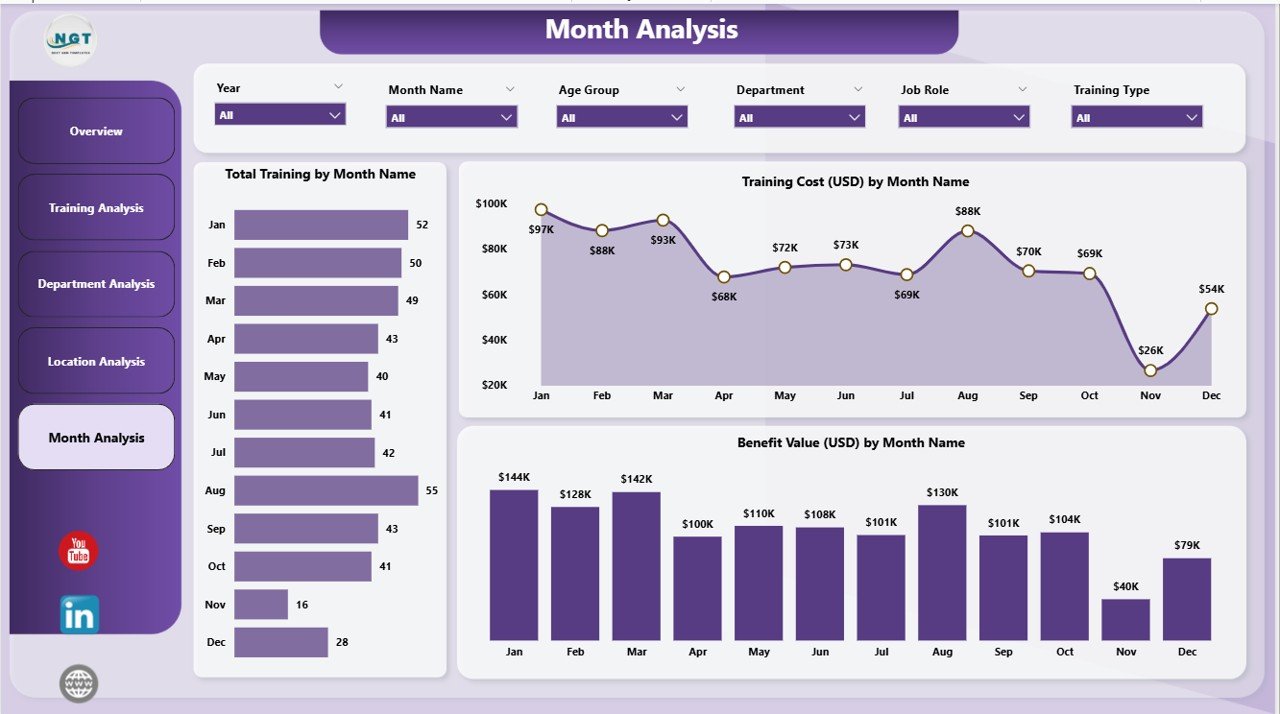
⭐ 5. Monthly Trends Page – Track Performance Month by Month
Monthly trend analysis helps companies monitor training progress throughout the year.
Charts displayed:
-
Trainer Rating by Month
-
Benefit Value (USD) by Month
-
Total Training Count by Month
These visuals help identify seasonal patterns, measure improvement, and plan future training schedules more effectively.
🛠️ How to Use the Corporate Training Dashboard in Power BI
This dashboard is simple, dynamic, and fully automated. You don’t need advanced Power BI knowledge to use it.
How to use it:
➡️ Load your training data into Power BI
➡️ Apply slicers to filter by month, department, region, or training type
➡️ Explore KPIs and charts to monitor performance
➡️ Compare cost, satisfaction, and trainer ratings
➡️ Export insights for leadership presentations
➡️ Customize visuals or add new KPIs anytime
Because the dashboard updates automatically, training teams no longer need to prepare manual Excel reports.
👥 Who Can Benefit from This Corporate Training Dashboard in Power BI
🎯 HR & L&D Teams
Track company-wide training outcomes effortlessly.
🎯 Department Managers
Monitor team performance and training ROI.
🎯 Training Coordinators
Identify progress status and completion rates.
🎯 Corporate Trainers & Faculties
Understand feedback and rating patterns.
🎯 Leadership Teams
Make strategic decisions based on clear data.
🎯 Global Training Teams
Compare performance across multiple locations.
This dashboard is suitable for organizations of all sizes—small businesses, mid-sized companies, and large enterprises.
### 📘 Click here to read the Detailed Blog Post
### 📺 Visit our YouTube channel to learn step-by-step video tutorials:
👉 Youtube.com/@PKAnExcelExpert


Reviews
There are no reviews yet.