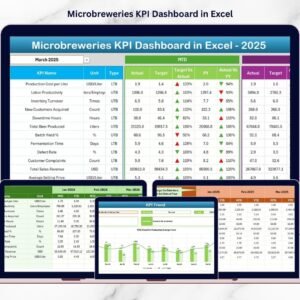
Content marketing is one of the most effective strategies for attracting customers, building brand authority, and generating high-quality leads. However, many marketing teams struggle to measure the true impact of their content campaigns. When performance data is scattered across multiple tools and spreadsheets, it becomes difficult to track engagement, monitor traffic growth, and evaluate marketing success.
That is exactly where the Content Marketing KPI Scorecard in Excel becomes a powerful marketing analytics solution.
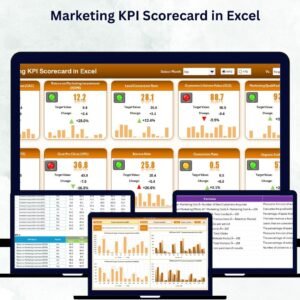
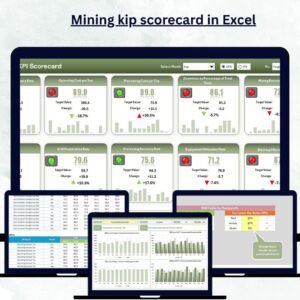
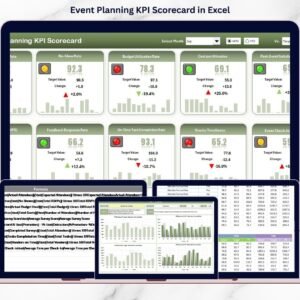
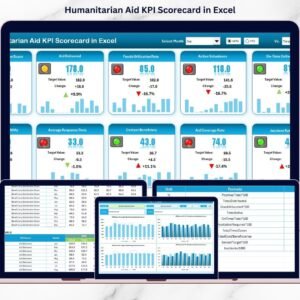
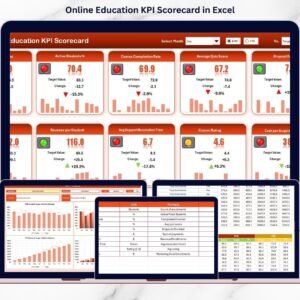
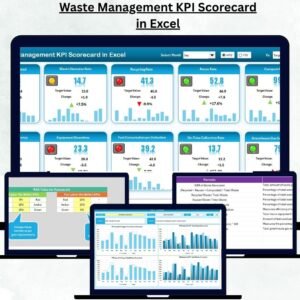
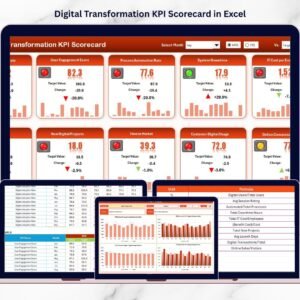
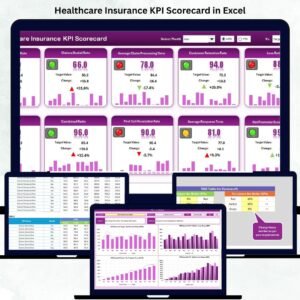
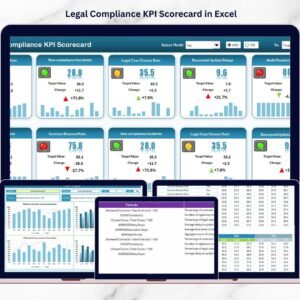
This ready-to-use Excel KPI scorecard helps marketing teams monitor key performance indicators related to content marketing campaigns, website traffic, audience engagement, and lead generation. Instead of analyzing multiple reports manually, marketers can evaluate their entire content performance from a single structured dashboard.
The template combines KPI monitoring, trend analysis, and data entry sheets to create a complete content marketing performance management system. With automatic comparisons between Actual values, Target values, and Previous Year performance, marketing teams can easily determine whether their content strategy is achieving desired results.
Because the scorecard includes interactive dropdown filters, visual indicators, and performance charts, users can quickly identify which campaigns perform well and which require optimization.
Whether you manage blog marketing, SEO campaigns, social media content, or digital lead generation strategies, this Excel scorecard provides a centralized platform to track and improve marketing performance.
As a result, businesses can make data-driven marketing decisions, optimize their content strategy, and increase overall marketing ROI.
🚀 Key Feature of Content Marketing KPI Scorecard in Excel
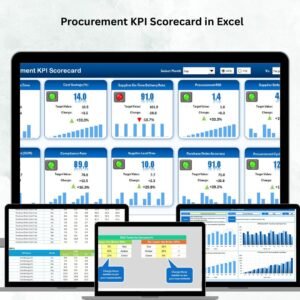
📊 Centralized Content Marketing KPI Dashboard
Monitor all content marketing performance indicators from a single interactive scorecard.
📅 Dynamic Performance Filters
Select Month, MTD, or YTD views using dropdown filters to analyze marketing performance easily.
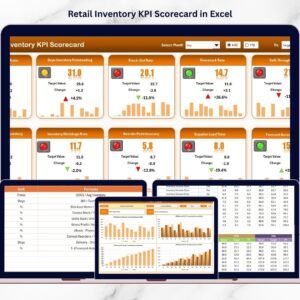
📈 Actual vs Target KPI Comparison
Evaluate whether marketing campaigns meet expected performance goals.
📉 Previous Year Performance Analysis
Compare current results with previous year performance to measure improvement.
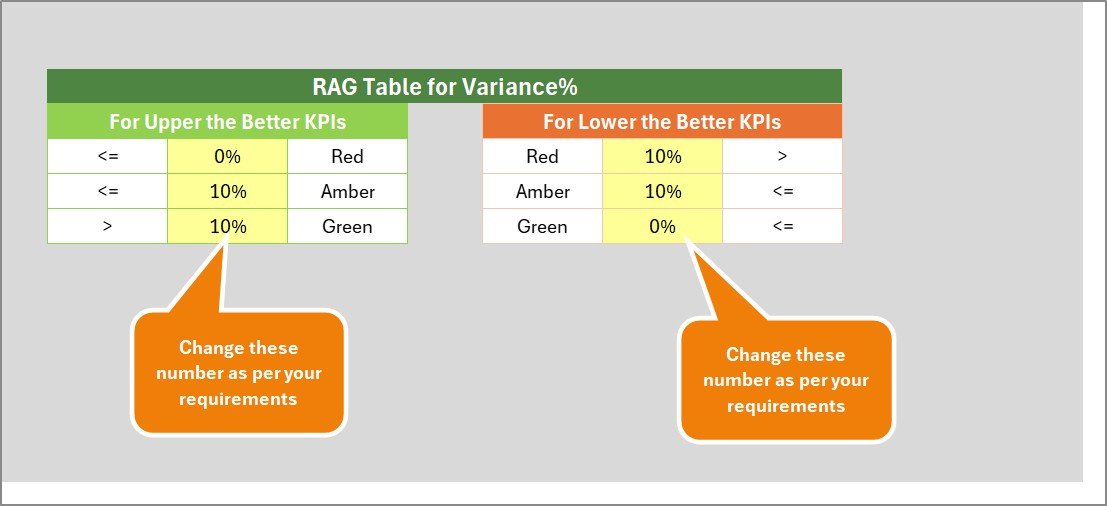
🎯 Visual KPI Performance Indicators
Color-coded indicators instantly highlight strong and weak KPI performance.
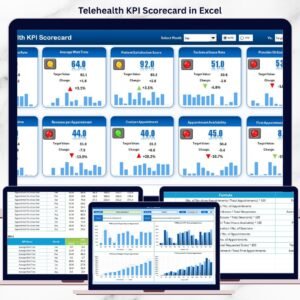
📊 Trend Analysis Charts
Analyze KPI performance trends through dynamic MTD and YTD charts.
⚡ Automated Performance Updates
Once KPI data is entered, the scorecard automatically updates all metrics and charts.
📋 Structured KPI Documentation
Track KPI definitions, formulas, and measurement units in one organized sheet.
📦 What’s Inside the Content Marketing KPI Scorecard in Excel
This ready-to-use template includes four well-structured worksheets designed for complete marketing KPI monitoring.
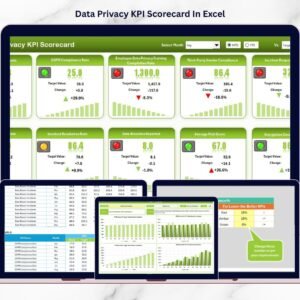
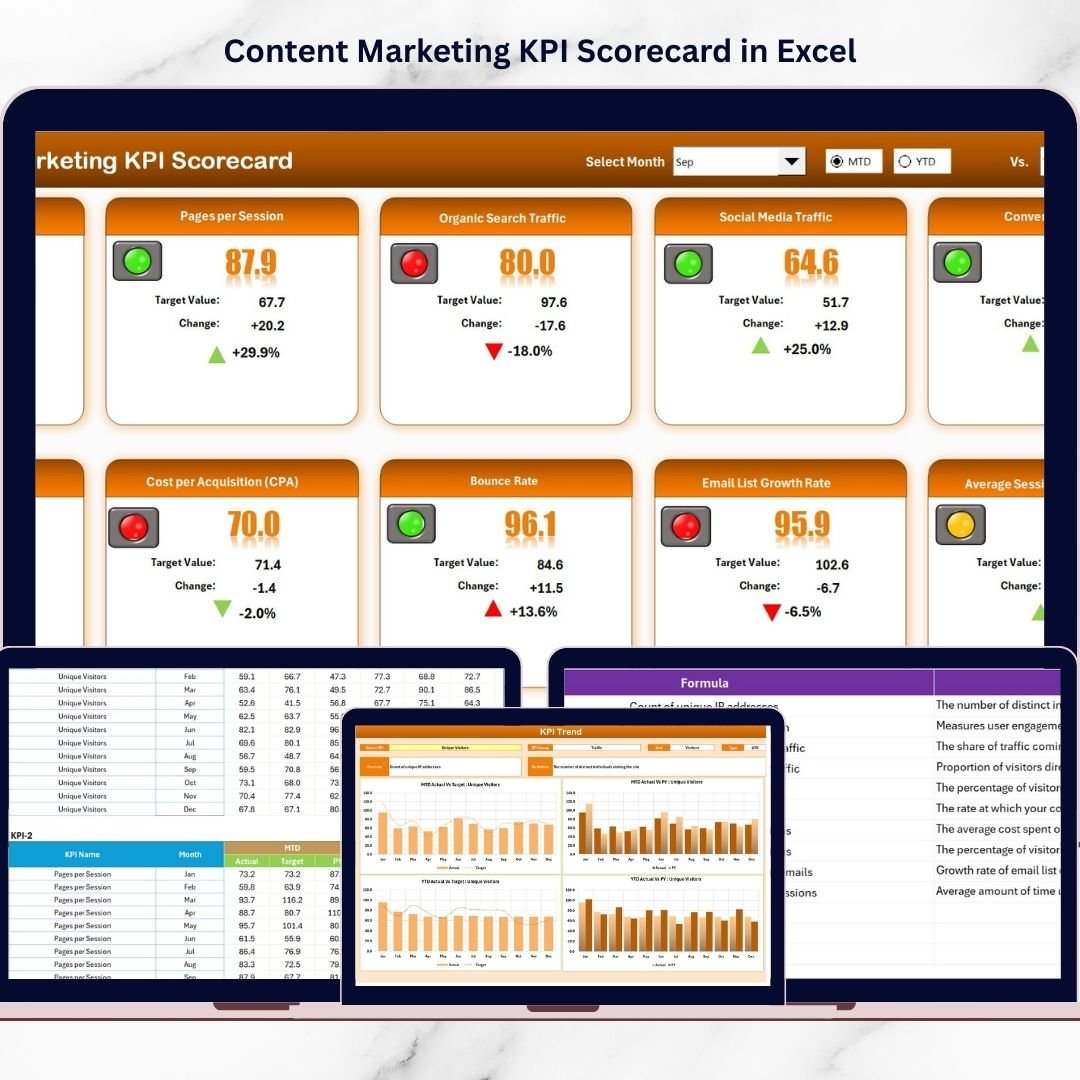
📍 Scorecard Sheet – Main KPI Monitoring Dashboard
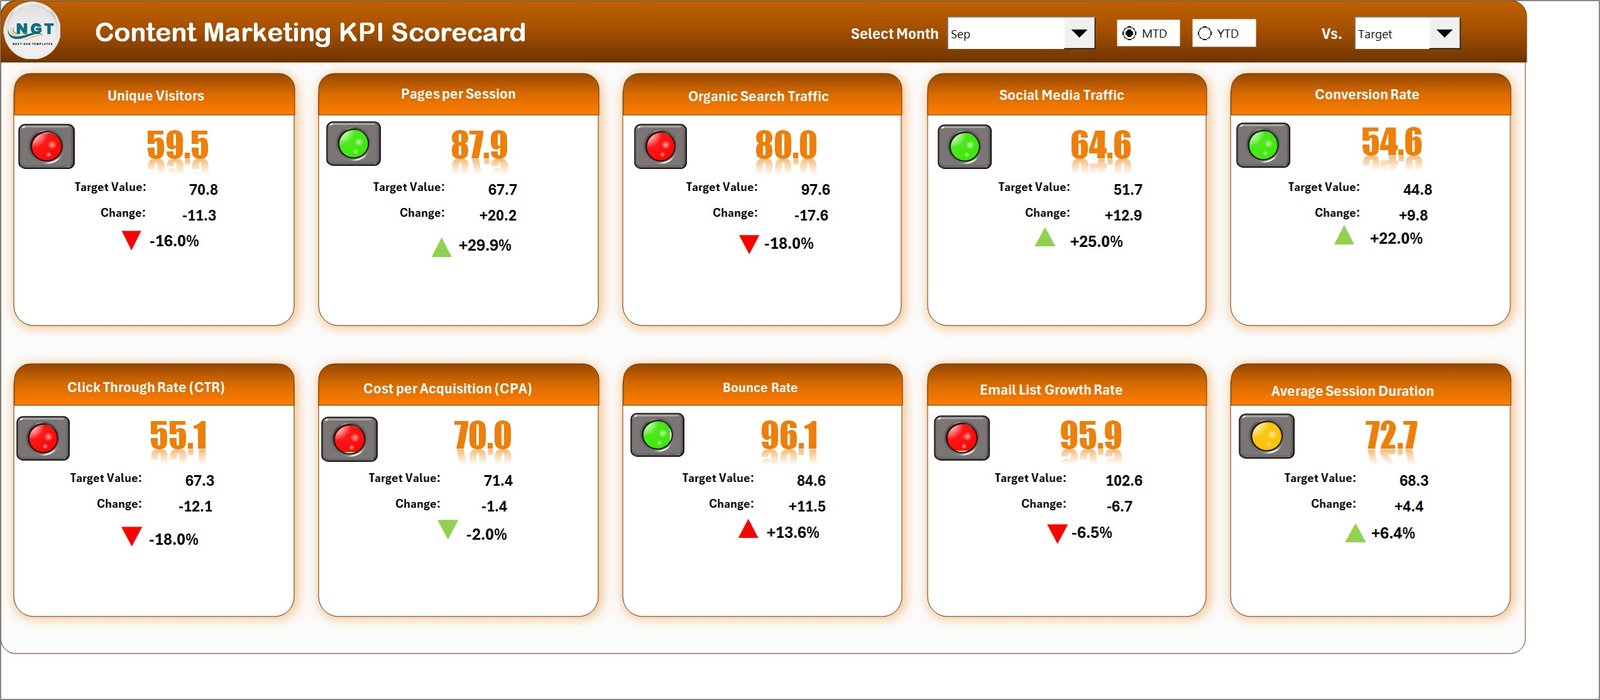
The Scorecard sheet acts as the central analytics page of the template.
Here users can view:
• KPI performance overview
• Actual vs Target comparison
• KPI group and measurement units
• MTD and YTD performance metrics
The dropdown filters allow users to analyze performance for specific months or periods.
Because the scorecard uses conditional formatting indicators, teams can quickly identify high-performing or underperforming KPIs.
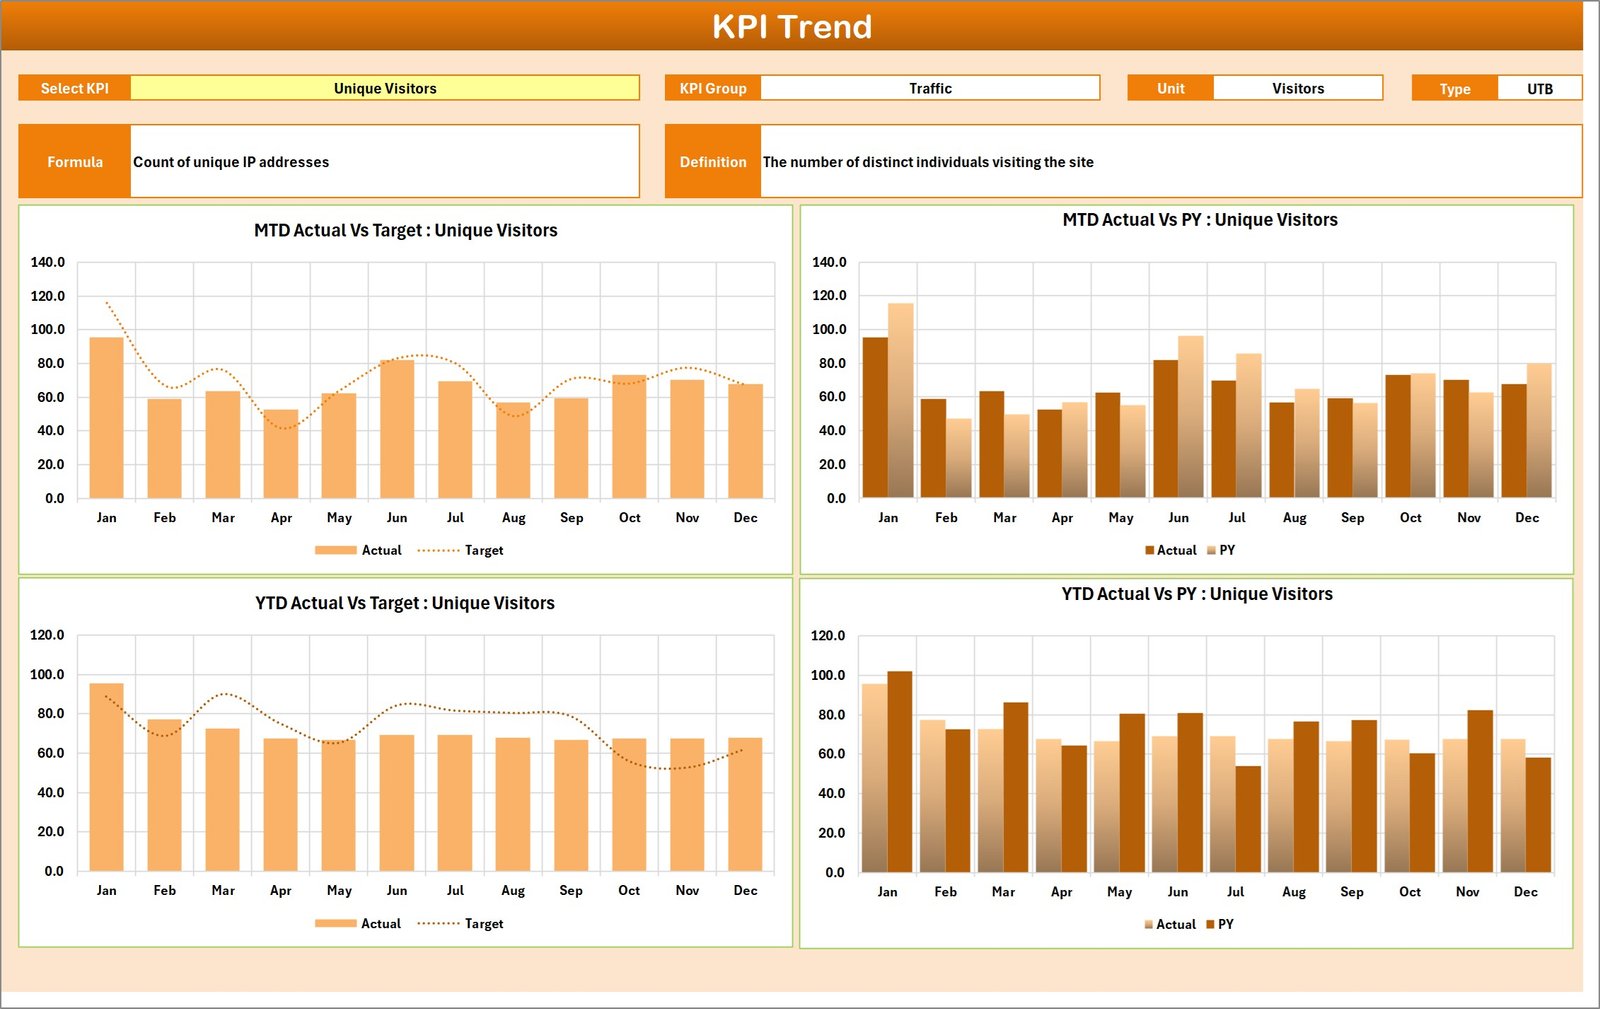
📍 KPI Trend Sheet – KPI Performance Trend Analysis
The KPI Trend sheet helps marketing teams analyze KPI performance over time.
Users can select a specific KPI from the dropdown menu.
The sheet displays detailed KPI information including:
• KPI Group
• Unit of Measurement
• KPI Type (Lower the Better / Upper the Better)
• KPI Formula
• KPI Definition
It also includes two powerful charts:
• MTD Trend Chart – Shows monthly KPI performance trends.
• YTD Trend Chart – Displays cumulative yearly performance.
These charts help teams evaluate long-term marketing growth.
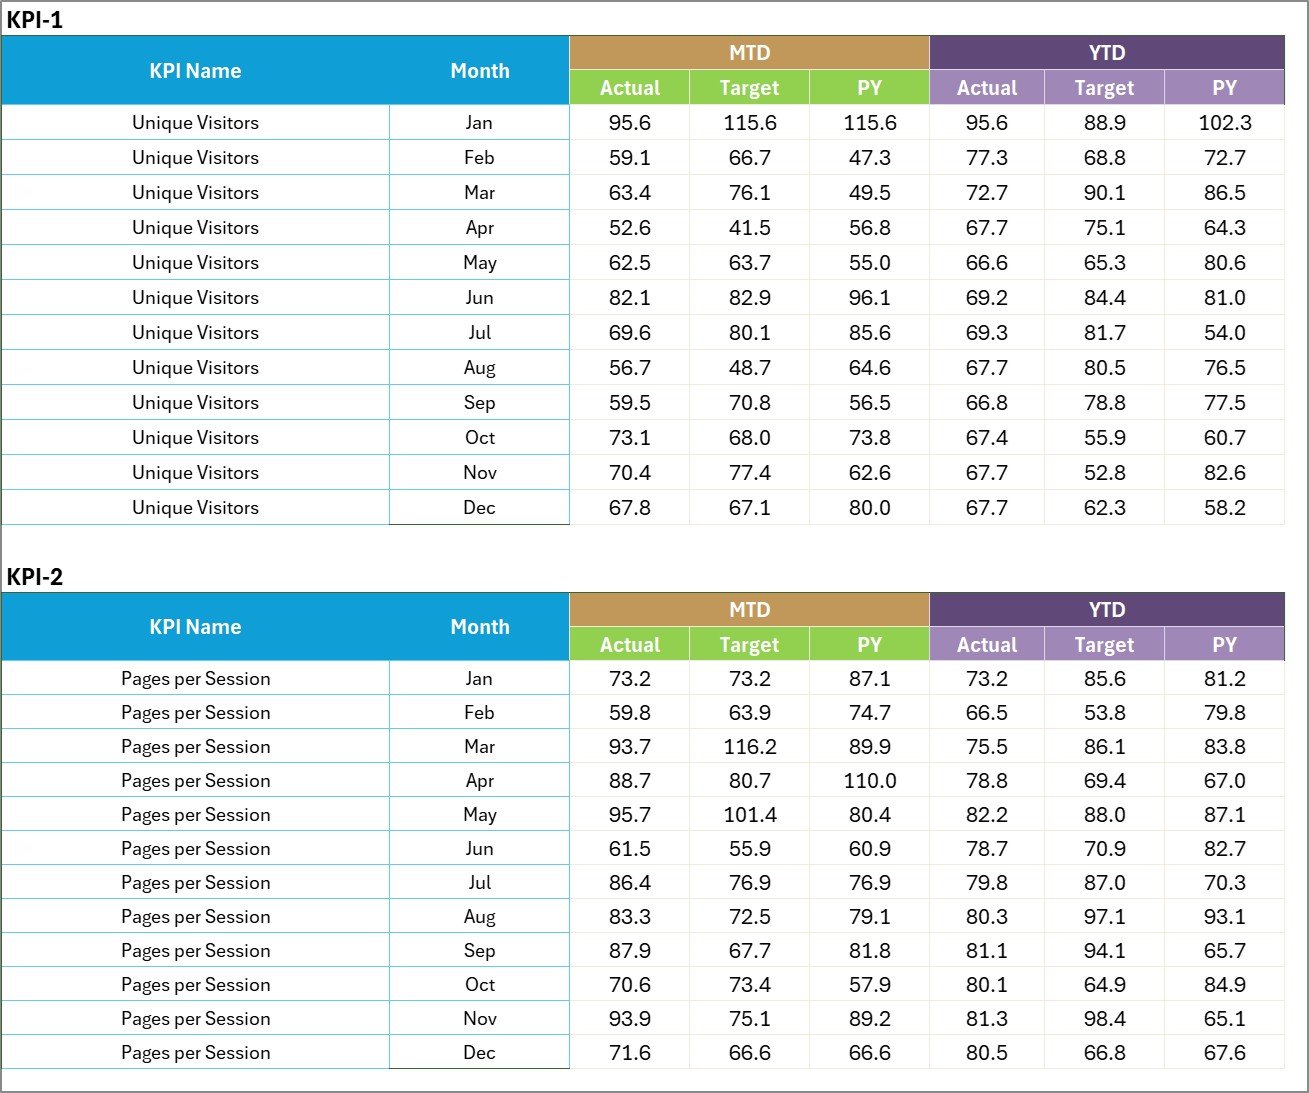
📍 Input Data Sheet – KPI Data Entry Section
The Input Data sheet is where users enter KPI performance values.
Users can record:
• Actual KPI results
• Target values
• Monthly data
• Year-to-date results
Once the data is entered, the scorecard automatically updates all performance indicators.
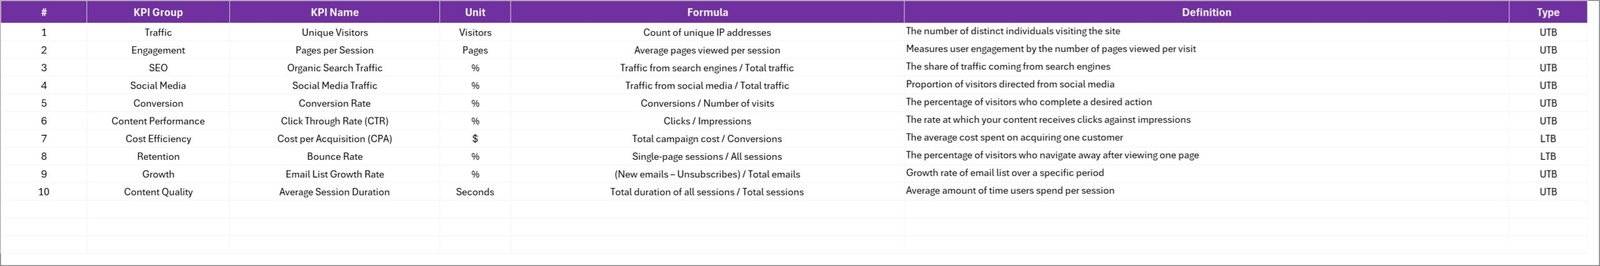
📍 KPI Definition Sheet – KPI Documentation
The KPI Definition sheet stores detailed information about each KPI used in the scorecard.
Users can define:
• KPI Name
• KPI Group
• Unit of Measurement
• KPI Formula
• KPI Definition
This ensures that marketing teams clearly understand how each KPI is measured.
🛠 How to Use the Content Marketing KPI Scorecard in Excel
Using this template is simple and does not require advanced Excel skills.
Step 1 – Define Marketing KPIs
Enter KPI details in the KPI Definition sheet.
Step 2 – Input Performance Data
Enter monthly actual values and target values in the Input Data sheet.
Step 3 – Select Performance Period
Use dropdown filters to select Month, MTD, or YTD analysis.
Step 4 – Analyze KPI Trends
Use the KPI Trend sheet to analyze long-term marketing performance.
Step 5 – Optimize Marketing Strategy
Use KPI insights to improve content marketing campaigns and engagement strategies.
👩💻 Who Can Benefit from This Content Marketing KPI Scorecard in Excel
This scorecard template is ideal for professionals responsible for monitoring marketing performance.
📊 Digital Marketing Teams – Track content campaign performance and engagement metrics.
📈 Content Marketing Managers – Monitor blog traffic, conversions, and audience growth.
📢 SEO Specialists – Analyze organic traffic and content performance.
📋 Marketing Analysts – Evaluate campaign effectiveness and performance trends.
🏢 Marketing Agencies – Monitor client campaign KPIs efficiently.
📑 Business Owners – Gain clear insights into marketing ROI and campaign performance.
Click hare to read the Detailed blog post
Visit our YouTube channel to learn step-by-step video tutorials
https://www.youtube.com/@PKAnExcelExpert