
Container shipping carries the backbone of global trade. But managing a shipping business is not easy costs fluctuate, fuel prices rise, routes behave differently, and detention charges can quickly reduce profit. Many logistics teams still depend on scattered spreadsheets and manual reports, making it difficult to understand key patterns or make informed decisions.
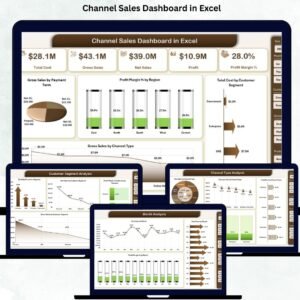
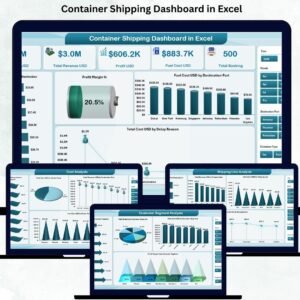
That’s exactly where the Container Shipping Dashboard in Excel becomes essential. Container Shipping Dashboard in Excel This ready-to-use dashboard gives logistics teams, freight forwarders, and shipping companies a clear, interactive, and data-driven view of their entire shipping performance. It tracks costs, revenue, profit, fuel consumption, customer segment behaviour, shipping line performance, and monthly trends—all inside one easy-to-use Excel file.
No complex tools. No advanced software. Just Excel.
Whether you’re managing shipments, optimizing costs, studying customer profit, or analysing port behaviour, this dashboard simplifies the entire process. Every insight updates automatically when you refresh your data sheet, making it perfect for weekly, monthly, or quarterly reporting.
✨ Key Features of the Container Shipping Dashboard in Excel
This dashboard includes five powerful analytics pages and two backend sheets, each designed to support smarter decision-making.
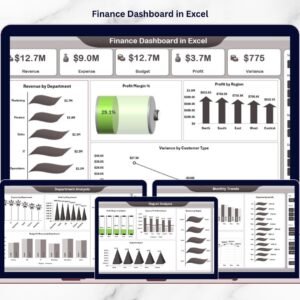
📌 Overview Page – One-Page Summary of Shipping Performance

The Overview Page gives you an instant understanding of your logistics operations. It includes:
🔹 KPI Cards
✔ Total Cost (USD)
✔ Total Revenue (USD)
✔ Profit (USD)
✔ Fuel Cost (USD)
✔ Total Booking
These high-level metrics help you understand the financial health of your shipping operations instantly.
🔹 Key Charts
✔ Profit Margin %
✔ Fuel Cost (USD) by Destination Port
✔ Total Cost (USD) by Delay Reason
✔ Detention (USD) by Destination Port
These visuals highlight areas that need immediate attention—whether it’s port delays, increasing detention charges, or low profit margins.
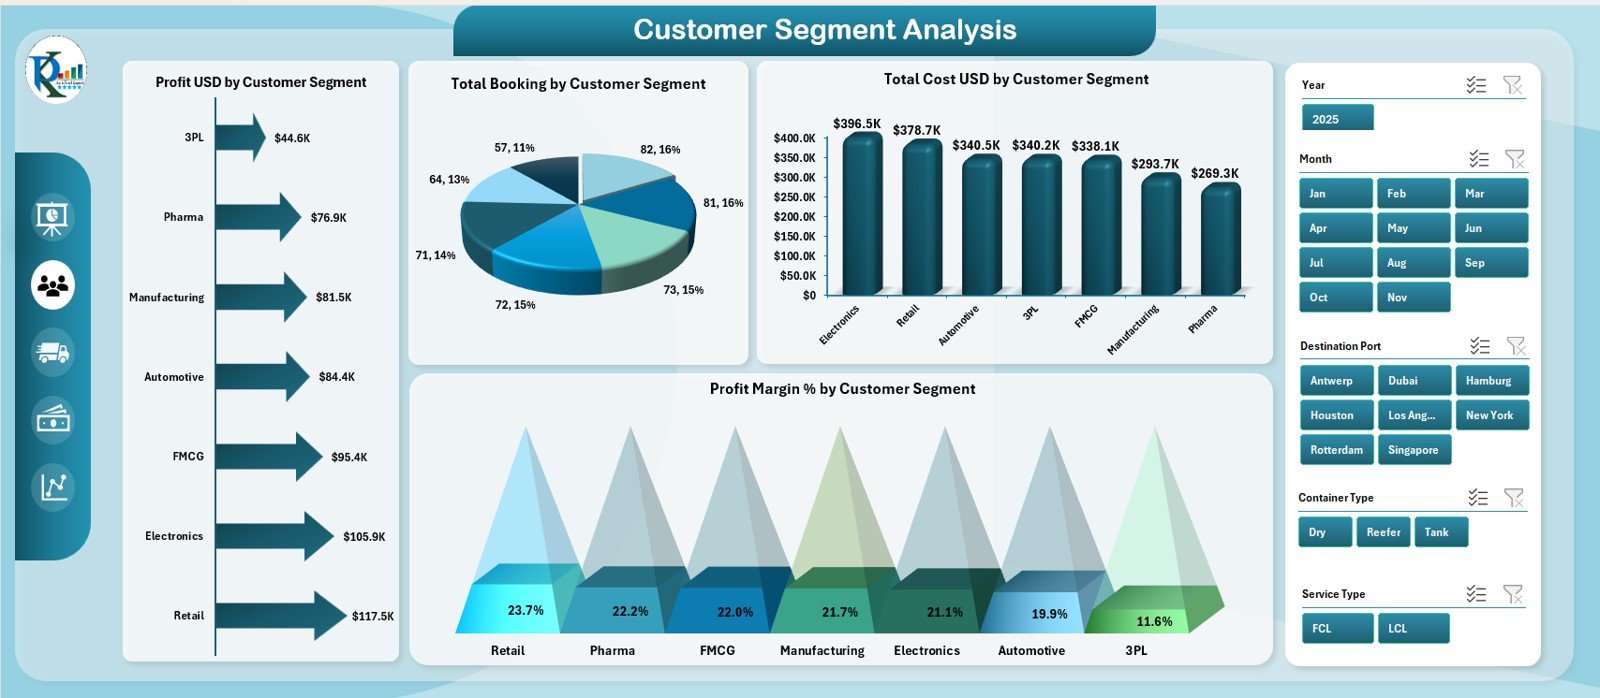
📌 Customer Segment Analysis Page – Know Your Most Profitable Customers
This page breaks down your shipping performance by customer category using four charts:
✔ Total Booking by Customer Segment
✔ Total Cost by Customer Segment
✔ Profit by Customer Segment
✔ Profit Margin % by Customer Segment
With these insights, you understand:
– Which customer segments generate higher revenue
– Which segments create cost pressure
– Where to improve pricing and discounts
– How to design smarter retention strategies
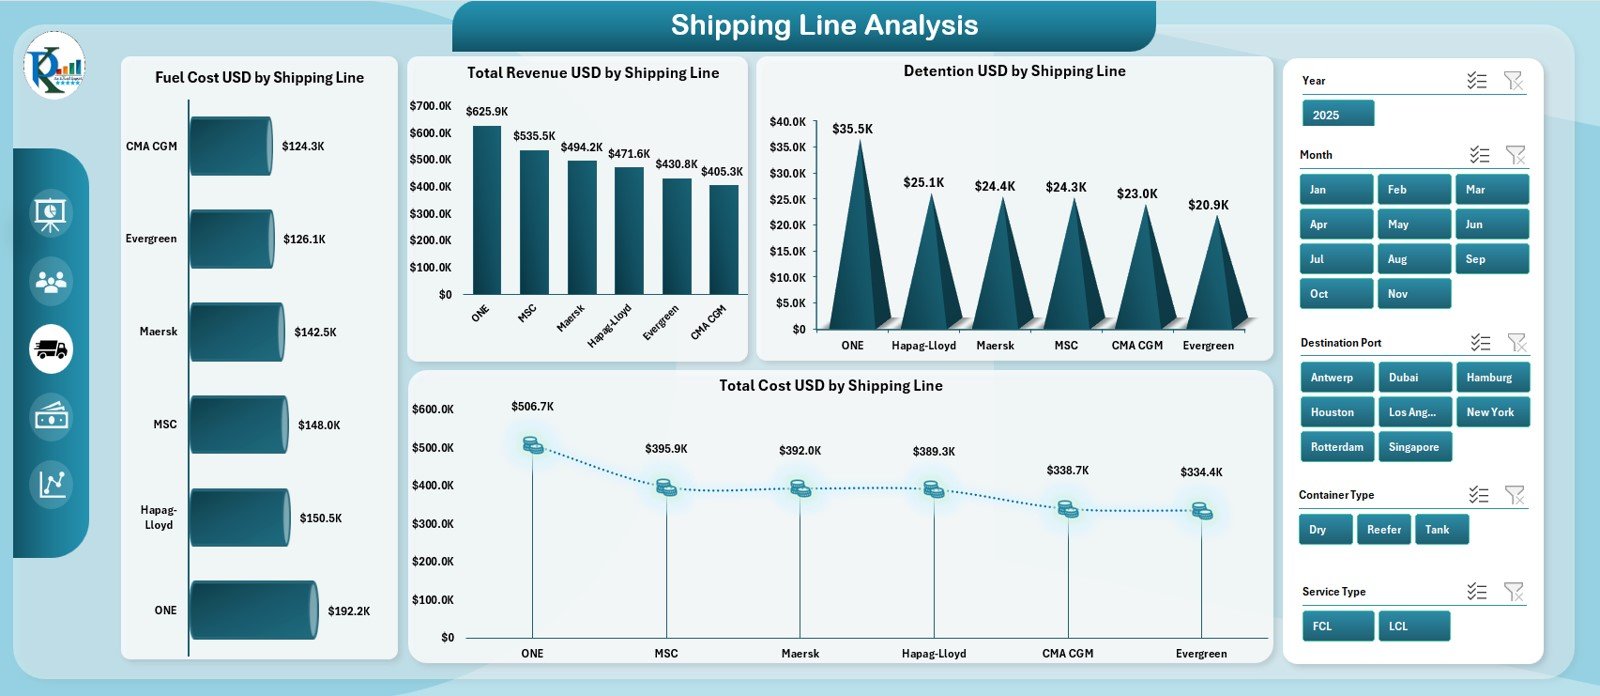
📌 Shipping Line Analysis Page – Compare Partner Performance
Shipping lines behave differently. This page helps you compare:
✔ Revenue by Shipping Line
✔ Detention by Shipping Line
✔ Fuel Cost by Shipping Line
✔ Total Cost by Shipping Line
These insights help you choose the right partners, negotiate better contracts, and eliminate underperforming lines.
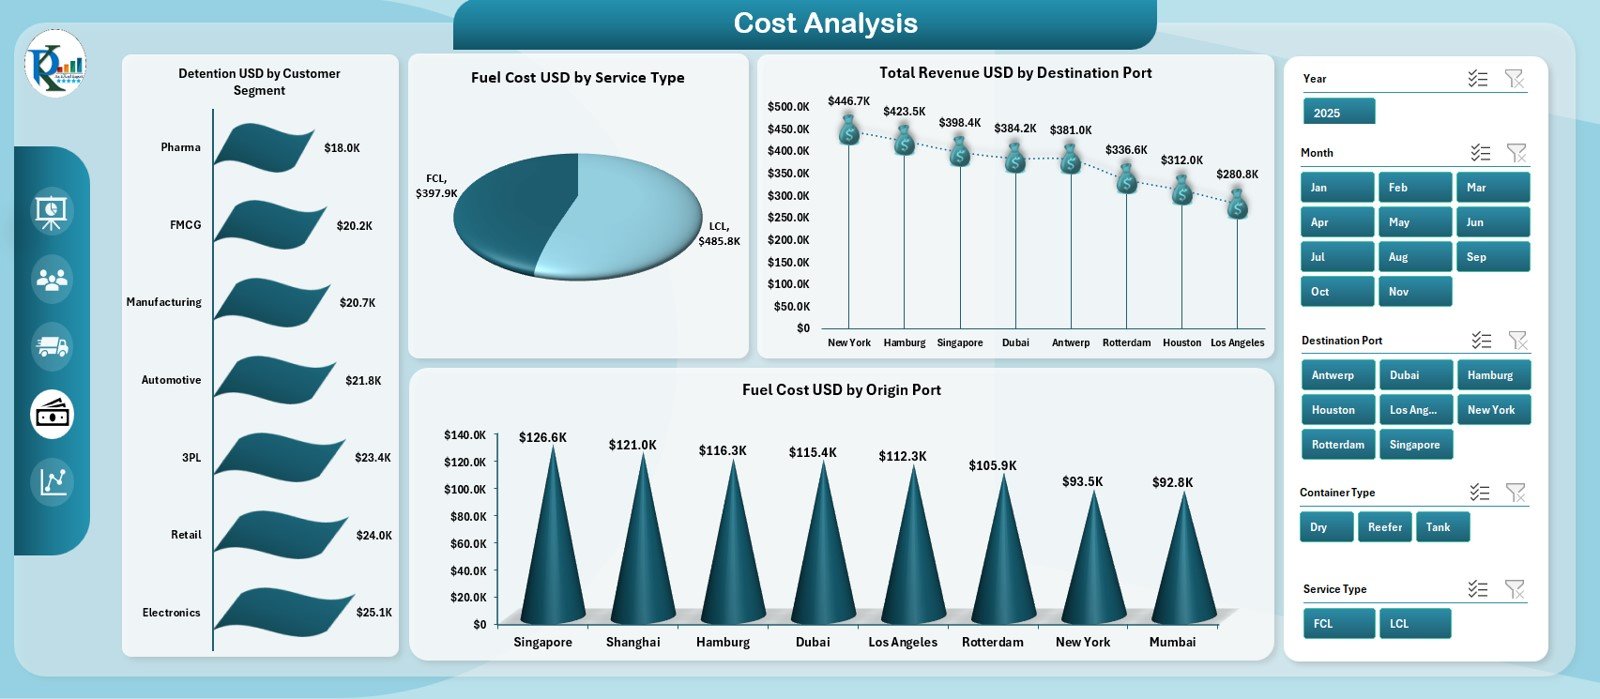
📌 Cost Analysis Page – Understand the True Cost Drivers
This page focuses on cost behaviour across multiple dimensions:
✔ Fuel Cost by Service Type
✔ Revenue by Destination Port
✔ Fuel Cost by Origin Port
✔ Detention by Customer Segment
You immediately see where costs increase, which customers cause higher expenses, and how routes impact profitability.
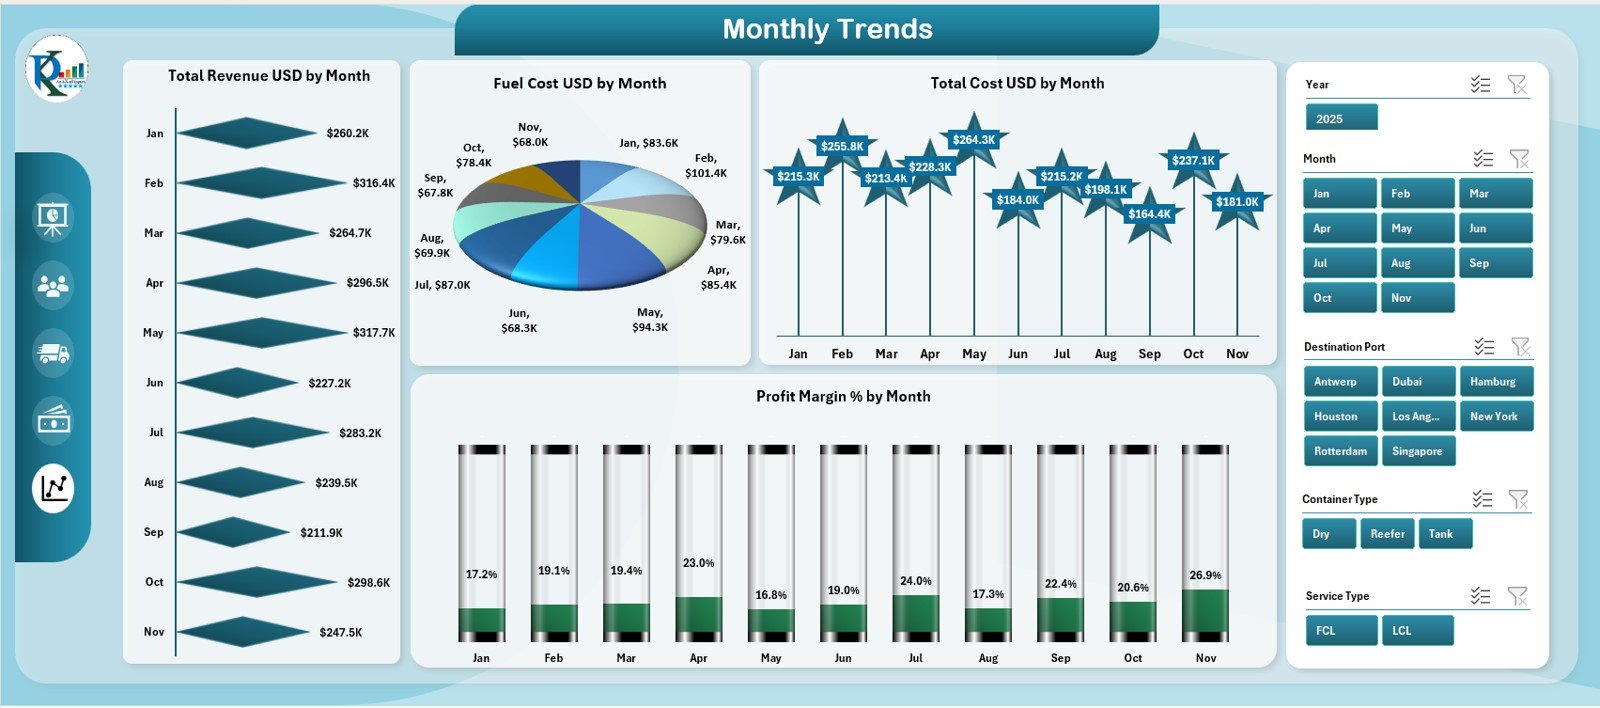
📌 Monthly Trends Page – Identify Seasonality & Predict Future Performance
The Monthly Trends Page includes:
✔ Fuel Cost by Month
✔ Total Cost by Month
✔ Profit Margin % by Month
✔ Revenue by Month
These trend charts uncover seasonality, demand cycles, cost peaks, and monthly behaviour patterns—helping in forecasting and budgeting.
📦 Support & Data Sheets – The Backend That Powers Everything
📁 Support Sheet
Stores helper lists, dropdowns, and formula references for a clean backend.
📁 Data Sheet
You enter raw operational data here:
– Ports
– Fuel cost
– Detention
– Service type
– Revenue
– Cost
– Shipping line
– Booking count
– Delay reasons
The entire dashboard refreshes automatically from this sheet.
🛠️ How to Use the Container Shipping Dashboard in Excel
👉 Step 1: Enter or paste your operational data into the Data Sheet
👉 Step 2: Refresh the dashboard
👉 Step 3: Navigate through pages using the sidebar
👉 Step 4: Study monthly trends, route performance & customer insights
👉 Step 5: Make informed, confident decisions
🎯 Who Can Benefit from This Dashboard?
🚢 Shipping Companies
Improve cost, fuel management, and route performance.
📦 Logistics Teams
Track daily operations and optimize expenses.
🌍 Freight Forwarders
Monitor customer profitability and shipping partner behavior.
📊 Supply Chain Analysts
Use data-driven insights for planning and forecasting.
🏭 Import–Export Businesses
Understand cost patterns and improve shipment decisions.


Reviews
There are no reviews yet.