In consumer electronics, your service experience is your brand. Customers don’t just want a repair—they want speed, transparency, and trust. But when service tracking is spread across spreadsheets and manual reports, the outcome is painful: delays increase, service costs grow, customer complaints rise, and leadership can’t see what’s actually happening.
That’s why we created the Consumer Electronics Service Dashboard in Power BI 🔧📊
It’s a ready-to-use analytics system that transforms raw service data into real-time, decision-ready insights. Instead of reviewing multiple reports, you get one centralized Power BI dashboard to monitor service performance, customer satisfaction, operational costs, and revenue impact—clearly and consistently.
This dashboard is built for high-volume service operations. It helps you track service requests, service status, high-priority cases, cost drivers, satisfaction trends, and time-based workload patterns. With interactive filters and visual KPIs, managers can instantly spot bottlenecks and improve service efficiency—before customer satisfaction drops.
If you manage service centers, repair partners, customer support teams, or electronics product lines, this dashboard becomes your daily command center.
Key Feature of Consumer Electronics Service Dashboard in Power BI
🚀 Ready-to-use Power BI dashboard for after-sales service performance monitoring
🎛️ Interactive slicers & filters to explore performance by region, product, channel, and time
📌 Executive KPI cards for instant visibility:
-
High Priority Level %
-
Total Service by Service Status
-
Customer Satisfaction by Region
-
Service Cost by Issue Type
-
Overall service performance indicators
⚠️ High-priority service monitoring to detect operational risk immediately
😊 Customer satisfaction analytics to protect brand reputation and loyalty
💰 Cost and profitability insights to control service expense growth
📈 Revenue analysis to measure service-related business impact
📦 Product category performance view to identify complaint-heavy or cost-heavy products
🧩 5 analytical pages to cover operations, products, channels, regions, and monthly trends
🔄 Automated reporting that reduces manual effort and improves consistency
What’s Inside the Consumer Electronics Service Dashboard in Power BI
This solution includes five analytical pages inside Power BI Desktop—each page answers a specific service management question:
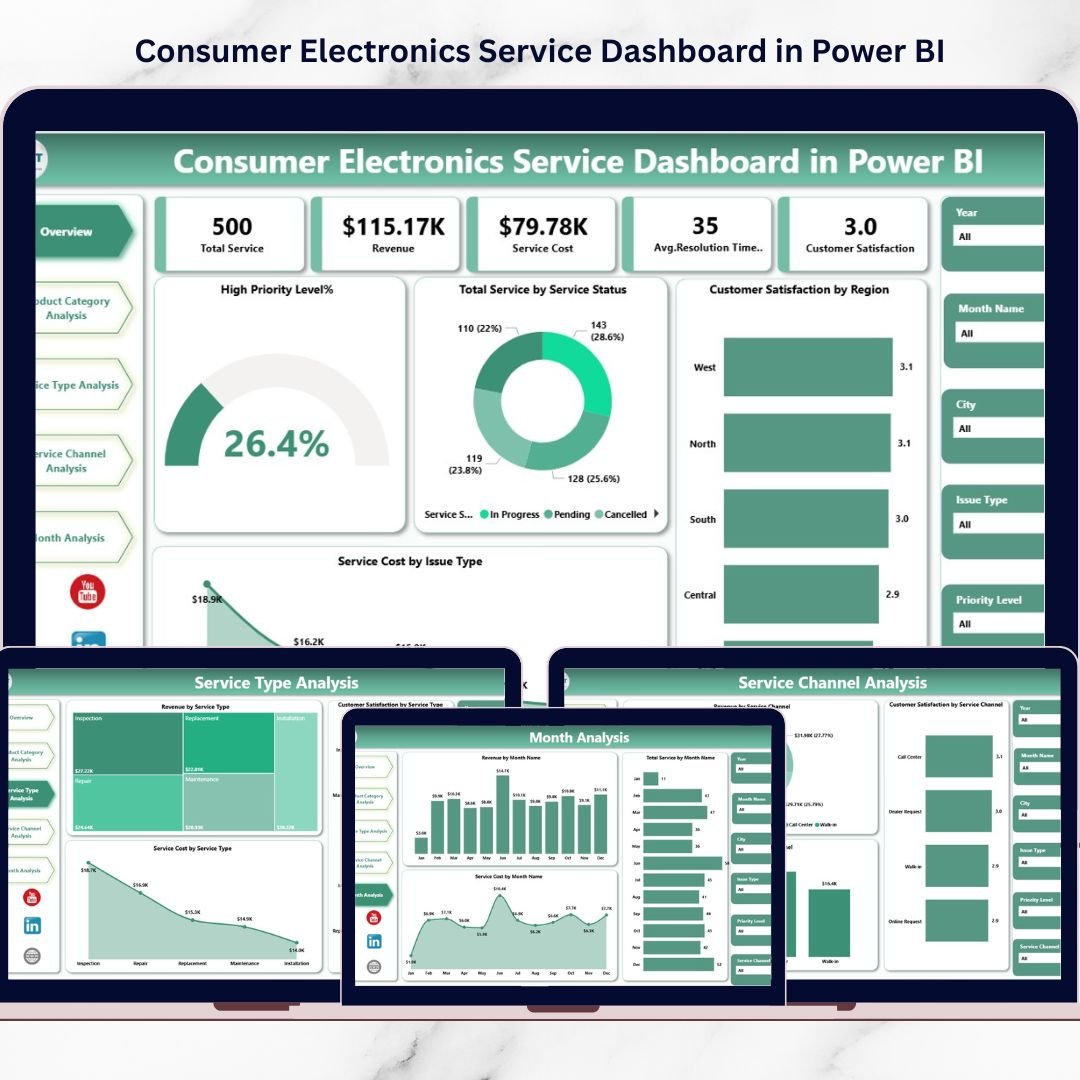
📌 1) Overview Page (Central Performance Monitoring)
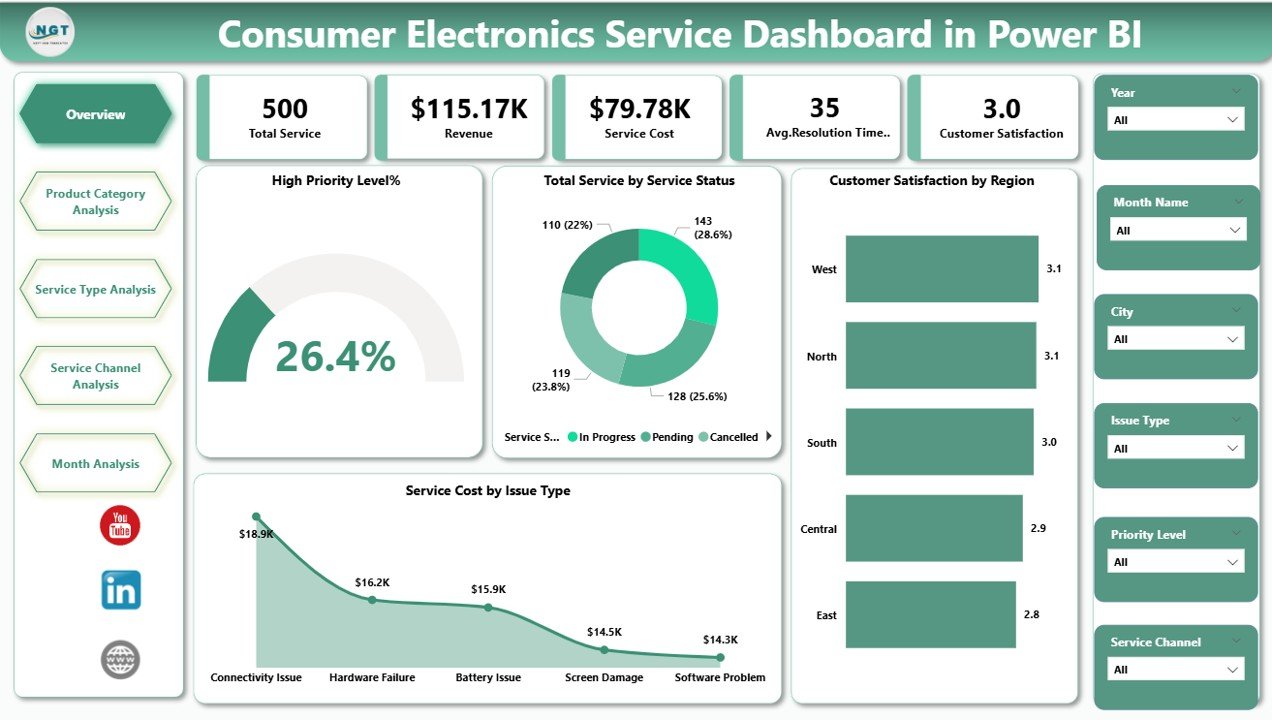
Your main dashboard screen with KPI cards and visuals such as:
-
High Priority Service Analysis
-
Service Status Distribution
-
Regional Satisfaction Comparison
-
Issue-Type Cost Analysis
This page helps managers detect operational risks fast—especially when high-priority cases rise.
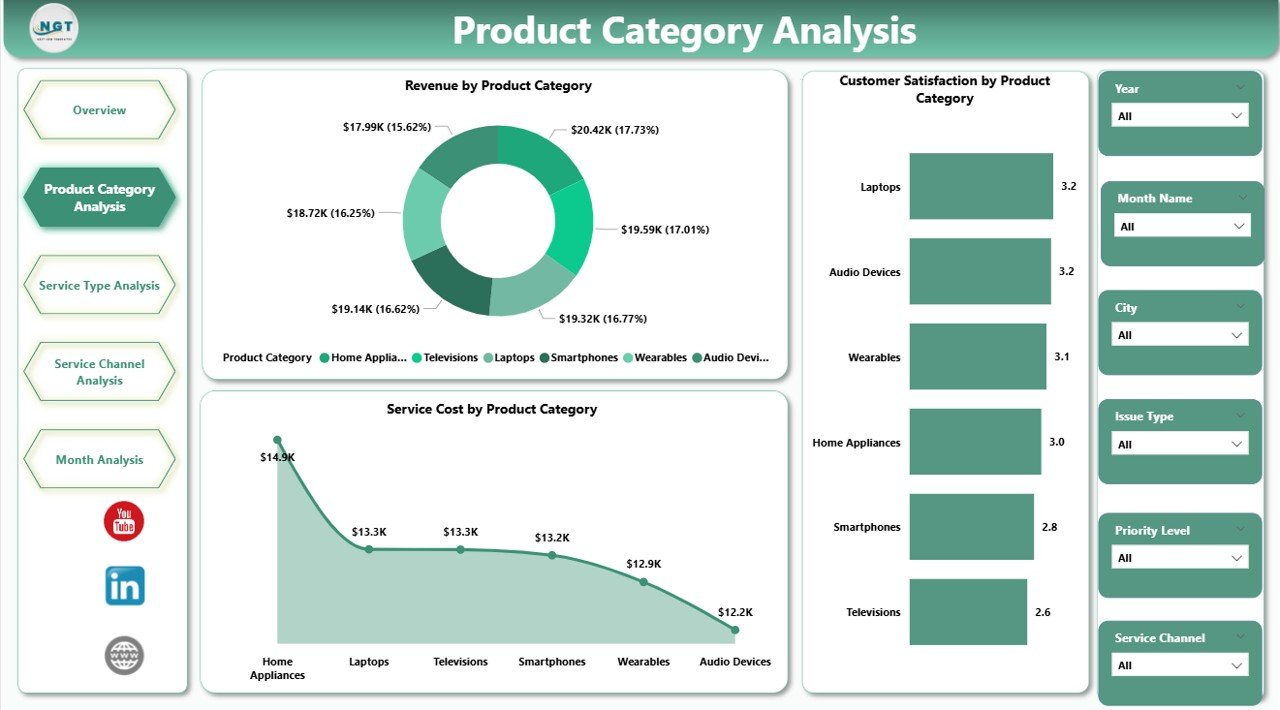
📦 2) Product Category Analysis (Product Performance Insights)
Understand service behavior by product category using visuals like:
-
Revenue by Product Category
-
Customer Satisfaction by Product Category
-
Service Cost by Product Category
Perfect for identifying which devices create frequent complaints, drive service revenue, or consume high service costs.
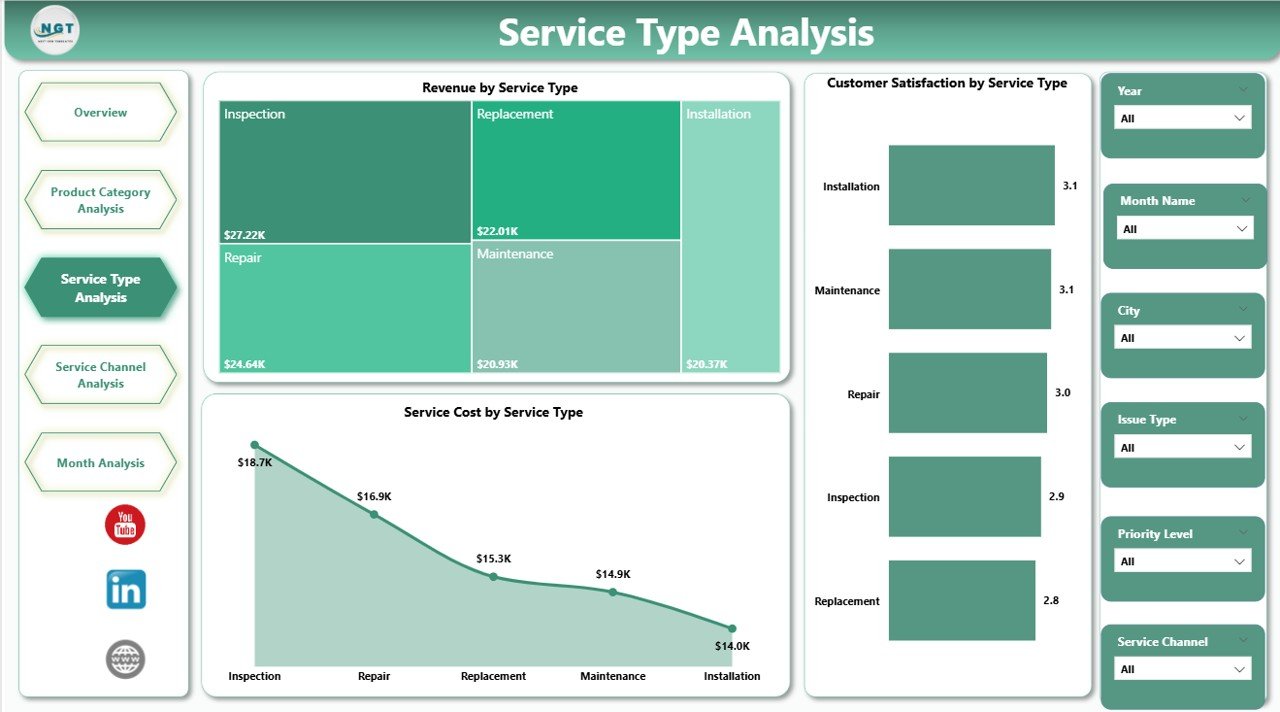
🧰 3) Service Type Analysis (Service Channel Efficiency)
Compare performance across service channels and see what’s efficient:
-
Revenue by Service Channel
-
Customer Satisfaction by Service Channel
-
Service Cost by Service Channel
This page highlights which channel resolves issues faster, costs less, and delivers better experience—so you can optimize your support strategy.
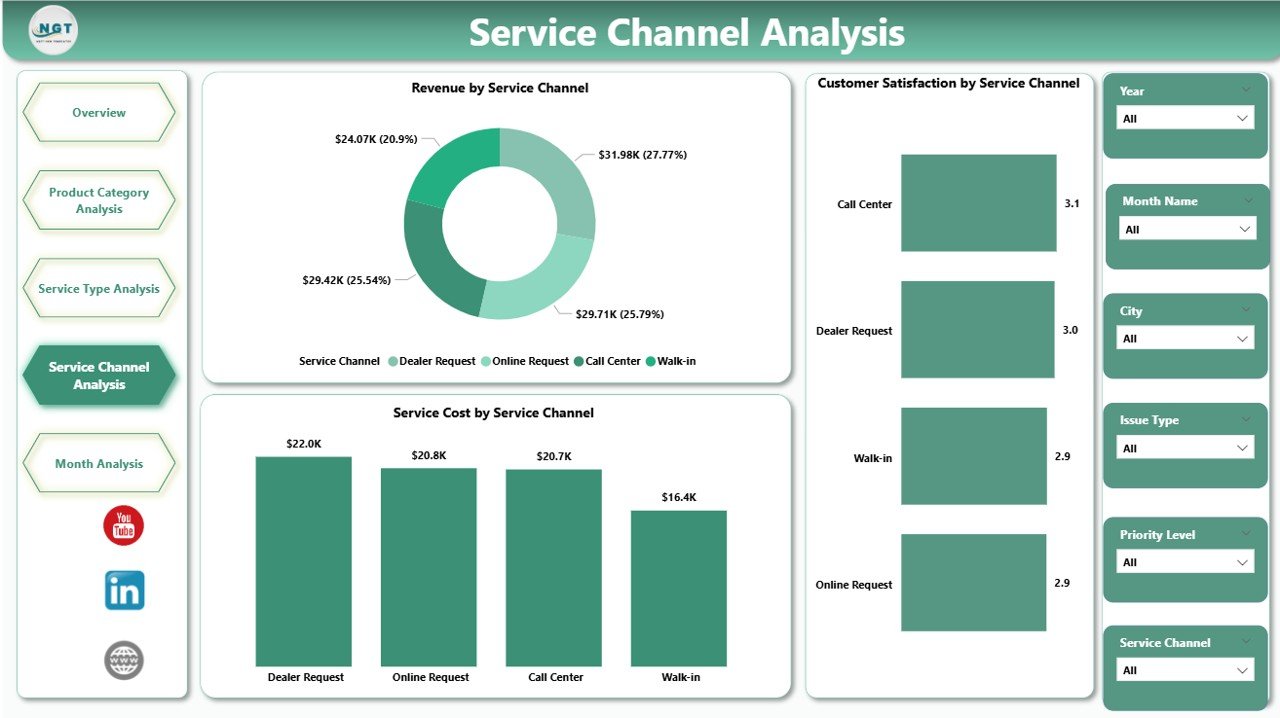
🌍 4) Service Channel Analysis (Regional Sales & Profit Insights)
This page focuses on geographic business performance and profitability:
-
Profit Margin % by Region
-
Target Sales by Region
-
Gross Sales by Region
Use it to see which regions exceed targets, where profitability is stronger, and how service and sales performance align.
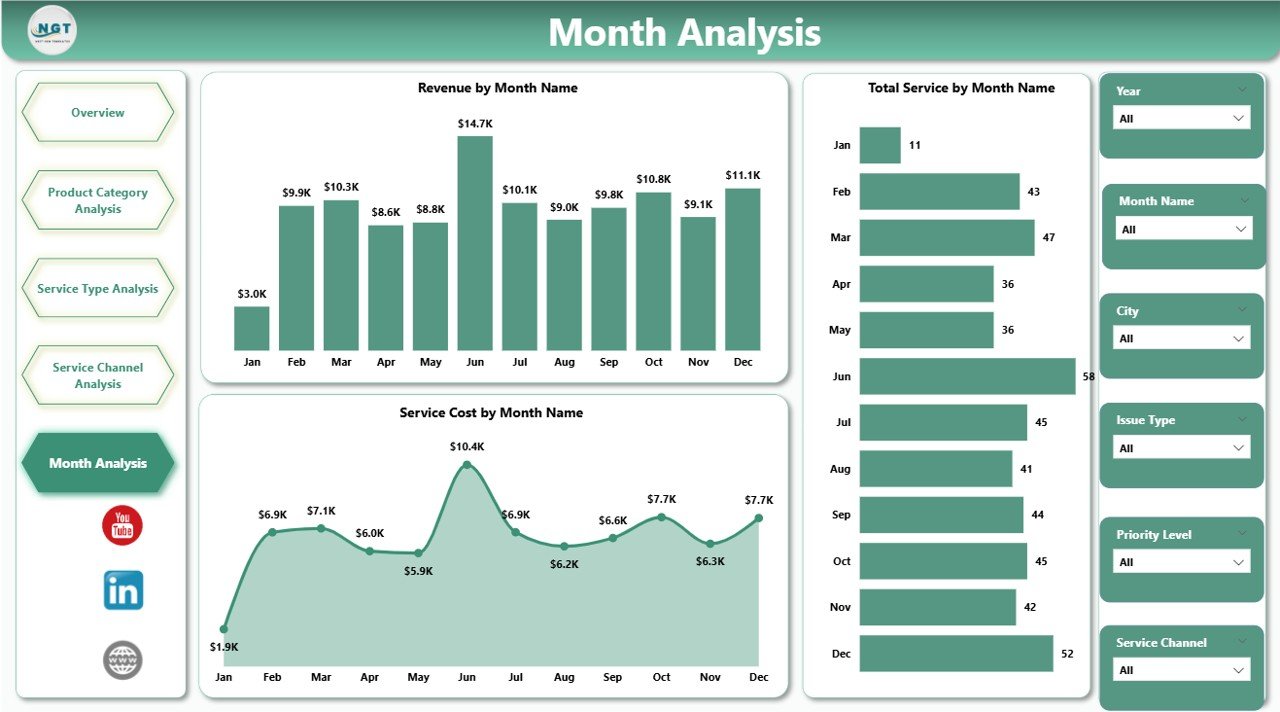
📅 5) Month Analysis (Time-Based Performance Tracking)
Trend analysis over time with charts such as:
-
Revenue by Month
-
Total Service by Month
-
Service Cost by Month
This page reveals seasonal service spikes, workload patterns, and cost growth trends—so you plan staffing and resources proactively.
How to Use the Consumer Electronics Service Dashboard in Power BI
Using this dashboard is straightforward:
1️⃣ Import your service datasets into Power BI
2️⃣ Connect and refresh the model regularly
3️⃣ Use slicers to filter by product, region, channel, and time
4️⃣ Monitor KPIs daily or weekly to catch problems early
5️⃣ Share reports with stakeholders for faster action
No heavy manual reporting—just refresh, analyze, and improve.
Who Can Benefit from This Consumer Electronics Service Dashboard in Power BI
This dashboard is ideal for:
🧑💼 Service Managers and Service Heads
📞 Customer Support Leaders
⚙️ Operations Managers
🏭 Electronics Manufacturers and OEMs
🔧 Repair Service Providers and Partner Networks
📦 Product Managers (quality improvement insights)
📊 Business Analysts and MIS Teams
🧠 Executive leadership teams (performance visibility)
If your team wants faster decisions, lower service costs, and higher customer satisfaction, this template delivers.
Click hare to read the Detailed blog post
Visit our YouTube channel to learn step-by-step video tutorials
Youtube.com/@PKAnExcelExpert


