In the competitive consulting landscape, data-driven insights separate successful firms from the rest. Tracking projects, managing clients, and evaluating consultant performance requires clarity, speed, and precision. That’s where the Consulting Dashboard in Power BI steps in — a ready-to-use, fully interactive analytics solution designed for consulting firms that want to make smarter, faster decisions.
Built entirely in Microsoft Power BI, this dashboard transforms complex datasets into meaningful visuals. It connects directly to your Excel files or databases, analyzes performance metrics in real time, and presents insights in clear, interactive visuals.
Whether you manage a boutique consulting firm or a large enterprise, this dashboard simplifies performance tracking — from revenue and client satisfaction to consultant productivity — all in one intuitive workspace.
📊 Key Features of the Consulting Dashboard in Power BI
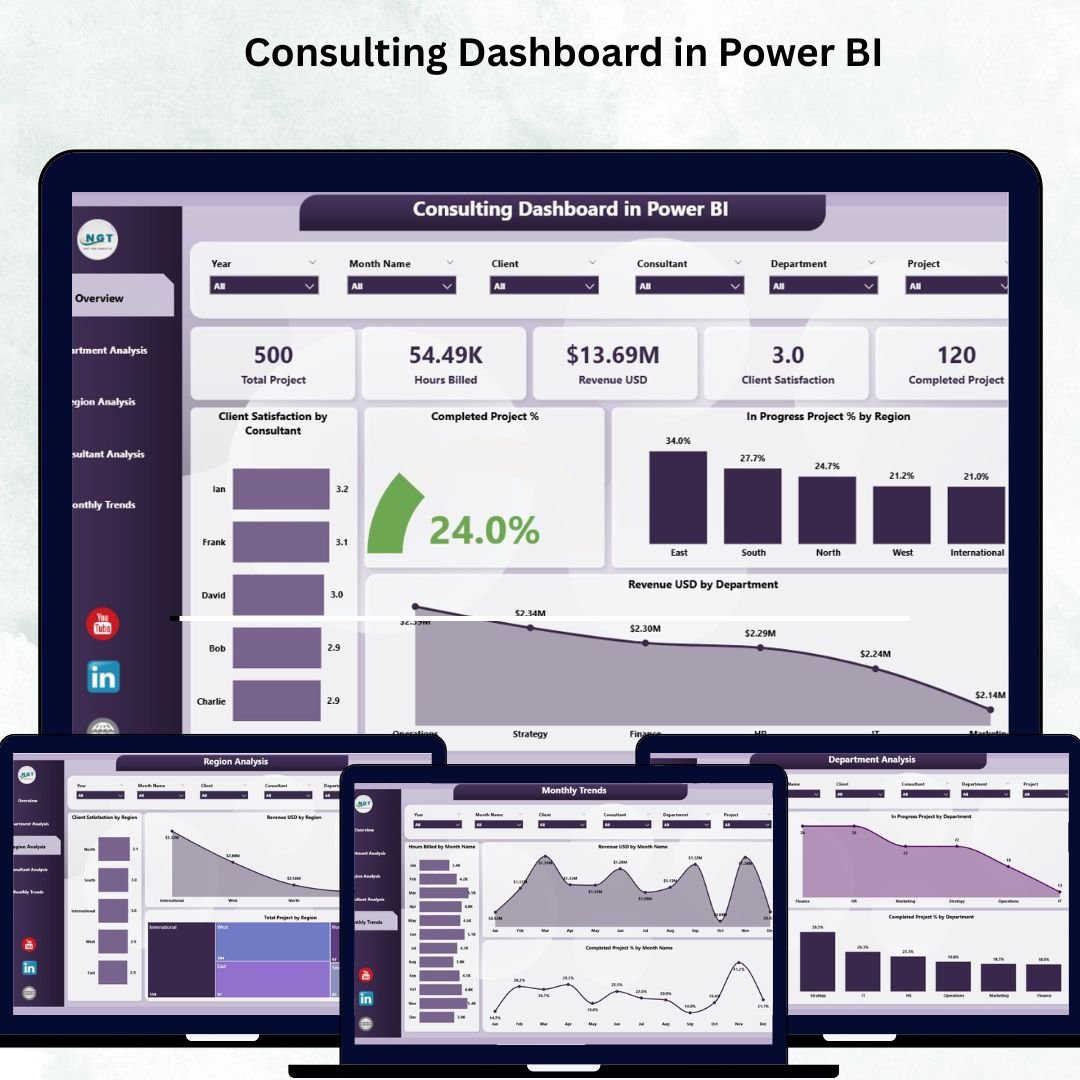
🏠 1. Overview Page – Firm-Wide Insights at a Glance
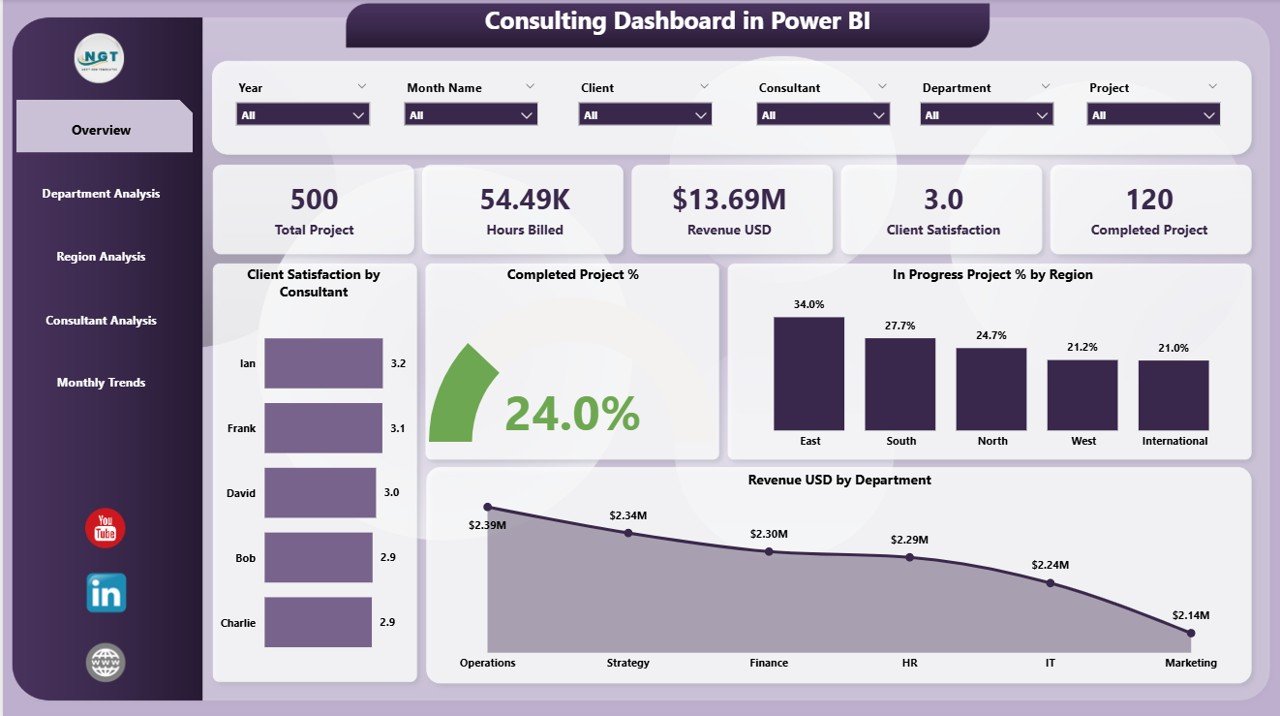
The Overview Page is the central hub for monitoring overall consulting operations.
Highlights include:
-
Five KPI Cards – Instantly view total revenue, project completion rate, client satisfaction, and more.
-
Client Satisfaction by Consultant – Evaluate consultant performance from the client’s perspective.
-
Completed Projects (%) by Region – Identify top-performing regions.
-
In-Progress Projects (%) by Region – Spot workload distribution and project backlogs.
-
Revenue (USD) by Department – Track department-wise profitability.
👉 Perfect for executives and partners who need a snapshot of business health within seconds.
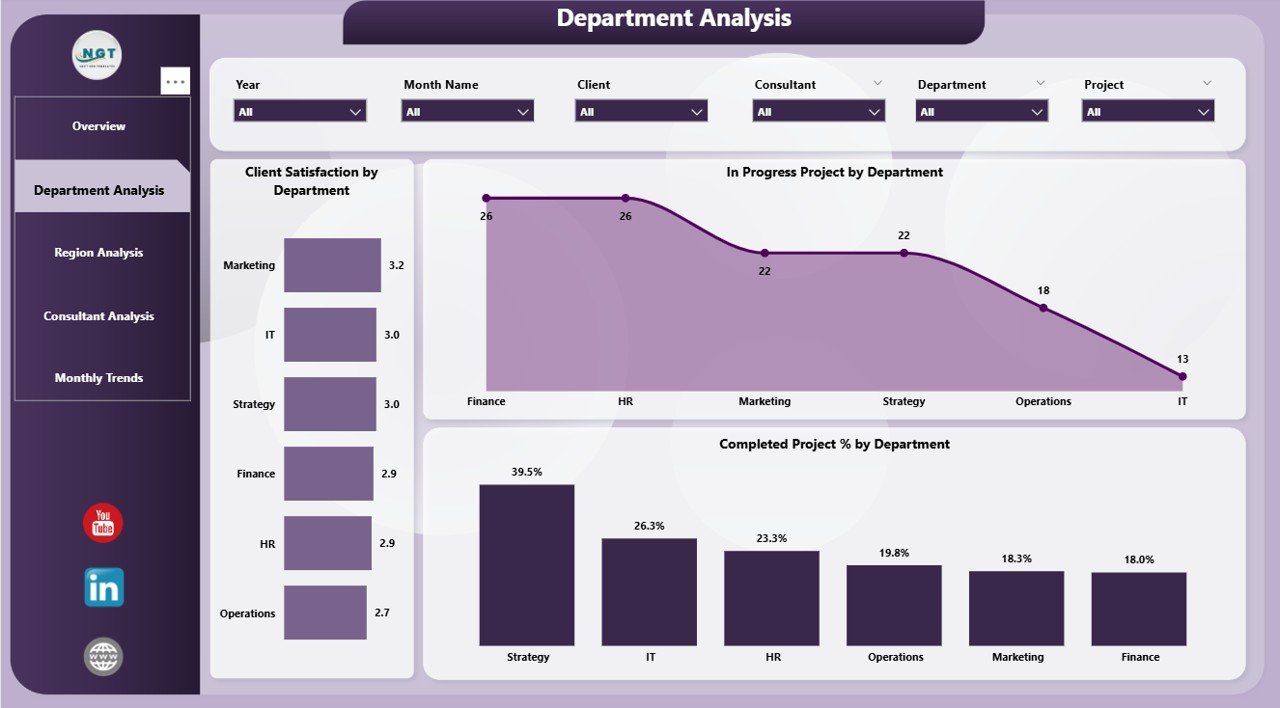
🏢 2. Department Analysis Page – Measure Team Efficiency
This page breaks down performance by department, allowing managers to identify strengths and areas for improvement.
Visuals include:
-
Client Satisfaction by Department
-
Completed Projects (%) by Department
-
In-Progress Projects by Department
📈 Use this page to balance workloads, improve project scheduling, and ensure consistent service delivery across teams.
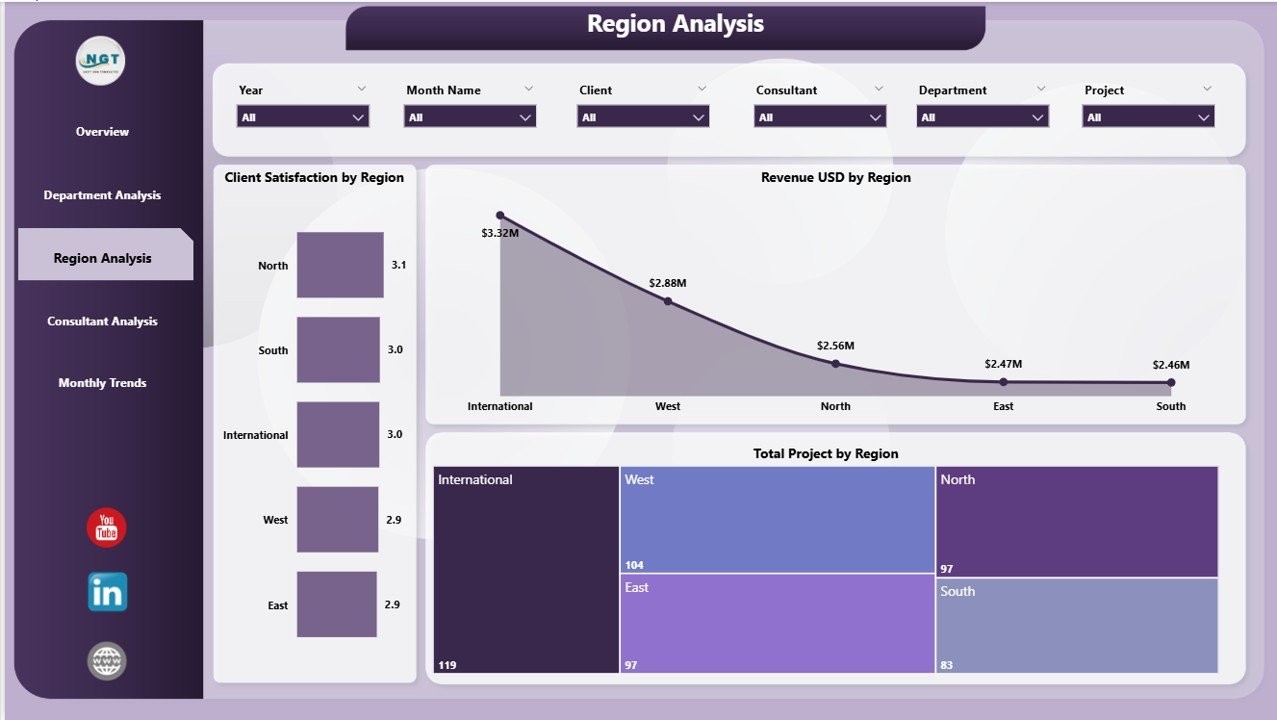
🌍 3. Region Analysis Page – Compare Regional Success
Gain a geographical perspective of your consulting operations.
Charts include:
-
Client Satisfaction by Region
-
Revenue (USD) by Region
-
Total Projects by Region
💡 Ideal for firms operating across multiple territories or branches — analyze which regions excel and where improvements are needed.
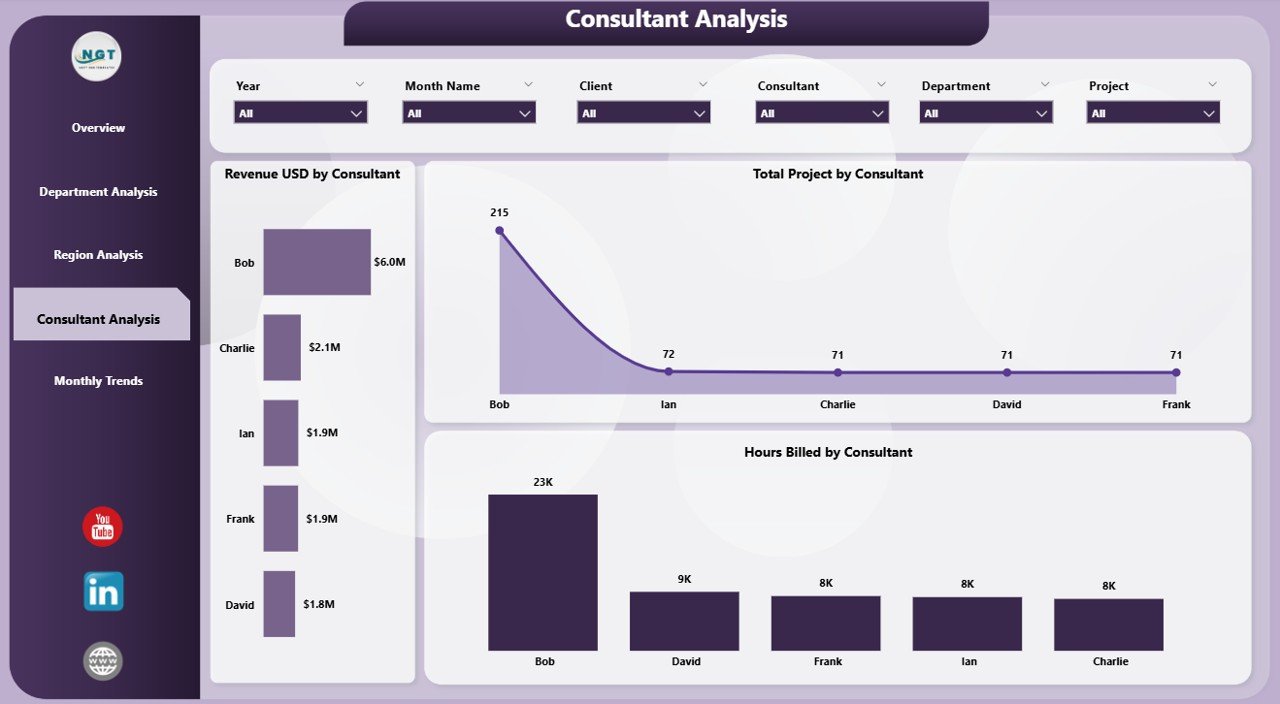
👨💼 4. Consultant Analysis Page – Evaluate Individual Performance
Drill down to the consultant level to identify top performers and those needing support.
Visuals include:
-
Revenue (USD) by Consultant
-
Total Projects by Consultant
-
Hours Billed by Consultant
🎯 Perfect for HR and leadership teams to guide promotions, training, and performance reviews.
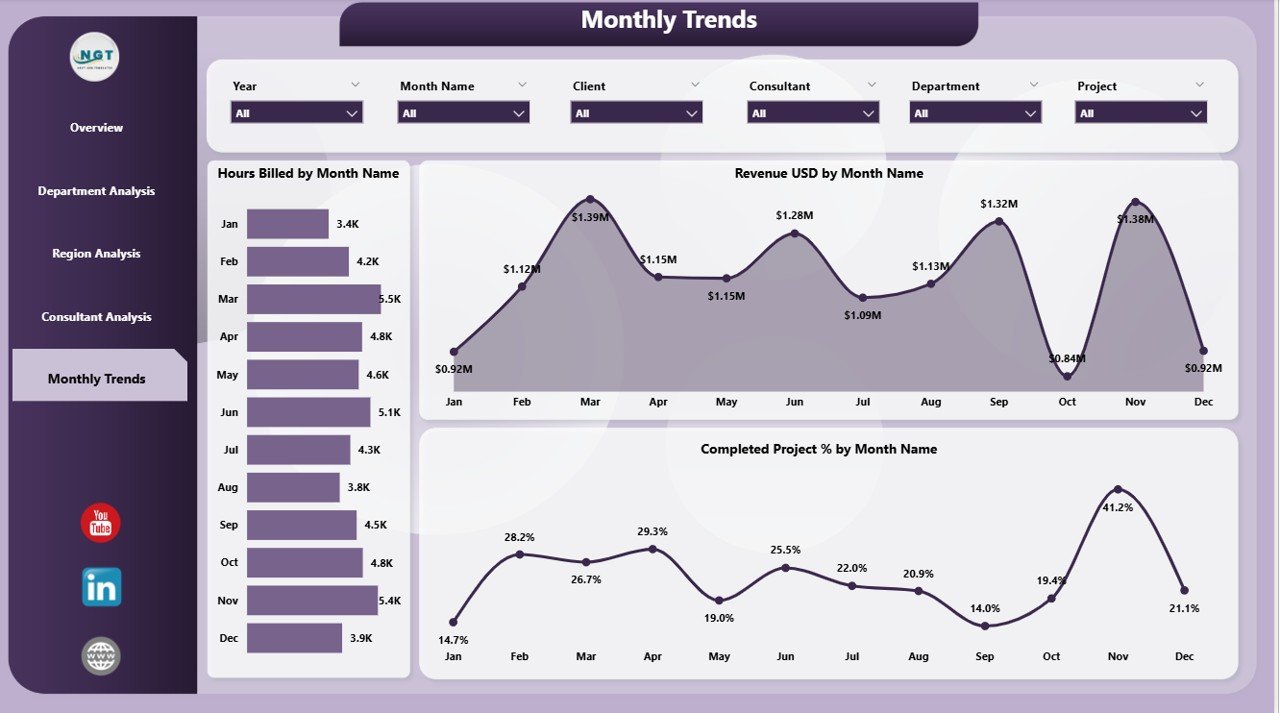
📅 5. Monthly Trends Page – Track Long-Term Growth
Understand how your consulting business evolves month by month.
Key charts:
-
Hours Billed by Month
-
Revenue (USD) by Month
-
Completed Projects (%) by Month
📊 This view enables forecasting, trend spotting, and proactive decision-making for upcoming quarters.
💡 Key Metrics Tracked
-
Total Revenue (USD)
-
Project Completion Rate (%)
-
Client Satisfaction (%)
-
Billable Hours
-
In-Progress Projects
-
Departmental Revenue
-
Regional Contribution
These KPIs deliver a comprehensive, data-backed understanding of firm performance.
🚀 Advantages of Using the Consulting Dashboard in Power BI
✅ Real-Time Data Visualization: Always stay updated with live metrics from your connected Excel or database.
✅ Centralized Management: Unify all consulting data — projects, clients, consultants — in one dashboard.
✅ Enhanced Productivity: Consultant and department performance metrics drive accountability and focus.
✅ Client Relationship Insights: Identify satisfaction trends and address issues before they impact business.
✅ Customizable & Scalable: Modify visuals, filters, and KPIs to suit your firm’s goals.
✅ Professional Presentation: Use Power BI’s interactive visuals to present reports with clarity and impact.
🧭 How to Use the Dashboard
1️⃣ Connect your Excel or database to Power BI.
2️⃣ Load your consulting data — projects, hours, revenue, satisfaction scores.
3️⃣ Refresh the data to update all visuals automatically.
4️⃣ Use slicers to analyze by region, department, or consultant.
5️⃣ Drill down into details for deeper insights.
6️⃣ Publish and share dashboards securely via Power BI Service.
No advanced technical skills required — just plug in your data and start analyzing instantly!
⚙️ Who Can Benefit
-
Consulting Firm Owners – Monitor financial performance and client satisfaction.
-
Department Heads – Optimize workload distribution and team efficiency.
-
Consultants – Track personal performance metrics.
-
Business Analysts – Generate quick insights for leadership.
-
Executives & Partners – Make informed strategic decisions.
Whether you’re managing management consulting, IT consulting, HR, or finance advisory — this dashboard adapts seamlessly.
🌟 Why Choose the Consulting Dashboard in Power BI
💼 5 Interactive Pages with Dynamic Filters
📈 Real-Time KPI Tracking
📊 Visual Revenue, Client, and Performance Insights
⚙️ Fully Customizable & Easy to Use
🔐 Secure Sharing via Power BI Service
🧠 No Coding or Add-ins Required
This dashboard turns raw consulting data into actionable intelligence — helping your firm stay agile, data-driven, and client-focused.
📺 Watch a Step-by-Step Tutorial:
👉 YouTube.com/@PKAnExcelExpert


Reviews
There are no reviews yet.