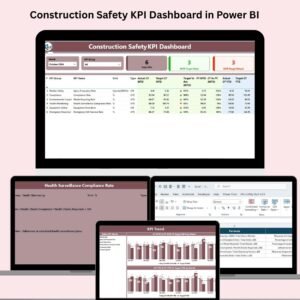
In the construction world, safety isn’t just a metric—it’s a mission. With so many moving parts across teams, locations, and vendors, keeping everyone safe requires more than just spreadsheets or static reports. That’s why we created the Construction Safety KPI Dashboard in Power BI — a powerful, ready-to-use analytics tool that transforms safety tracking into a real-time, data-driven experience. 🛠️📊
Designed for safety managers, project leaders, and operations executives, this dashboard connects directly to Excel and delivers clear visual insights into your safety KPIs. It highlights what’s working, flags what’s not, and helps you take action—faster.
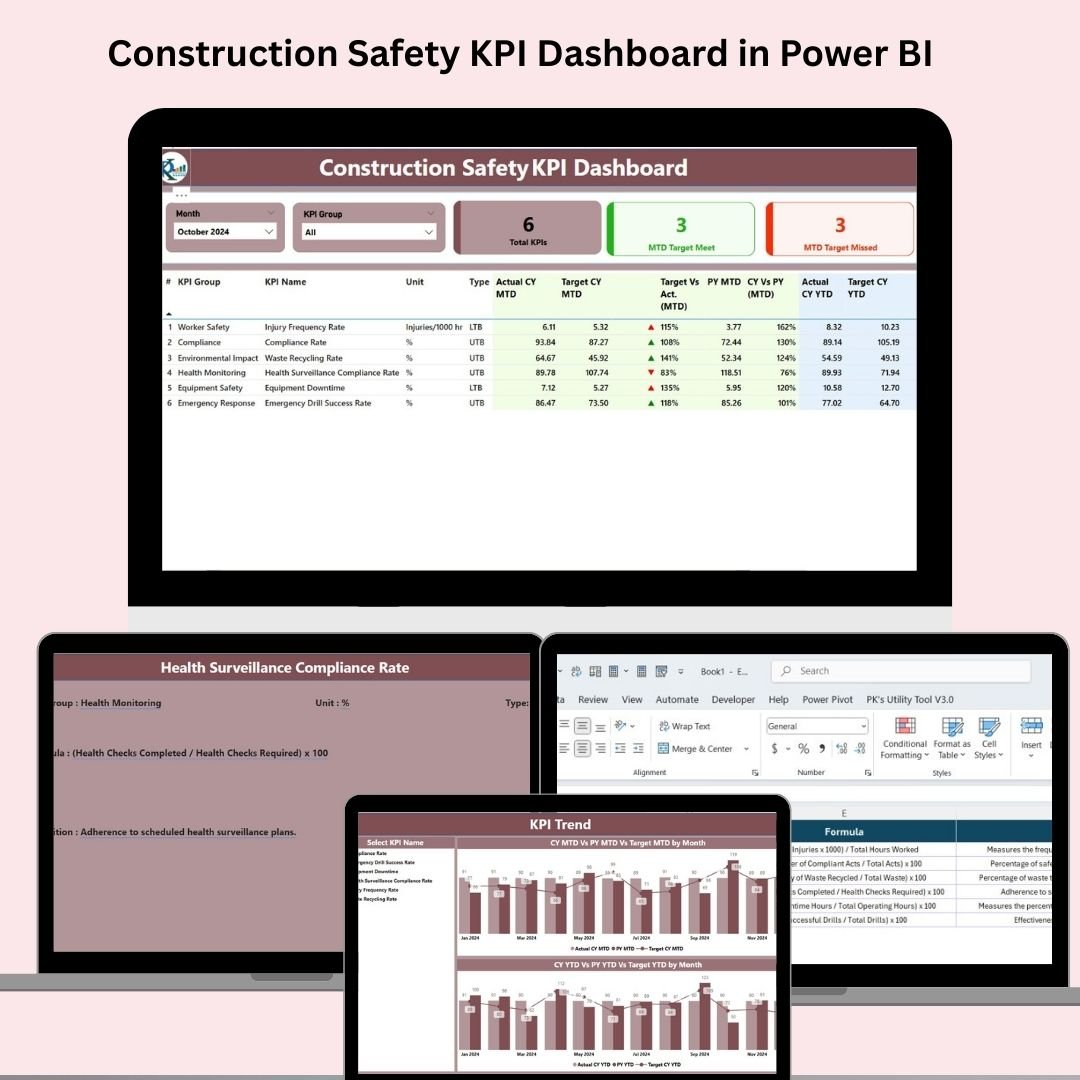
✨ Key Features of Construction Safety KPI Dashboard
📋 Summary Page Overview

-
🔍 Filter by Month and KPI Group
-
🎯 View Total KPIs, MTD Targets Met, and Missed
-
📈 Detailed KPI Table with:
-
KPI Number, Group, and Name
-
MTD/YTD Actuals vs. Targets
-
Performance Icons (Green ▲ / Red ▼)
-
Comparisons with Previous Year Data
-
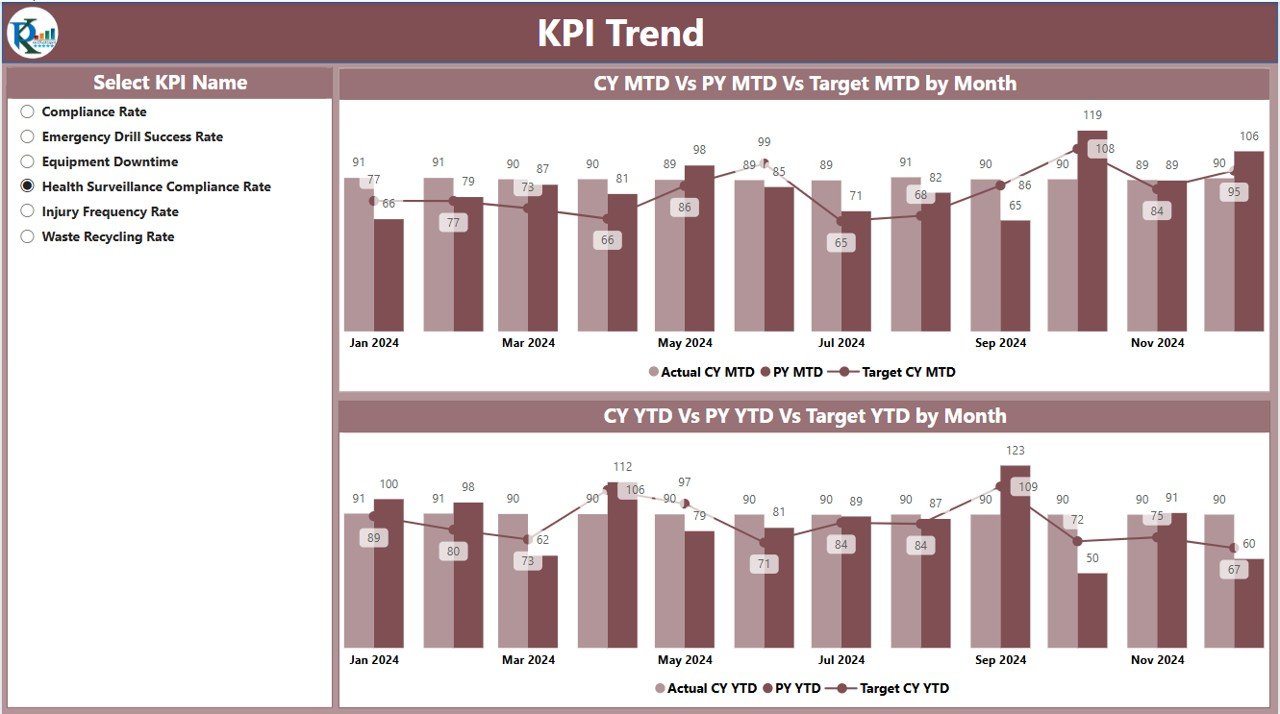
📊 KPI Trend Page
-
Dual Combo Charts for MTD and YTD trends
-
Analyze Actuals vs. Targets vs. Previous Year
-
Select specific KPIs for deeper performance insights
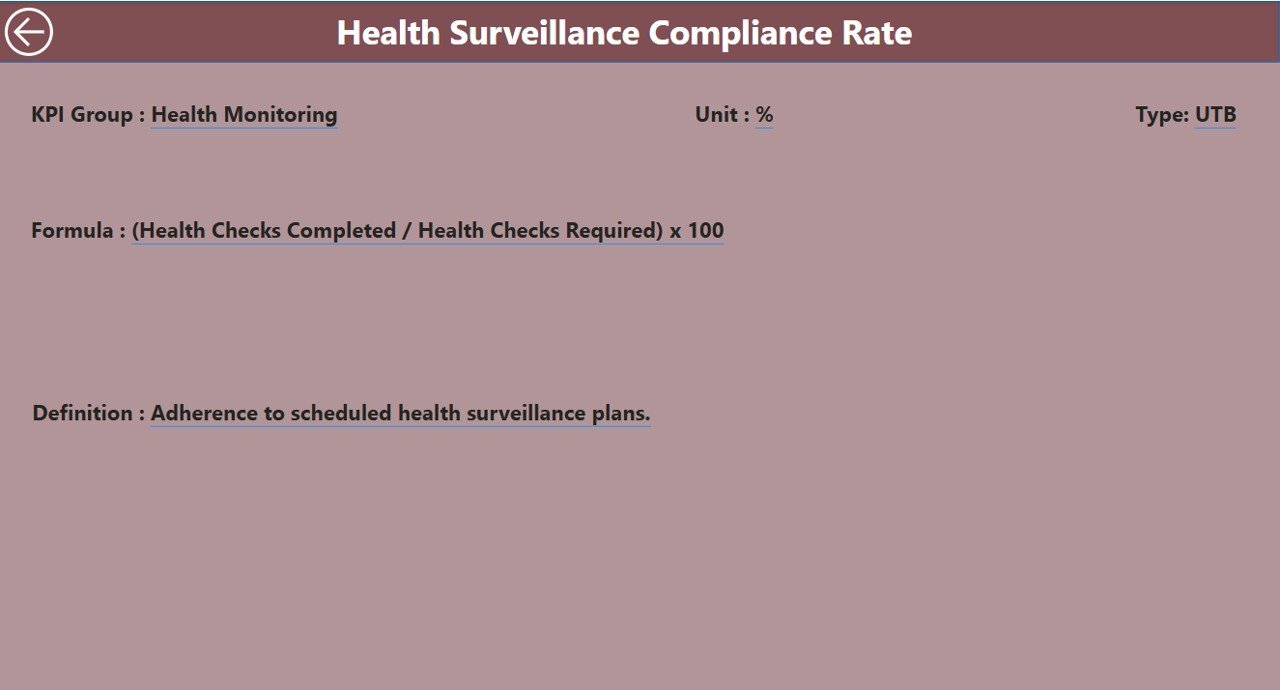
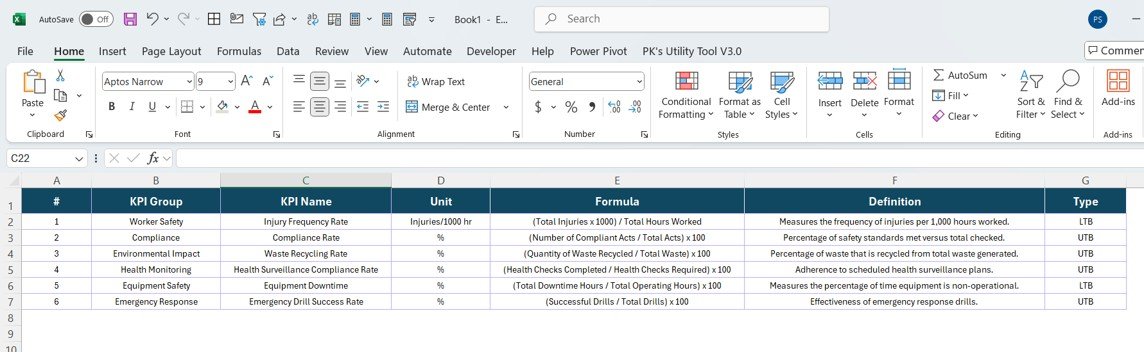
📘 KPI Definition Page (Drill-Through Enabled)
-
Right-click any KPI to view:
-
Definition
-
Formula
-
Unit
-
KPI Type (LTB/UTB)
-
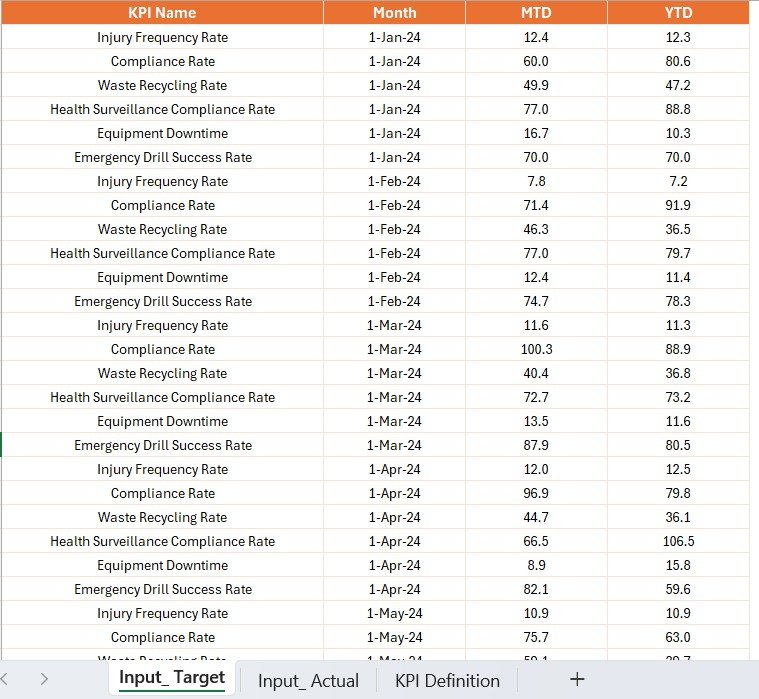
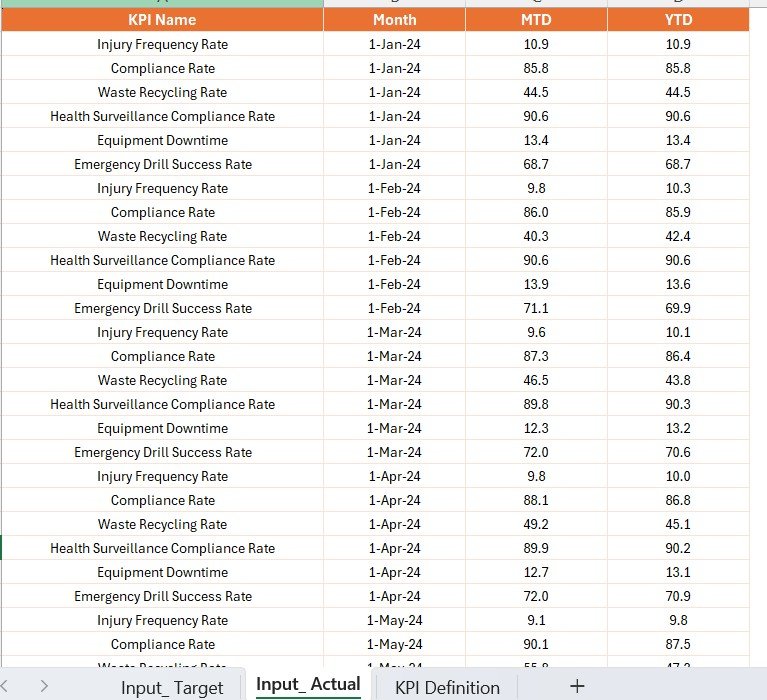
🧾 Excel Data Integration
Connects to 3 Excel sheets:
-
Input_Actual – Monthly KPI actuals (MTD & YTD)
-
Input_Target – Benchmark goals (MTD & YTD)
-
KPI_Definition – KPI metadata (formulas, types, units)
No need to edit Power BI manually—just update Excel and refresh!
📂 What’s Inside the Dashboard?
This Power BI dashboard comes with:
-
3 Fully Functional Pages – Summary, KPI Trends, and Definitions
-
Interactive Slicers – Focus on specific KPI Groups or Months
-
Drill-Through Actions – Click a KPI to view its full context
-
Excel-Driven Updates – All your data managed in one source
-
Built-in Status Icons – Quickly identify underperforming areas
Every visual is optimized to give you fast, focused, and actionable insights.
🛠️ How to Use the Construction Safety Dashboard
📌 Step 1: Open the Excel source and update Actuals and Targets
📌 Step 2: Launch Power BI and click Refresh
📌 Step 3: Use the slicers to filter by month and KPI group
📌 Step 4: Click on any KPI to drill into definitions and trend charts
📌 Step 5: Share the report internally or publish to Power BI Service
It’s fully functional—right out of the box!
👷 Who Can Benefit from This Product?
This dashboard is ideal for:
✅ Safety Managers – Monitor incidents, injuries, near-misses, and compliance
✅ Project Managers – Track jobsite safety performance
✅ Executives – Review high-level safety KPIs across multiple sites
✅ Contractors – Evaluate vendor safety and site-specific risk metrics
✅ Compliance Officers – Prepare reports for internal reviews or audits
No Power BI expertise? No problem. This template is beginner-friendly but built with professionals in mind.
🔗 Click here to read the Detailed blog post
🎥 Visit our YouTube channel to learn step-by-step video tutorials


Reviews
There are no reviews yet.