Community management has become a powerful strategy for modern organizations. Whether businesses manage online communities, social media groups, brand forums, or customer discussion platforms, strong community engagement helps build trust, strengthen brand loyalty, and improve customer satisfaction.
However, many organizations struggle to measure the success of their community activities. Teams often depend on scattered reports, social media analytics tools, or manual tracking methods. As a result, it becomes difficult to understand whether community engagement efforts are truly driving growth and customer loyalty.
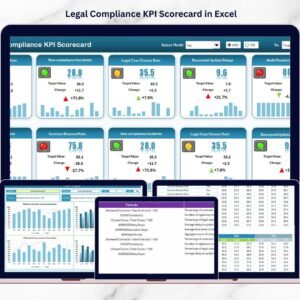
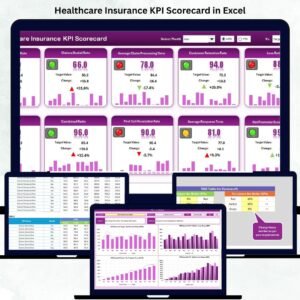
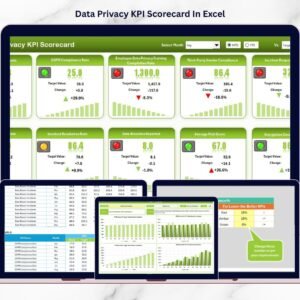
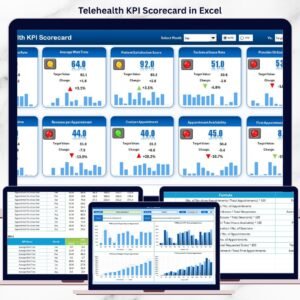
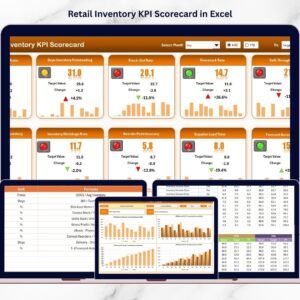
The Community Management KPI Scorecard in Excel provides a structured and powerful solution. This ready-to-use Excel scorecard allows organizations to track key community management KPIs, compare actual performance with targets, analyze engagement trends, and improve community strategies.
Instead of reviewing multiple reports, community managers can monitor all critical metrics in a single centralized Excel scorecard. With automated calculations, visual indicators, and interactive trend analysis, the template helps organizations measure the true impact of community initiatives.
📊 Key Features of Community Management KPI Scorecard in Excel
📈 Centralized KPI Monitoring
Track all important community management KPIs in a single structured Excel scorecard.
📅 Flexible Month Selection
Select the month to instantly analyze performance metrics for a specific period.
📊 MTD and YTD Performance Analysis
Monitor both Month-To-Date (MTD) and Year-To-Date (YTD) performance metrics.
🎯 Target vs Actual Comparison
Compare actual community performance with defined targets to evaluate success.
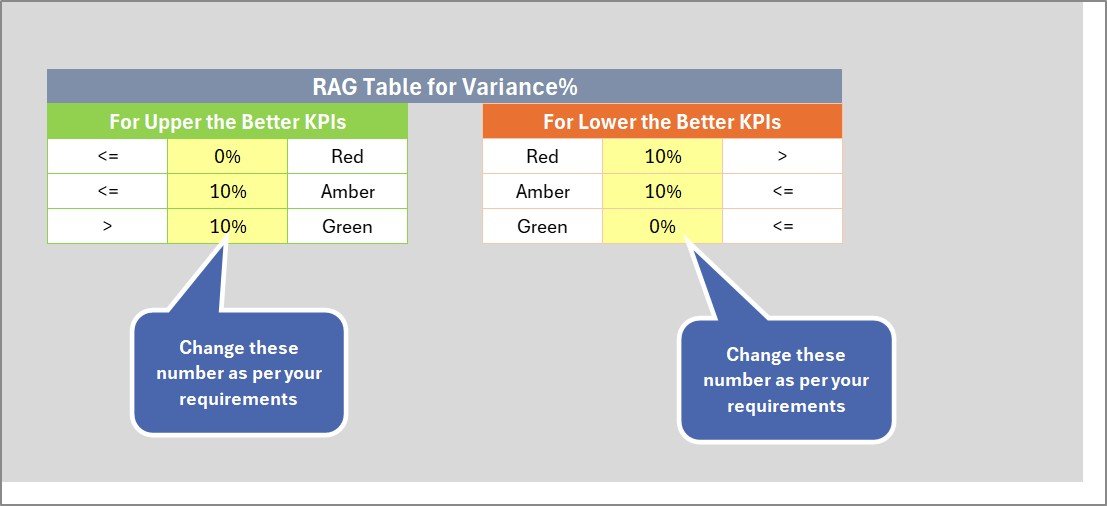
📉 Performance Status Indicators
Conditional formatting and color indicators highlight strong and weak performance.
📊 Automated KPI Calculations
Excel formulas automatically update KPI performance results.
📈 Trend Analysis Charts
Analyze KPI trends through visual MTD and YTD trend charts.
📋 Structured KPI Data Management
Store KPI definitions, formulas, and units in a centralized sheet.
📊 Interactive KPI Selection
Users can select any KPI from the dropdown to analyze detailed performance.
💻 Fully Excel-Based Template
Works directly in Microsoft Excel without requiring additional software.
📦 What’s Inside the Community Management KPI Scorecard in Excel
This ready-to-use Excel template includes four structured worksheets designed for comprehensive community performance monitoring.
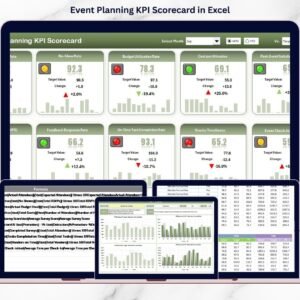
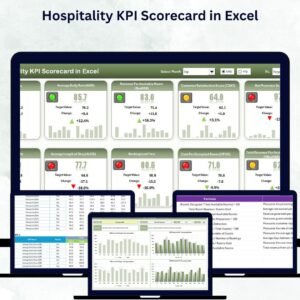
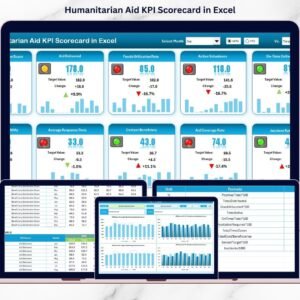
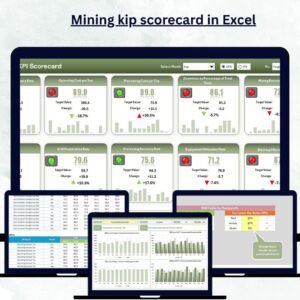
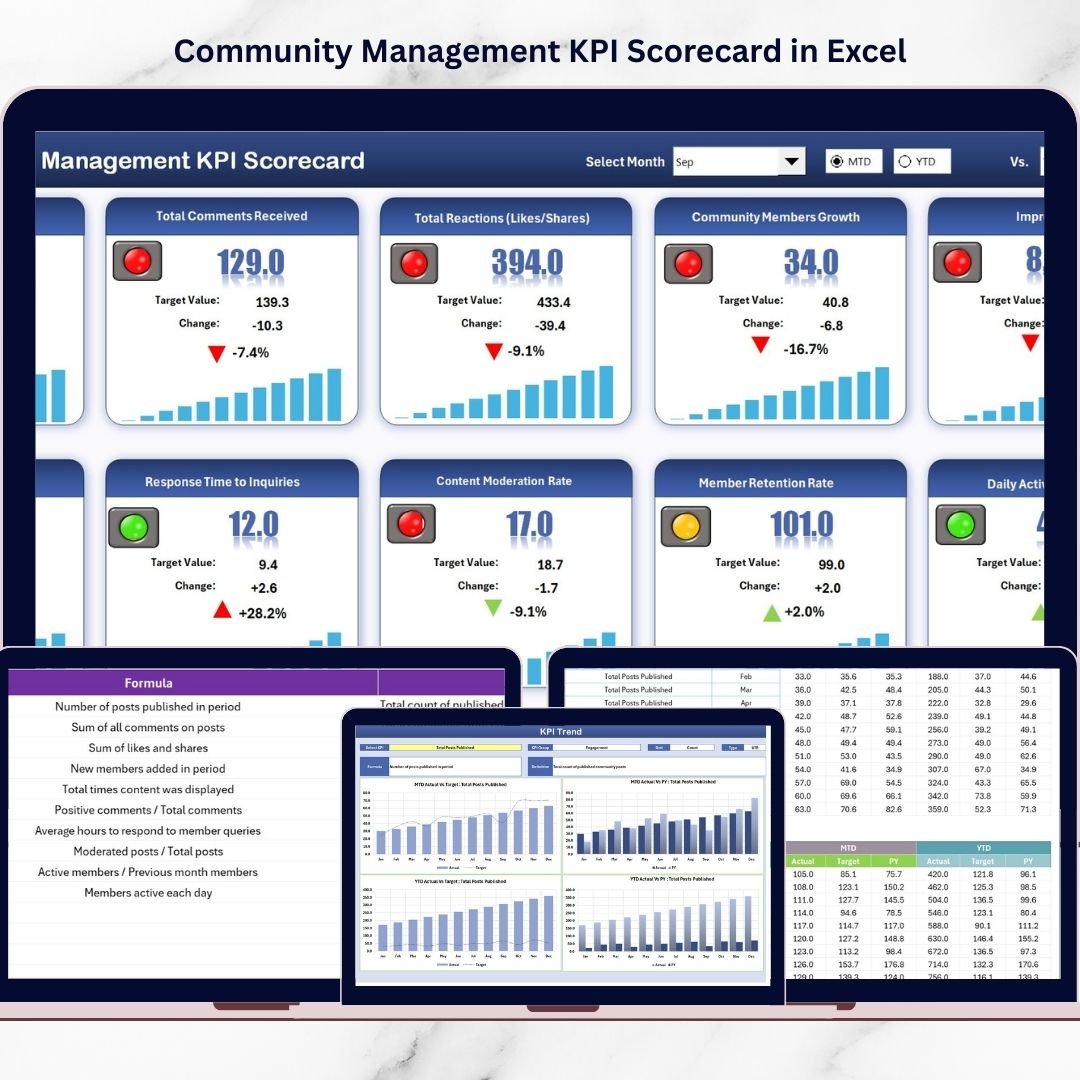
1️⃣ Scorecard Sheet (Main KPI Dashboard)
The Scorecard Sheet serves as the main dashboard of the template.
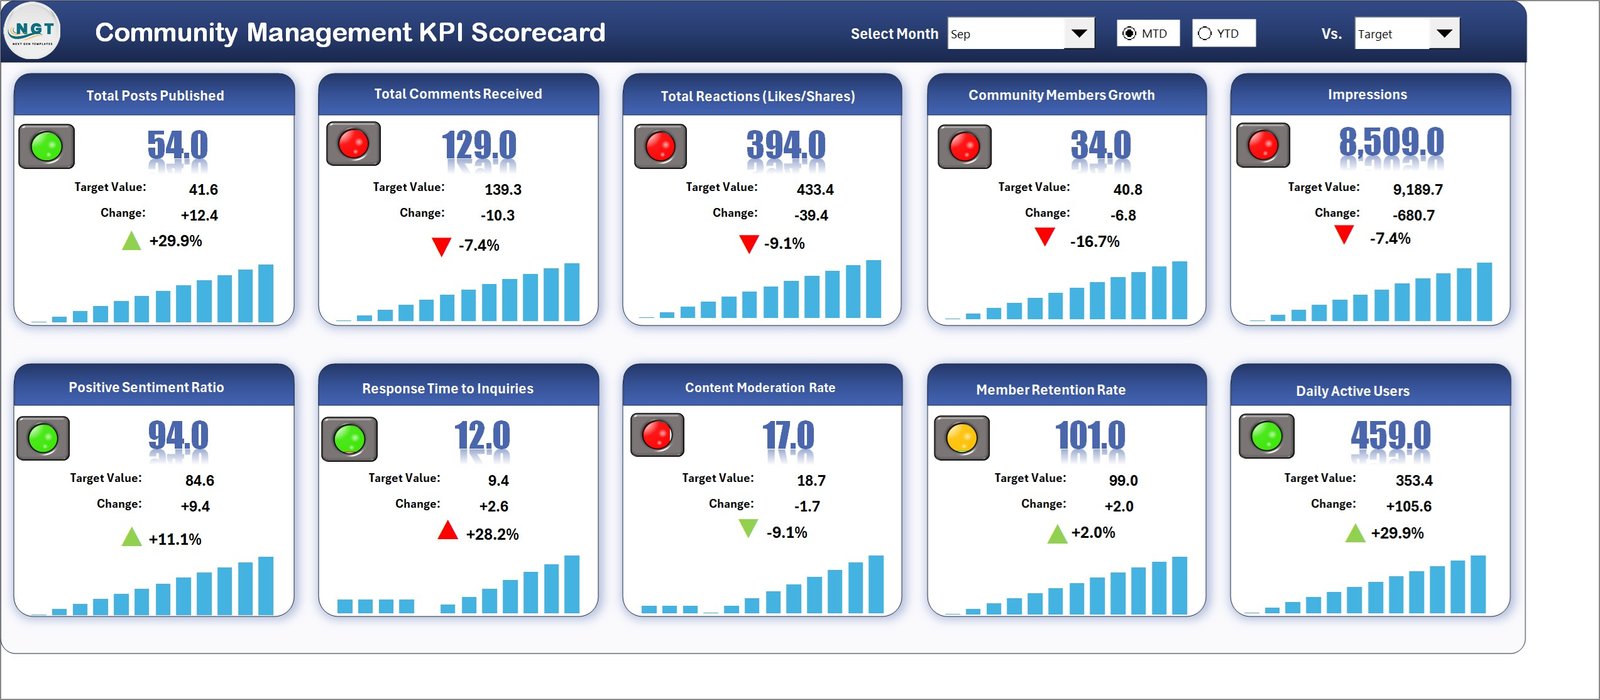
It provides a high-level overview of community management performance across all KPIs.
Key features include:
-
Month selection dropdown
-
MTD performance analysis
-
YTD performance analysis
-
Actual vs Target comparison
-
Conditional formatting indicators
The scorecard displays detailed KPI information such as:
-
KPI Name
-
KPI Group
-
Actual values
-
Target values
-
MTD performance
-
YTD performance
Visual indicators highlight whether KPIs are performing well or require improvement.
This allows community managers to quickly identify performance gaps.
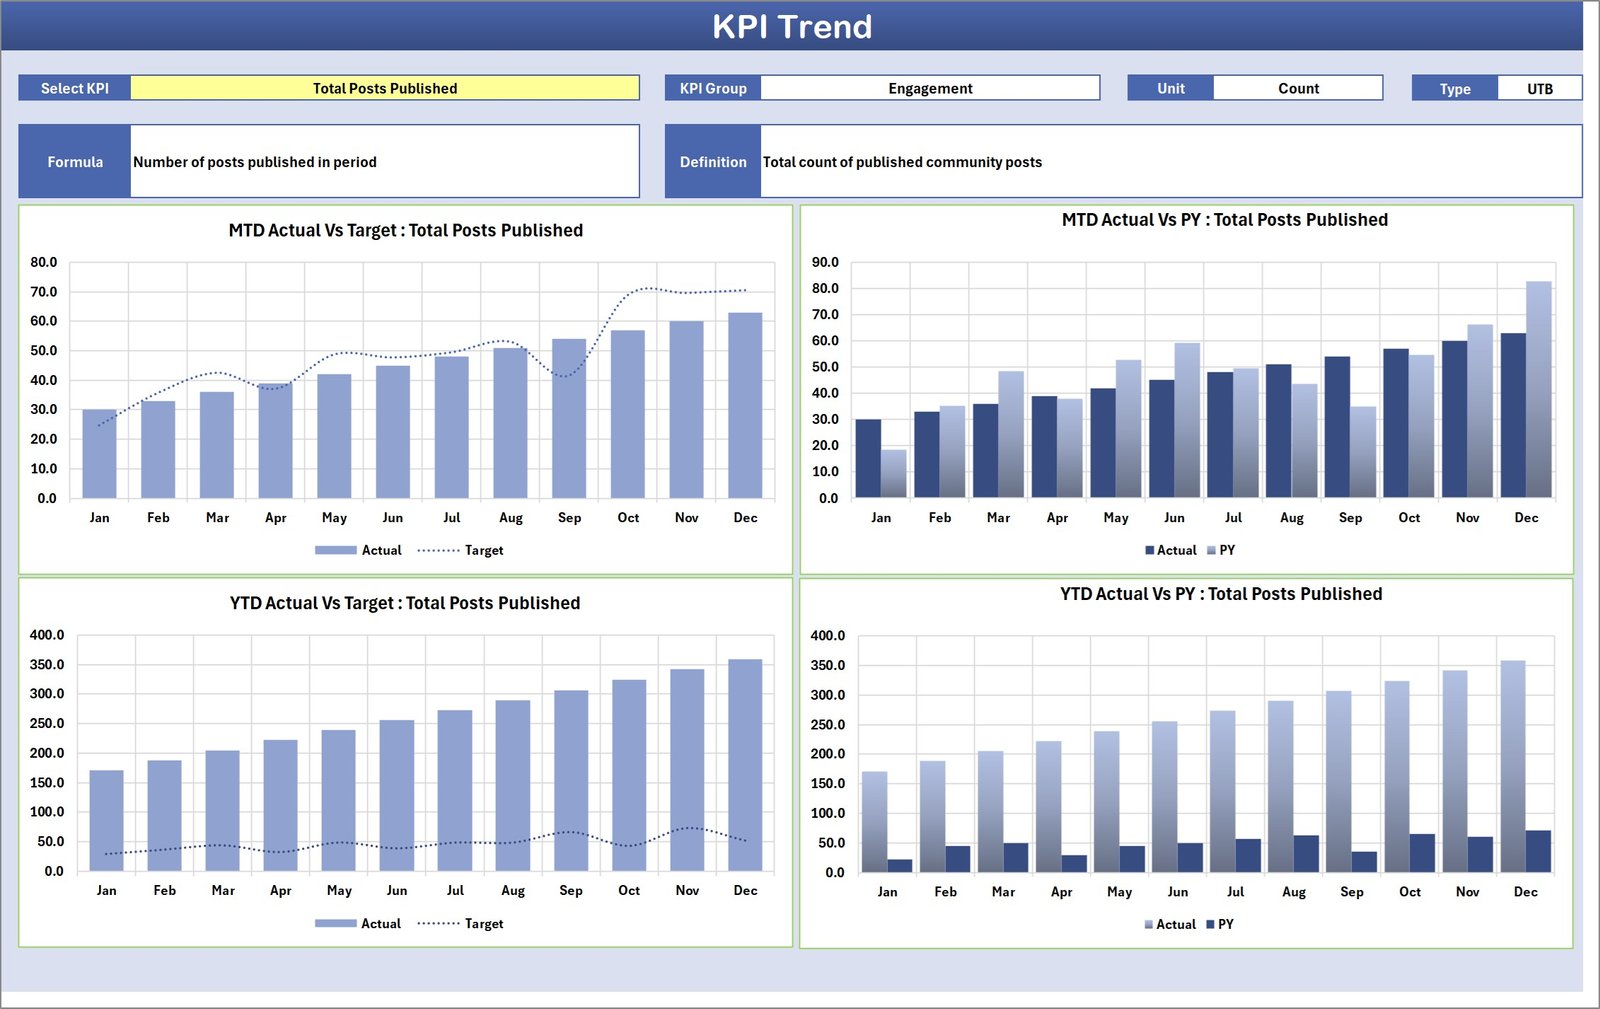
2️⃣ KPI Trend Sheet
The KPI Trend Sheet helps users analyze performance trends for individual KPIs.
Users can select the KPI name from the dropdown located in cell C3.
Once selected, the sheet displays detailed KPI information including:
-
KPI Group
-
Unit of measurement
-
KPI type (Upper the Better or Lower the Better)
-
KPI formula
-
KPI definition
Two powerful charts help visualize performance trends:
📈 MTD Trend Chart – Displays monthly performance comparisons between actual, target, and previous year values.
📊 YTD Trend Chart – Shows cumulative yearly performance trends.
These charts help managers evaluate community performance patterns over time.
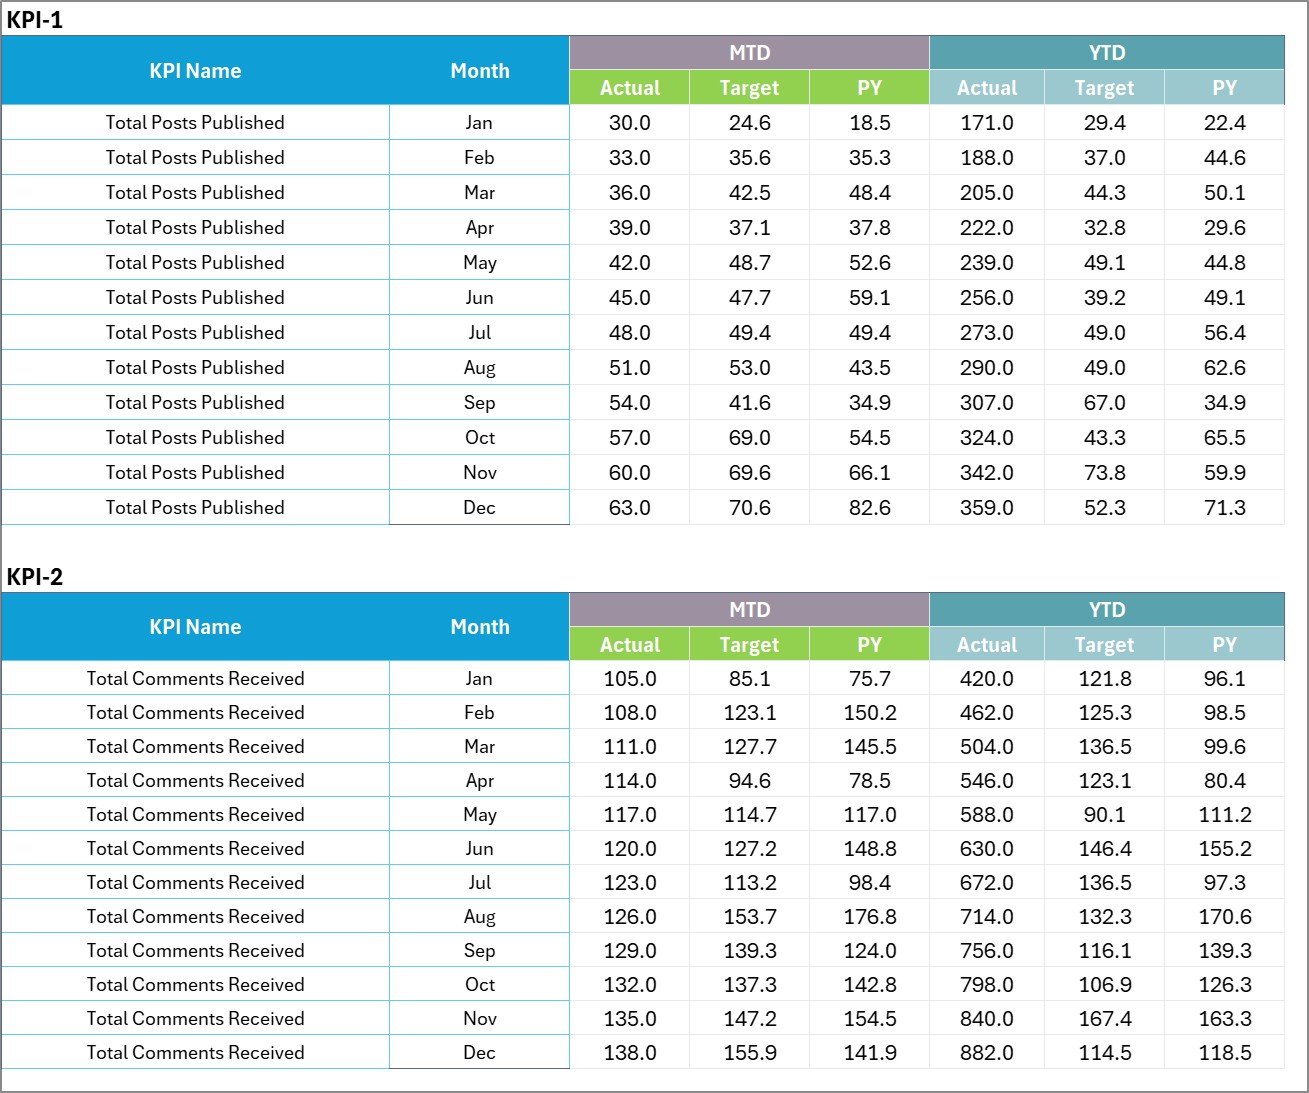
3️⃣ Input Data Sheet
The Input Data Sheet is the main data entry sheet.
Users must enter KPI performance data in this sheet.
This includes:
-
Actual KPI values
-
Target KPI values
-
Performance metrics
Because the scorecard automatically connects to this sheet, updating data instantly refreshes the entire dashboard.
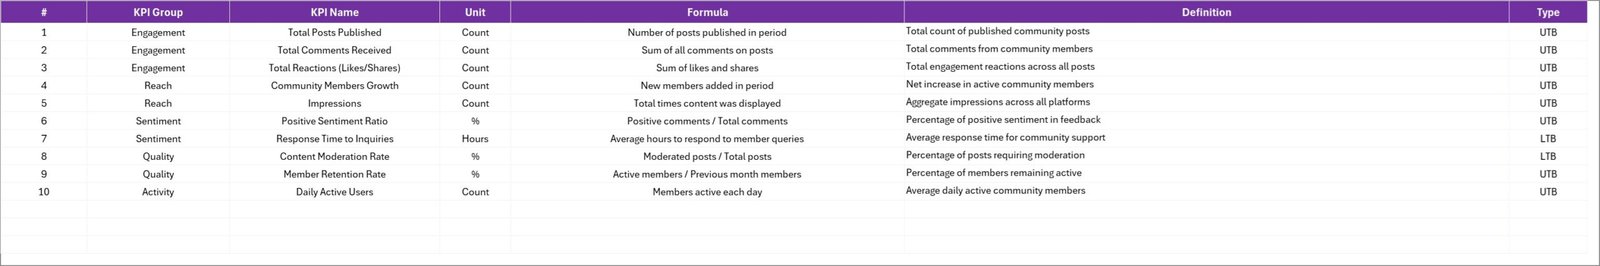
4️⃣ KPI Definition Sheet
The KPI Definition Sheet acts as the master reference for all KPIs used in the scorecard.
Users must define each KPI clearly.
The sheet stores important KPI information including:
-
KPI Name
-
KPI Group
-
Unit of measurement
-
KPI formula
-
KPI definition
This centralized structure ensures consistency and clarity when monitoring KPIs.
⚙️ How to Use the Community Management KPI Scorecard in Excel
Using this template is simple and efficient.
Step 1 – Define KPIs
Enter KPI names, formulas, and definitions in the KPI Definition Sheet.
Step 2 – Input KPI Data
Enter actual performance values and targets in the Input Data Sheet.
Step 3 – Select the Month
Choose the desired month from the dropdown in the Scorecard Sheet.
Step 4 – Analyze Performance
Review KPI performance indicators and target comparisons.
Step 5 – Monitor Trends
Use the KPI Trend Sheet to analyze MTD and YTD performance trends.
With these steps, organizations can monitor community performance quickly and make informed decisions.
👥 Who Can Benefit from This Community Management KPI Scorecard
This KPI scorecard is ideal for professionals responsible for managing community engagement and customer interaction.
📊 Community Managers
📣 Social Media Managers
📈 Digital Marketing Teams
💼 Brand Management Teams
📊 Customer Experience Managers
🏢 Online Community Moderators
📉 Marketing Analysts
📊 Customer Engagement Teams
These professionals can use the scorecard to track engagement performance, monitor community growth, and improve customer relationships.
By regularly monitoring KPIs, organizations can strengthen community engagement and build stronger brand loyalty.
Click hare to read the Detailed blog post
Visit our YouTube channel to learn step-by-step video tutorials
https://Youtube.com/@PKAnExcelExpert