
Managing commodities trading performance is never easy. Prices fluctuate constantly, margins stay thin, and risk exposure changes every day. When performance data sits across multiple Excel sheets or manual reports, decision-making slows down and opportunities slip away.
That is exactly why the Commodities Trading KPI Dashboard in Excel is designed—to give traders, analysts, and management teams instant clarity, real-time insights, and confident control over trading performance.
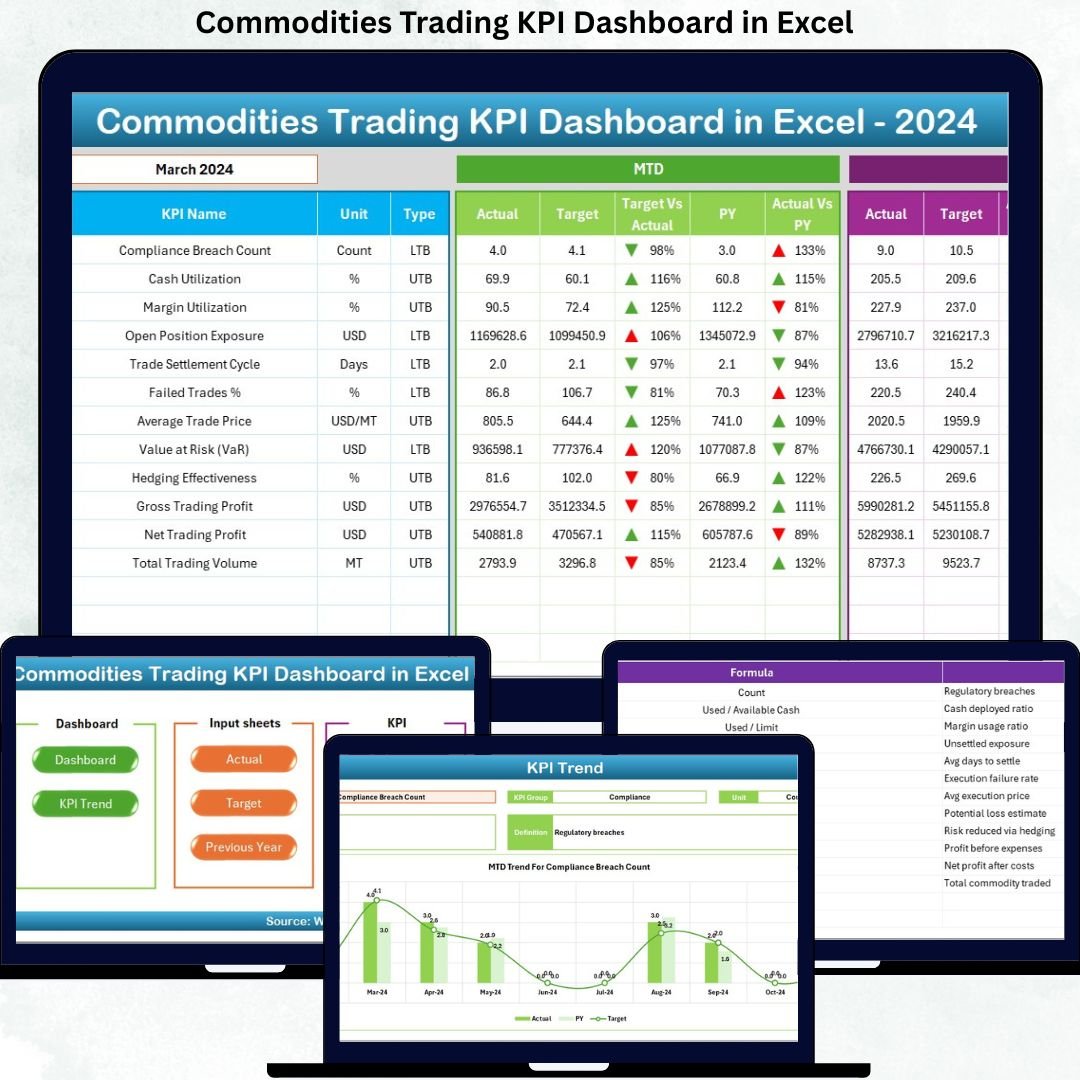
This ready-to-use Excel dashboard converts complex trading data into clear KPIs, trend analysis, and variance insights. Instead of spending hours compiling reports, you can monitor MTD and YTD performance, compare Actual vs Target, and track year-over-year results from one powerful dashboard.
Built entirely in Excel, this solution eliminates the need for expensive BI tools while delivering professional-grade analytics in a familiar environment.
🚀 Key Features of the Commodities Trading KPI Dashboard in Excel
📊 Centralized KPI Monitoring
Track all critical trading KPIs in one structured dashboard without switching between files.
📅 Dynamic Month Selection
Select any month from a drop-down, and the entire dashboard updates instantly.
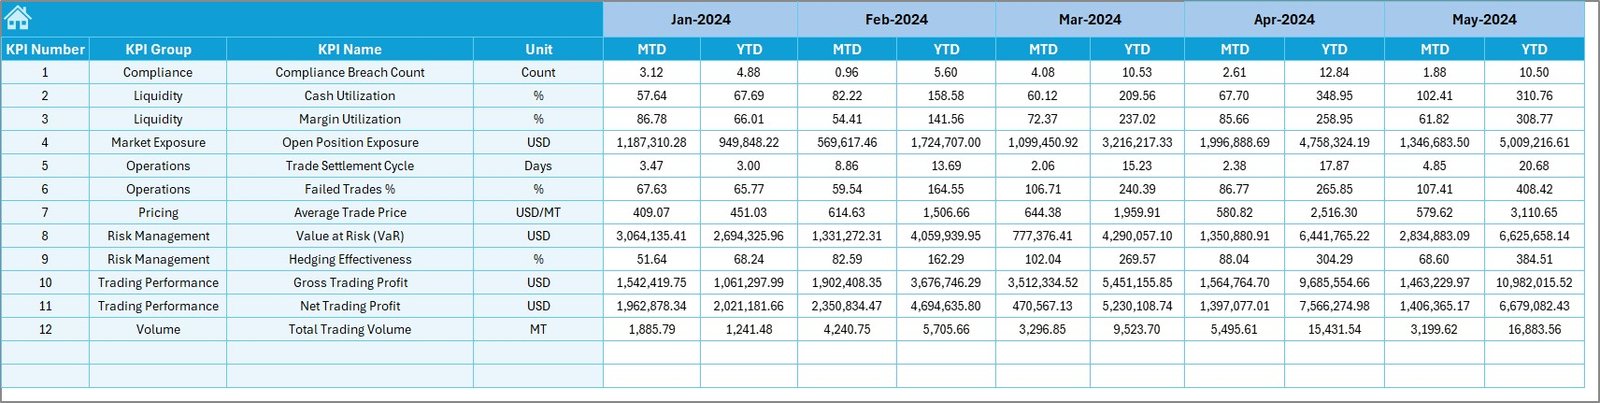
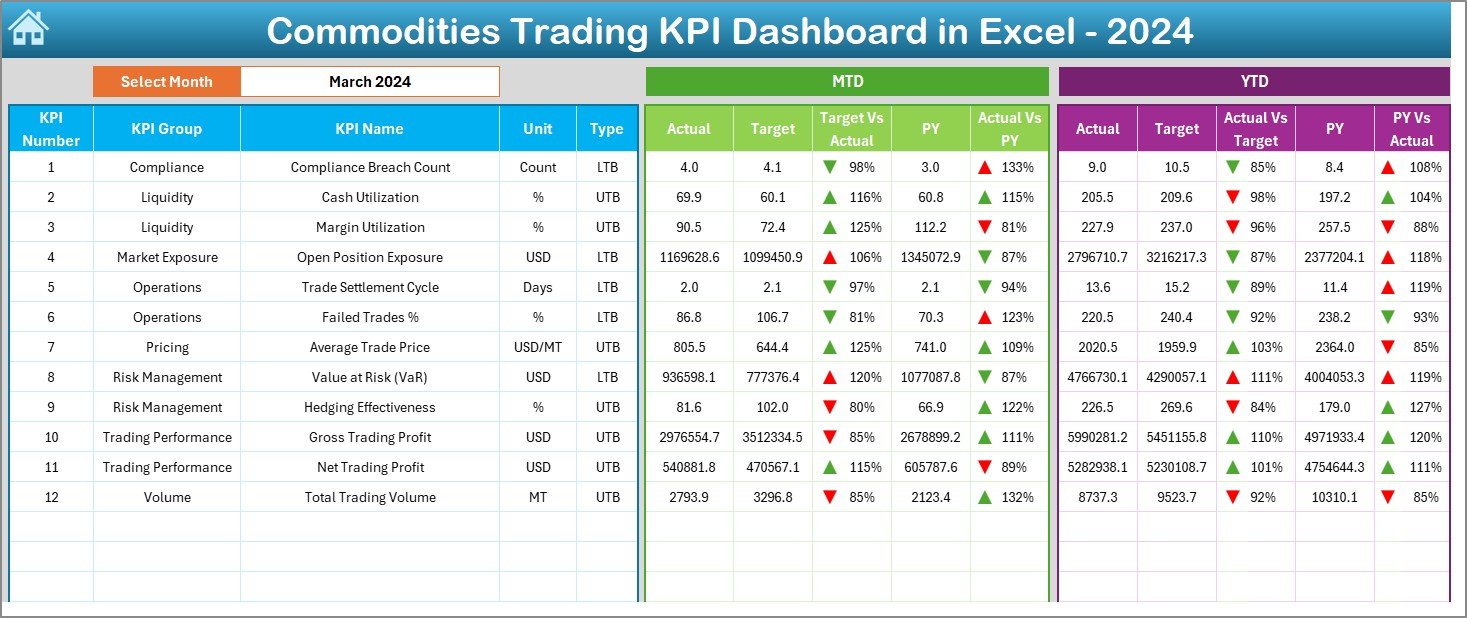
📈 MTD & YTD Performance Tracking
Analyze Month-to-Date and Year-to-Date Actuals, Targets, and Previous Year values side by side.
🔁 Target vs Actual & PY Comparison
Instantly identify overperformance or underperformance using automated variance calculations.
⬆️⬇️ Conditional Formatting Indicators
Up and down arrows visually highlight positive and negative performance trends.
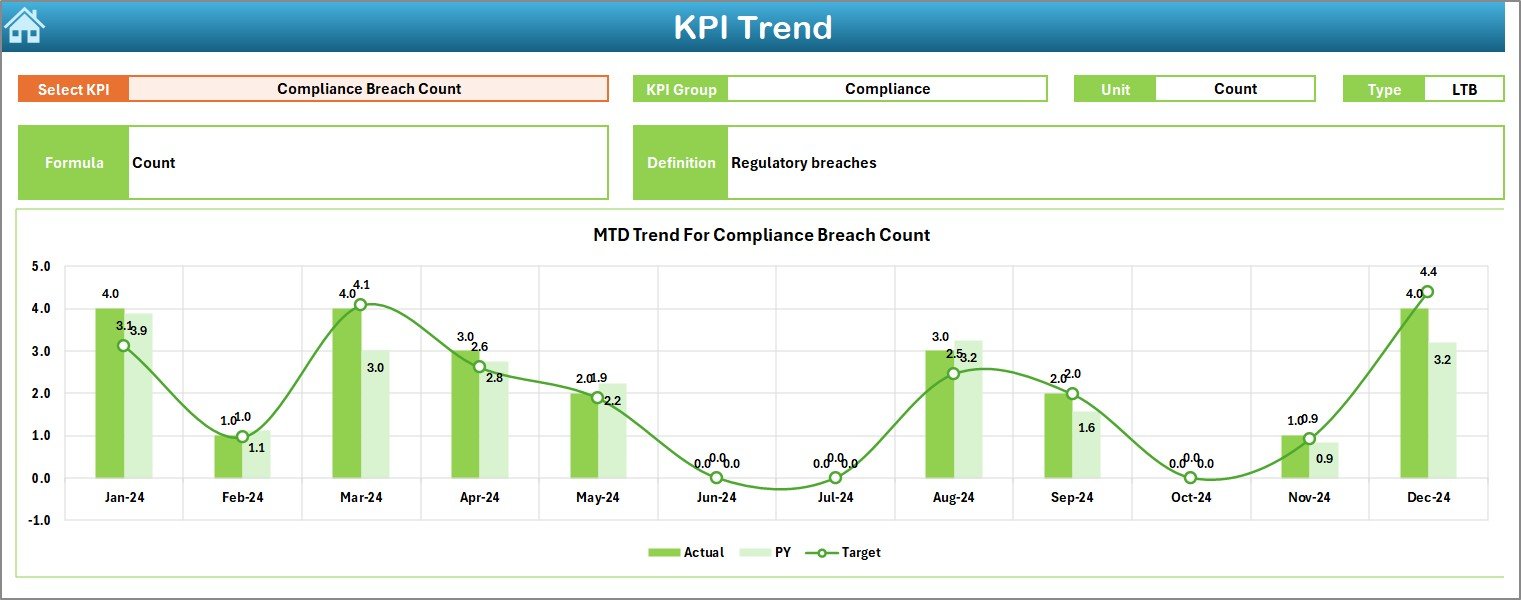
📉 Trend Analysis by KPI
Monitor KPI movement over time using clean and easy-to-read trend charts.
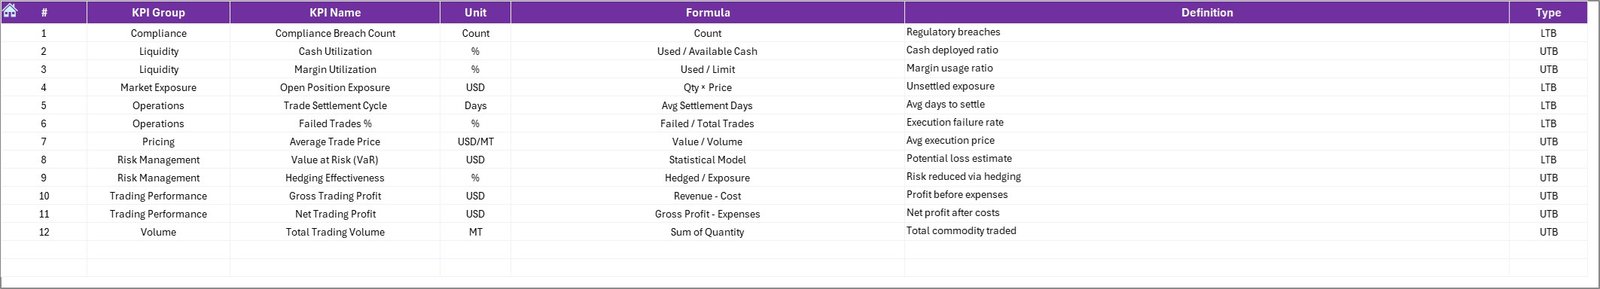
📘 Standardized KPI Definitions
Ensure everyone understands KPIs clearly with documented formulas and definitions.
📦 What’s Inside the Commodities Trading KPI Dashboard in Excel
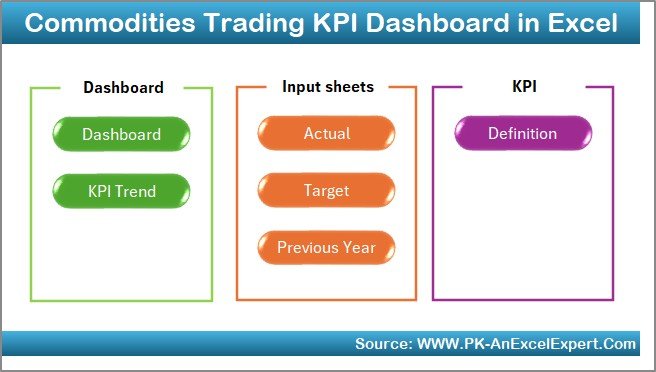
🧭 Summary Page (Index Sheet)
Quick navigation buttons allow instant access to all dashboard sections.
📊 Dashboard Sheet
Displays MTD and YTD performance for all KPIs with variance indicators and comparisons.
📈 Trend Sheet
Analyze individual KPIs using dynamic charts and detailed KPI information.
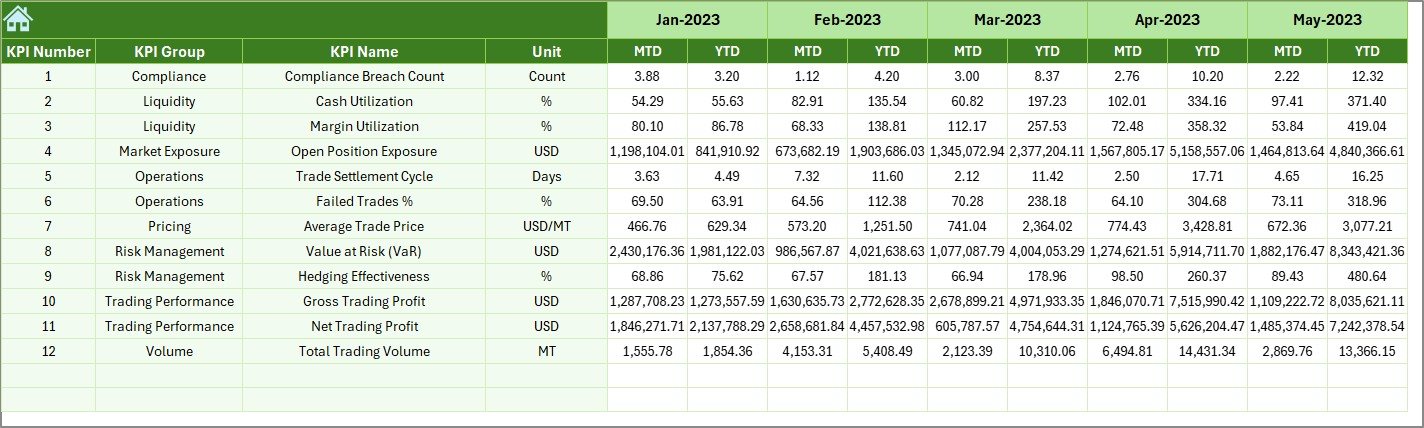
📝 Actual Numbers Input Sheet
Enter real trading results with controlled and structured data entry.
🎯 Target Sheet
Define monthly and yearly performance targets for each KPI.
📅 Previous Year Numbers Sheet
Store historical data to enable meaningful year-over-year comparisons.
📘 KPI Definition Sheet
Acts as a rulebook containing KPI groups, units, formulas, and definitions.
🛠️ How to Use the Commodities Trading KPI Dashboard in Excel
1️⃣ Enter actual MTD and YTD values in the Actual Numbers sheet
2️⃣ Define performance targets in the Target sheet
3️⃣ Add previous-year data for comparison
4️⃣ Select a month from the dashboard drop-down
5️⃣ Instantly review KPI performance, trends, and variances
No advanced Excel skills are required. The dashboard works automatically using built-in formulas and structured logic.
👥 Who Can Benefit from This Commodities Trading KPI Dashboard?
👨💼 Commodity Traders – Monitor margins, prices, and profitability daily
📊 Trading Analysts – Analyze trends and performance efficiently
⚠️ Risk Managers – Track exposure and performance signals early
💰 Finance Teams – Review profitability and cost efficiency
🏢 Senior Management – Get clear, decision-ready insights instantly
Anyone responsible for commodities trading performance will benefit from this dashboard.
Click here to read the Detailed blog post
Watch the step-by-step video tutorial:
Visit our YouTube channel to learn step-by-step video tutorials
YouTube.com/@PKAnExcelExpert


Reviews
There are no reviews yet.