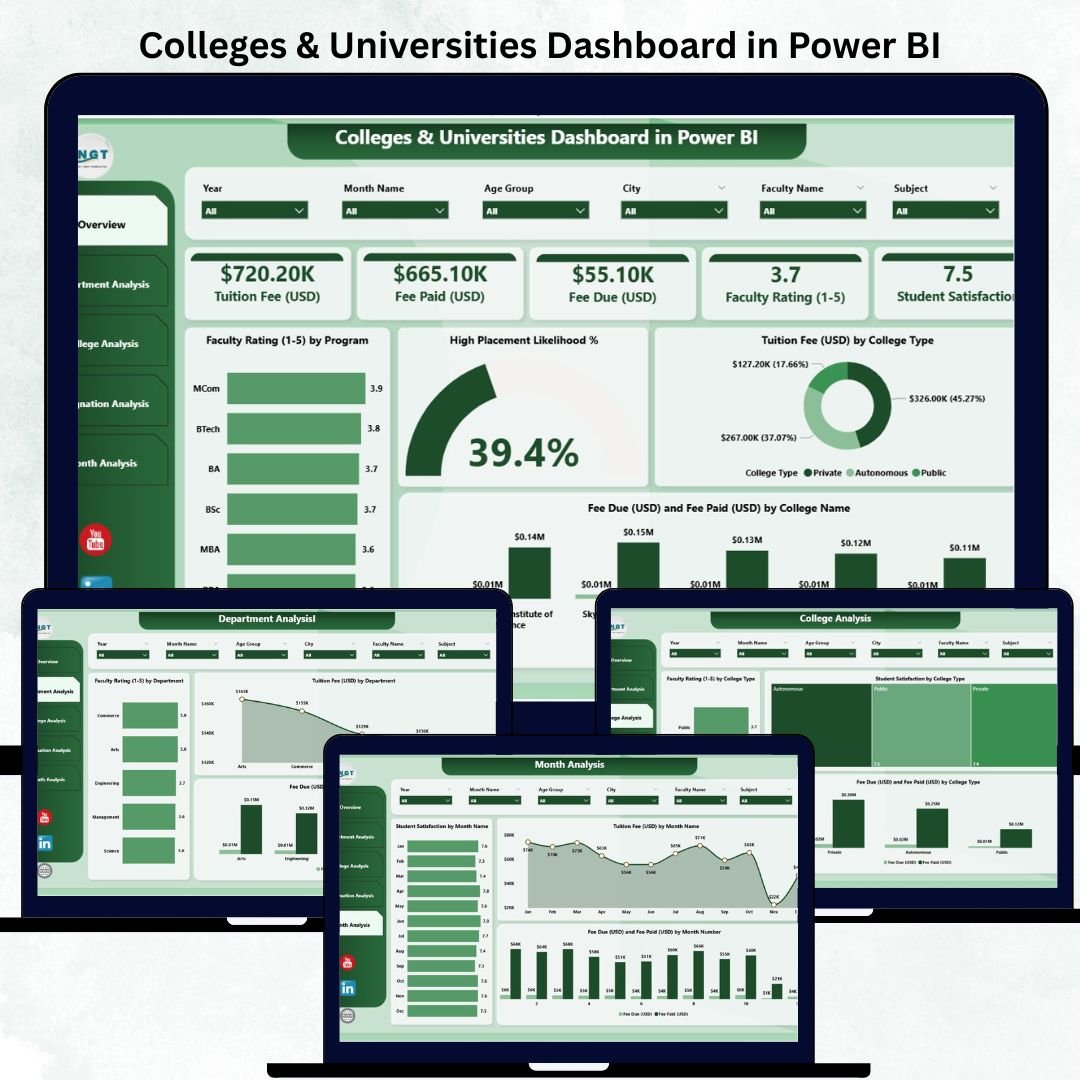
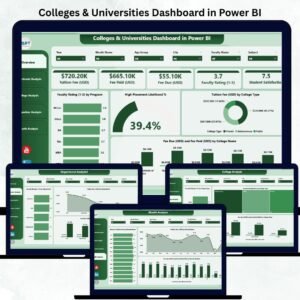
Managing an educational institution is not easy. Colleges and universities deal with massive academic, financial, and administrative data every single day. This Colleges & Universities Dashboard in Power BI is designed to solve that challenge instantly. It converts scattered information into clean, powerful, and interactive visuals that help institutions make fast, accurate, and meaningful decisions.
This dashboard includes five fully designed pages, each focusing on a different analytical requirement—academic insights, departmental trends, faculty evaluation, financial tracking, and monthly performance patterns. Using Power BI’s dynamic filters and slicers, users can explore data by program, department, designation, student category, college type, or month, without needing technical expertise.
With this digital product, you get a professional-grade dashboard that simplifies reporting, reduces manual efforts, and enhances academic planning.
📦 What’s Inside the Colleges & Universities Dashboard in Power BI
This dashboard includes everything an educational institution needs to monitor its performance:
⭐ 1. Overview Page

A powerful summary of all major KPIs.
You get:
-
Student satisfaction
-
Faculty rating
-
Placement potential
-
Tuition revenue
-
Fee paid vs. fee due
-
Program-level insights
This page gives administrators a complete snapshot of institutional health in seconds.
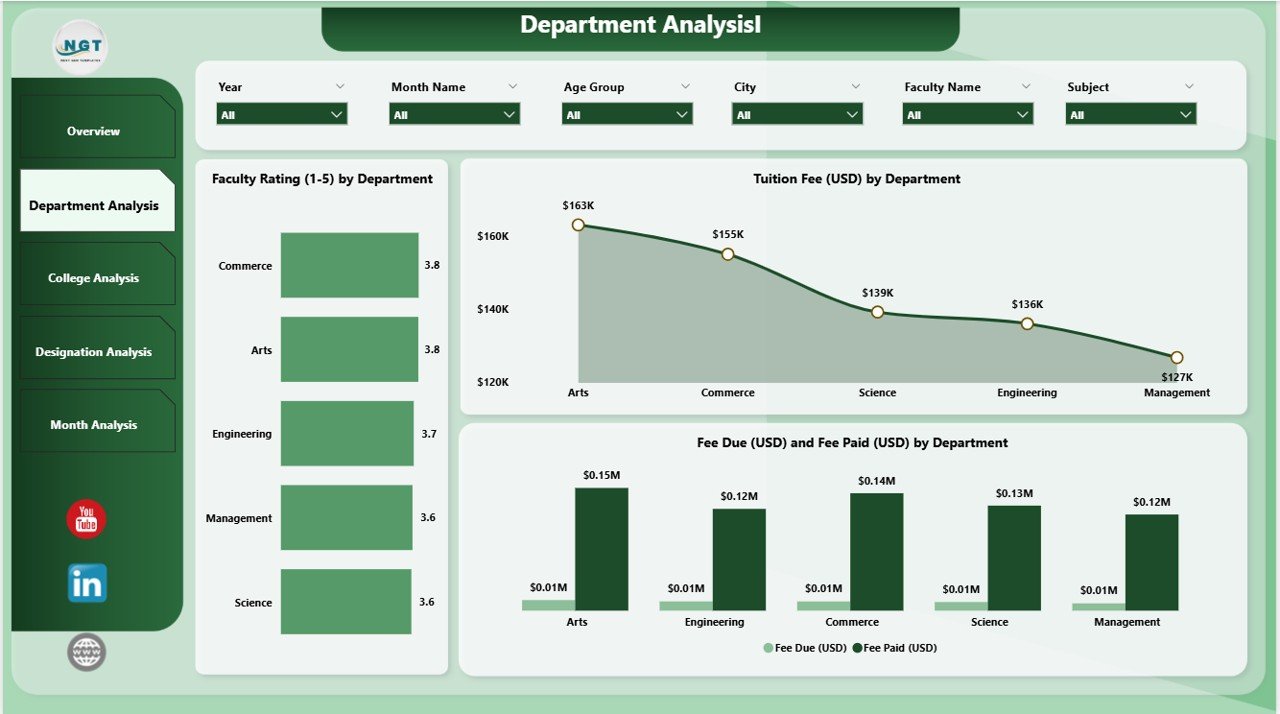
⭐ 2. Department Analysis Page
Perfect for department heads and academic planners.
You can track:
-
Faculty rating by department
-
Tuition revenue by department
-
Department-wise fee payment performance
It helps you identify strengths, gaps, and improvement areas instantly.
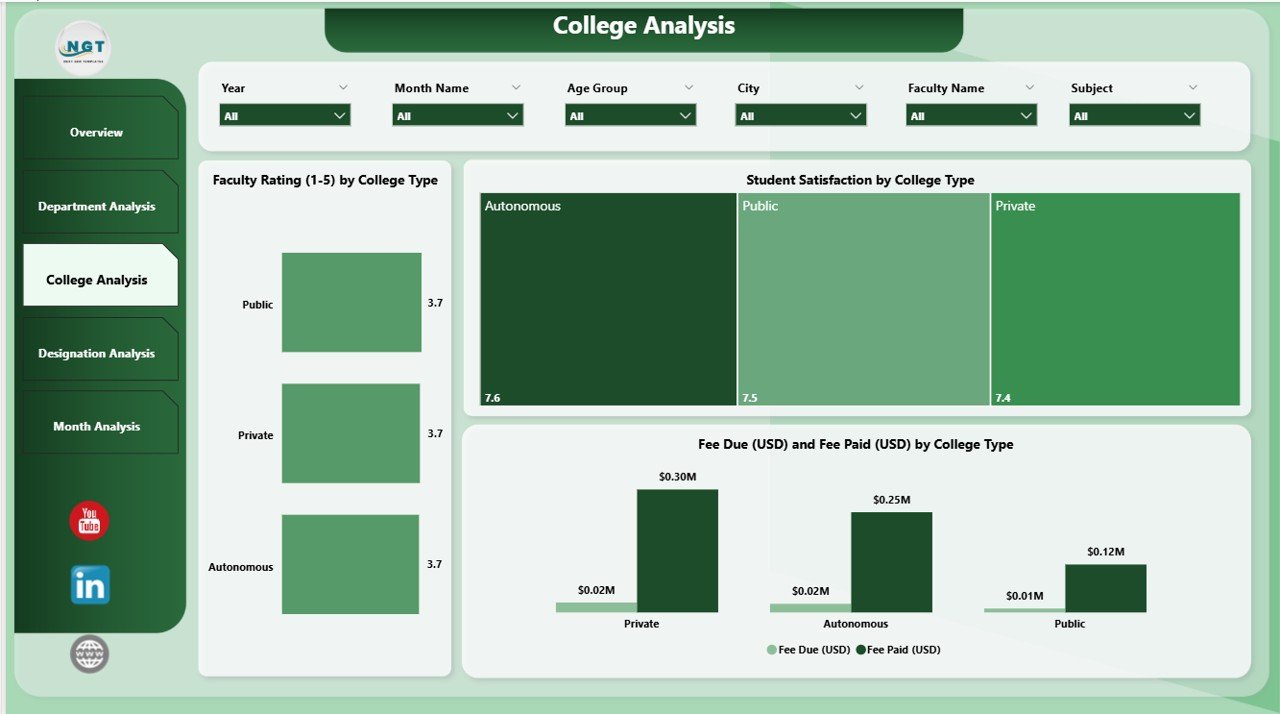
⭐ 3. College Analysis Page
Ideal for institutions with multiple colleges or branches.
This section compares:
-
Teaching quality
-
Student satisfaction
-
Revenue trends
across different college types such as government, private, or autonomous units.
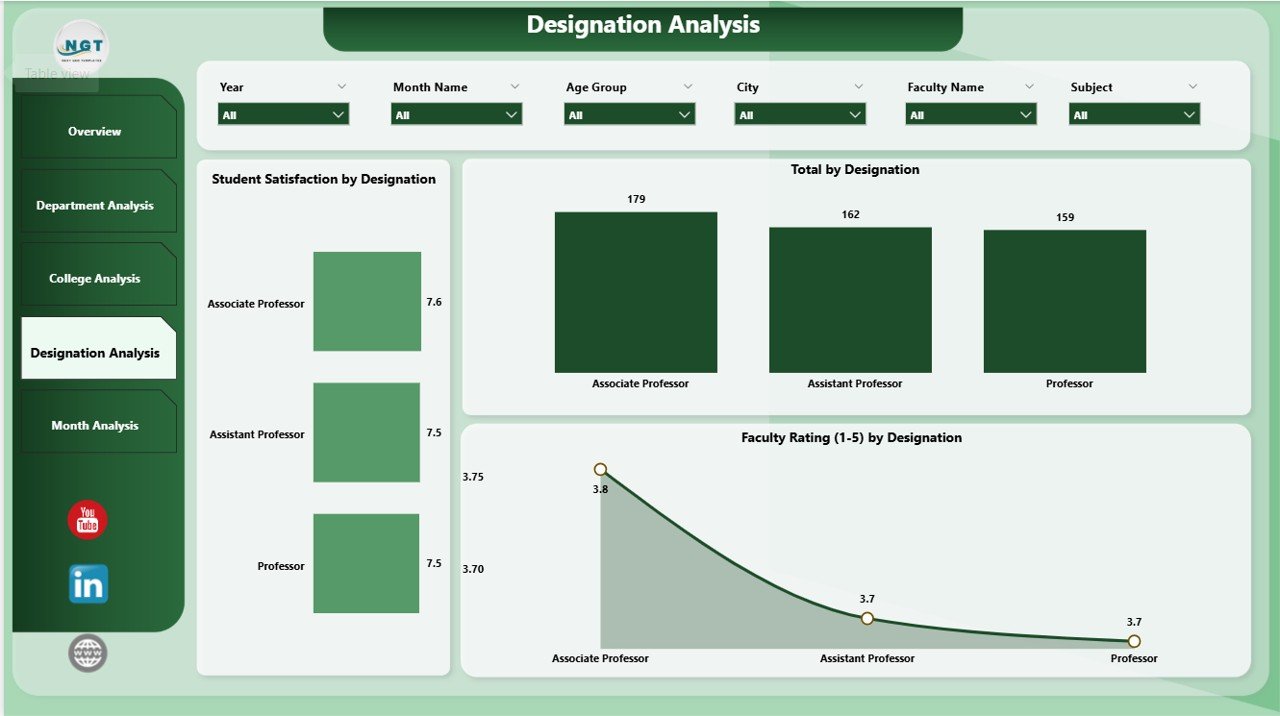
⭐ 4. Designation Analysis Page
Understand your faculty performance at a deeper level.
Visuals include:
-
Faculty rating by designation
-
Student satisfaction by designation
-
Total faculty strength by role
This helps HR teams plan training, promotions, and workload assignments effectively.
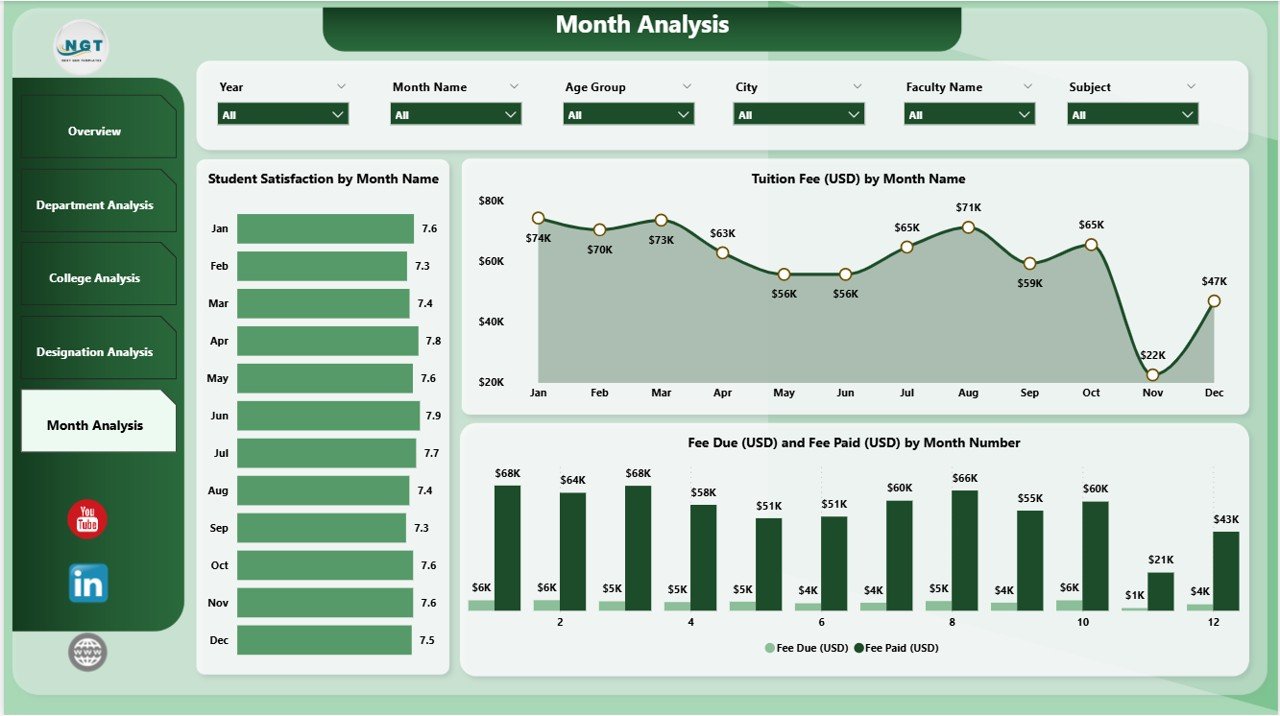
⭐ 5. Monthly Trends Page
Track how performance changes month-to-month.
Analyze:
-
Tuition collection
-
Student satisfaction
-
Fee due vs. fee paid
-
Seasonal academic patterns
This is perfect for planning admissions, semesters, and financial cycles.
Each page comes with interactive slicers, helping users explore data effortlessly.
🛠️ How to Use the Colleges & Universities Dashboard in Power BI
Using this dashboard is extremely easy—even for non-technical users.
Step-by-Step Usage:
➡️ Step 1: Open the Power BI file provided with this digital product.
➡️ Step 2: Load your Excel or database file into the dashboard.
➡️ Step 3: Use slicers to filter data by month, program, department, designation, and more.
➡️ Step 4: Explore interactive charts and KPIs to get instant insights.
➡️ Step 5: Export visuals or share the report with your academic team.
This dashboard is highly customizable. You can add new KPIs, change themes, or connect additional data sources anytime.
👥 Who Can Benefit from This Colleges & Universities Dashboard in Power BI
This product is ideal for a wide range of educational professionals:
🎯 College Administrators
Make faster decisions using centralized insights.
🎯 Department Heads
Analyze department-wise faculty performance, student satisfaction, and fee trends.
🎯 Academic Planners
Track academic trends and ensure timely improvements.
🎯 Finance Teams
Monitor fee due, fee paid, tuition cycles, and monthly financial performance.
🎯 Faculty Leaders
Understand teaching impact, performance ratings, and training needs.
🎯 Placement Teams
Use placement likelihood visuals to enhance student career outcomes.
🎯 University Management
Get a complete institutional overview in one interactive dashboard.
This dashboard is made for anyone who wants clear, reliable, and real-time institutional insights.
### 📘 Click here to read the Detailed Blog Post
### 📺 Visit our YouTube channel to learn step-by-step video tutorials:
👉 Youtube.com/@PKAnExcelExpert


Reviews
There are no reviews yet.