Are you still managing temperature-sensitive shipments through scattered spreadsheets? 🚨 That’s risky. One delay, one temperature deviation, and your profits can melt instantly.
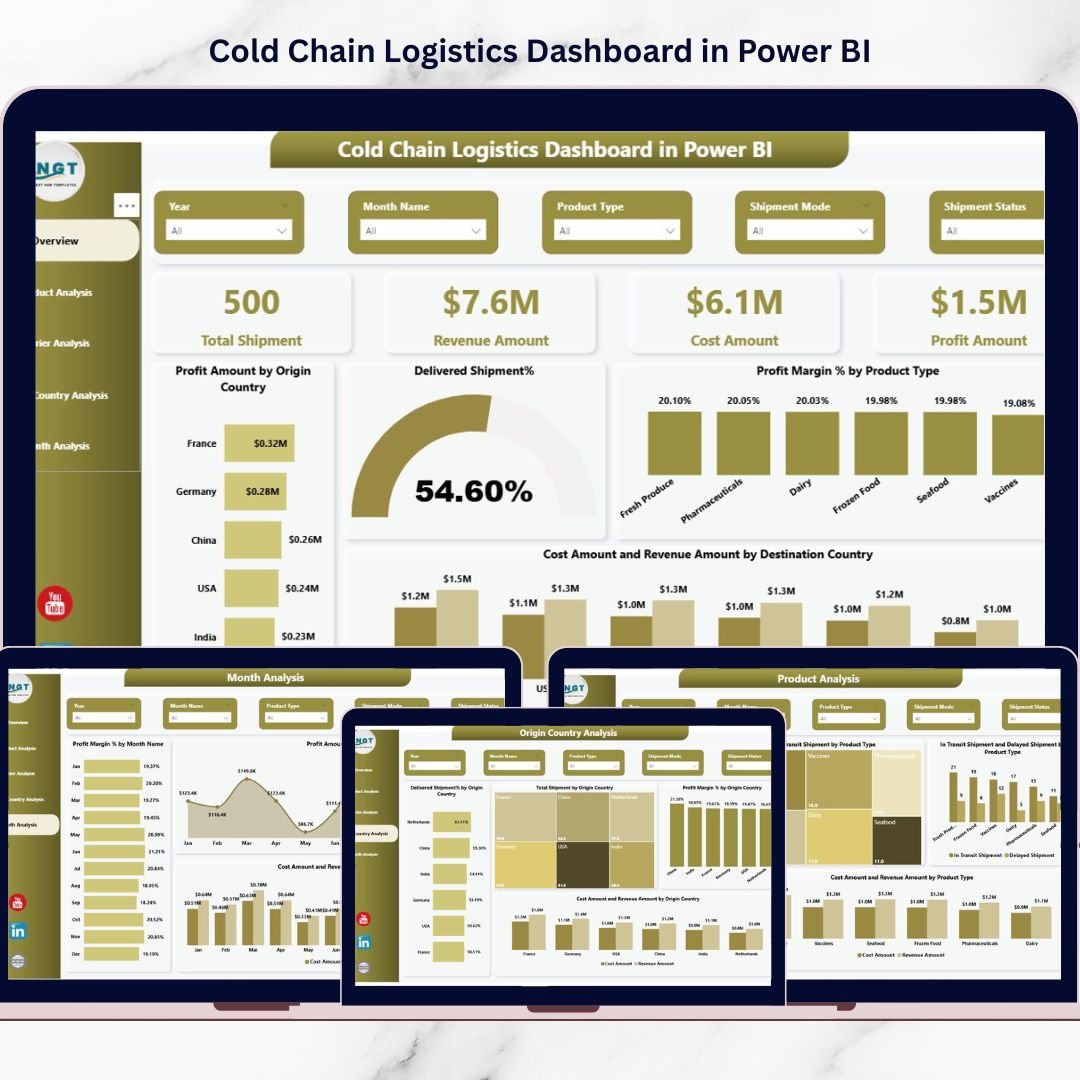
The Cold Chain Logistics Dashboard in Power BI is your all-in-one performance control center. It transforms complex shipment data into clear, interactive, and real-time insights. Instead of guessing what went wrong, you see everything instantly — profits, delays, carrier performance, and country-level trends.
This ready-to-use dashboard empowers logistics managers, supply chain heads, and decision-makers to protect product quality while maximizing profitability. If you deal with pharmaceuticals, frozen foods, dairy, biotech, or chemicals — this dashboard is built for you.
🚀 Key Feature of Cold Chain Logistics Dashboard in Power BI
This dashboard includes 5 powerful analytical pages, each designed to give deep operational visibility.
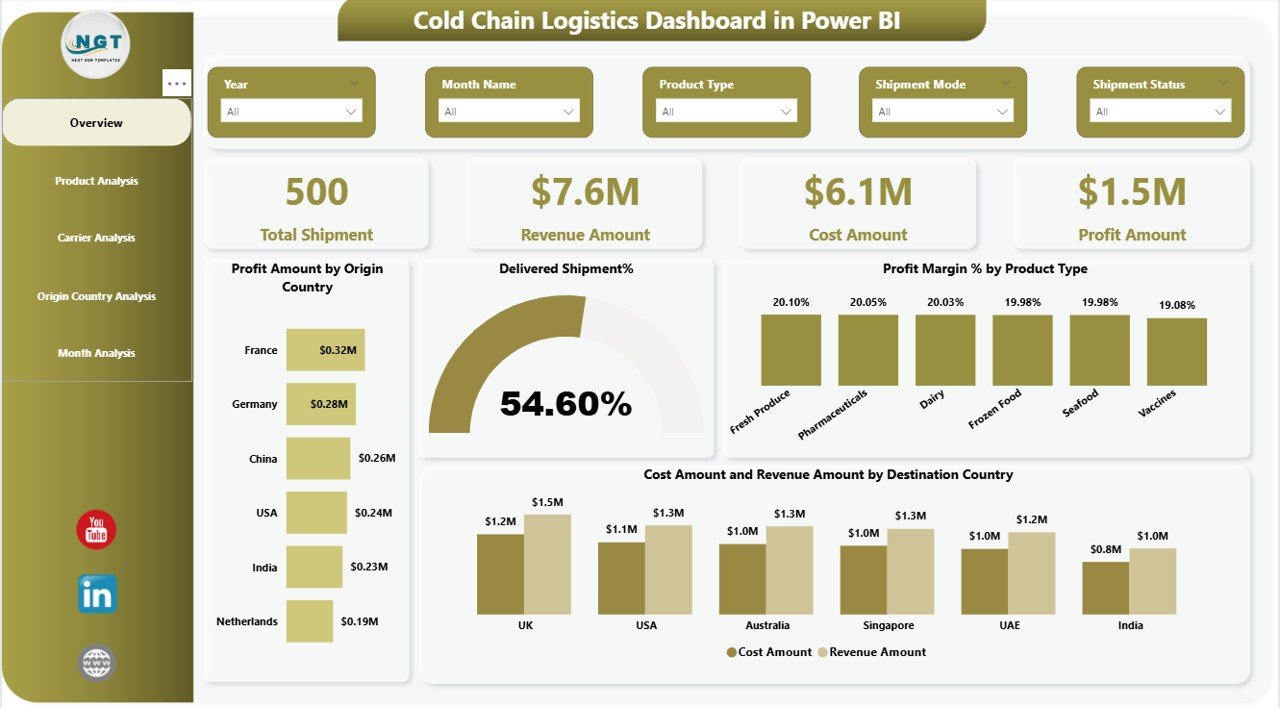
✨ Overview Page – A complete performance snapshot with KPI cards showing Total Shipment, Revenue Amount, Cost Amount, Profit Amount, and Delivered Shipment %. Instantly understand your financial and operational health.
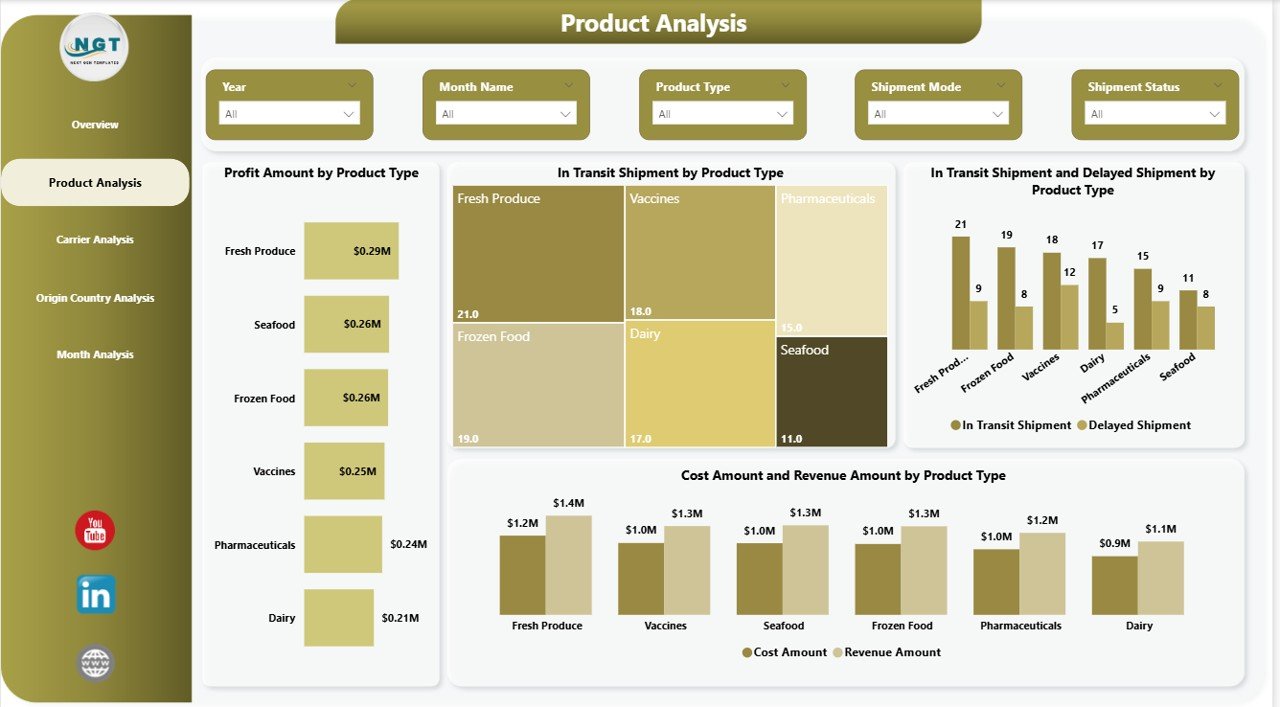
📦 Product Analysis Page – Discover which products generate higher profit margins and which categories face delivery delays. Optimize product-level strategy easily.
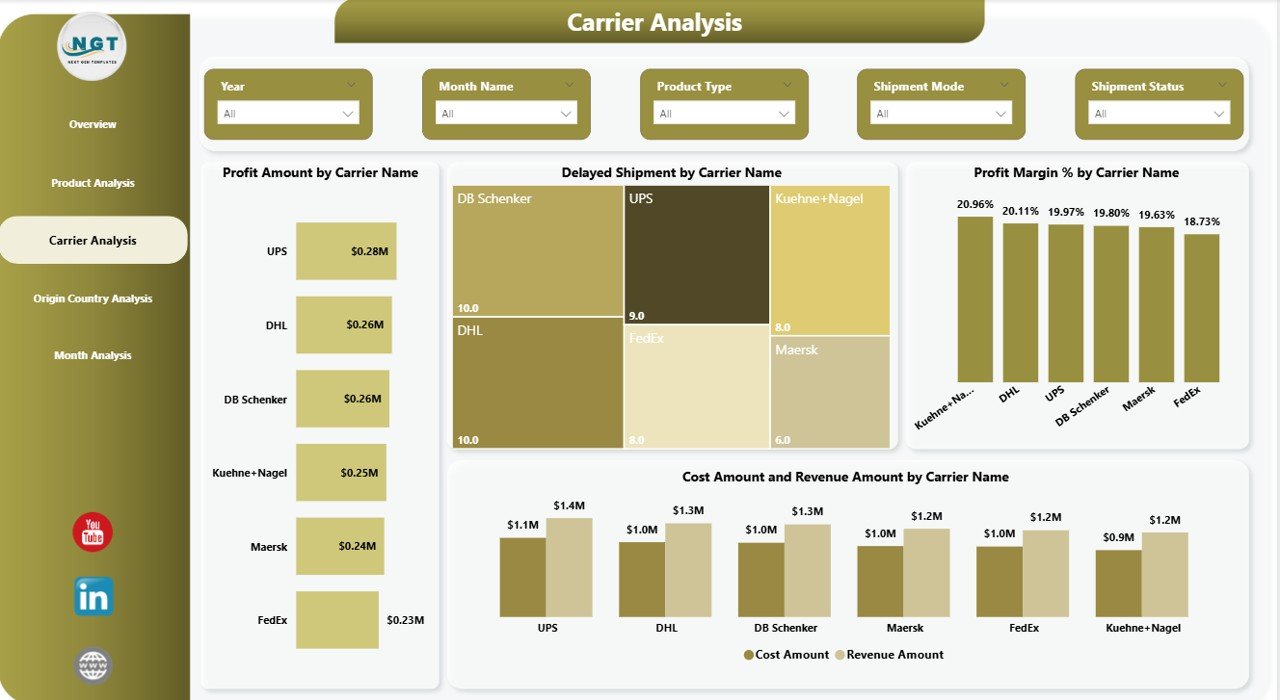
🚚 Carrier Analysis Page – Compare carrier performance based on profit contribution, delayed shipments, and cost efficiency. Negotiate smarter contracts with real data.
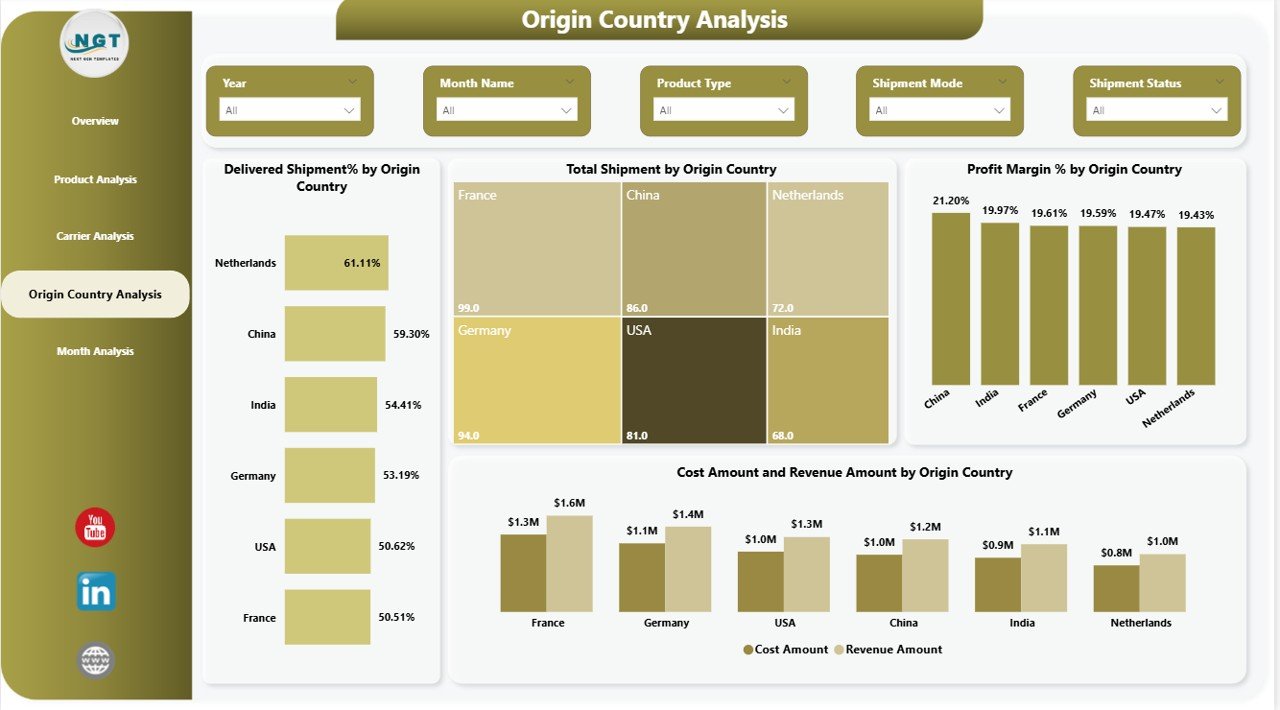
🌍 Origin Country Analysis Page – Identify profitable sourcing regions and track delivery reliability country-wise. Improve global supply planning.
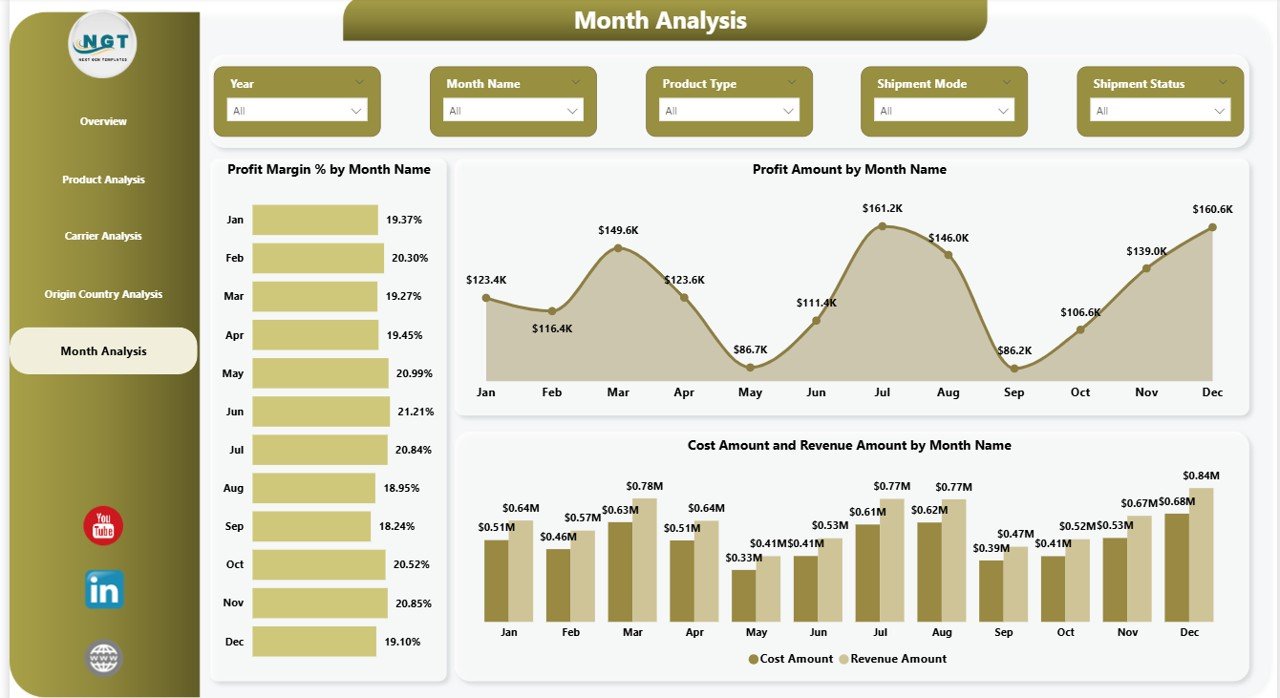
📅 Month Analysis Page – Monitor monthly profit trends, revenue growth, and seasonal cost fluctuations. Plan budgets confidently.
With interactive slicers (Month, Product Type, Carrier Name, Origin & Destination Country), you can drill down into insights within seconds.
📊 What’s Inside the Cold Chain Logistics Dashboard in Power BI
When you download this product, you receive a professionally designed Power BI file with:
✔ 5 Fully Interactive Pages
✔ 5 KPI Cards for instant visibility
✔ 20+ Insightful Charts & Comparisons
✔ Profit Margin % analysis
✔ Delivered, In-Transit & Delayed Shipment tracking
✔ Cost vs Revenue comparisons
✔ Country-wise and carrier-wise profitability analysis
✔ Clean, executive-ready visual layout
Every chart is structured for fast decision-making. No clutter. No confusion. Just powerful insights.
⚙️ How to Use the Cold Chain Logistics Dashboard in Power BI
Using this dashboard is simple and practical.
1️⃣ Import your shipment data into Power BI.
2️⃣ Map it to the provided structure.
3️⃣ Refresh the dashboard.
4️⃣ Use slicers to filter by month, product, carrier, or country.
5️⃣ Analyze KPIs and take action instantly.
You can schedule automatic refresh to keep reports updated. Even if you have basic Power BI knowledge, you can easily navigate the dashboard thanks to its clean and intuitive layout.
🎯 Who Can Benefit from This Cold Chain Logistics Dashboard?
This solution is ideal for:
✔ Logistics Managers
✔ Supply Chain Directors
✔ Cold Storage Operators
✔ Pharmaceutical Companies
✔ Food & Beverage Distributors
✔ Dairy & Frozen Food Exporters
✔ Biotechnology Firms
✔ Import/Export Businesses
If your organization handles temperature-controlled goods, this dashboard will dramatically improve visibility, reduce operational risk, and increase profit margins.
Why This Dashboard Is a Game-Changer
Without analytics, cold chain operations suffer from hidden delays, rising costs, and silent profit erosion. However, with this dashboard:
-
You detect delivery issues instantly
-
You compare carrier efficiency clearly
-
You identify high-margin products
-
You control operational expenses
-
You make confident, data-driven decisions
Instead of reacting to problems, you prevent them. That’s the real power of structured analytics.
Click here to read the Detailed blog post
Watch the step-by-step video tutorial:


