Cloud hosting is all about performance. Your customers expect 99.9% uptime, fast response times, secure infrastructure, and scalable solutions. But if you’re reporting still depends on static Excel sheets, Cloud Hosting Services KPI Dashboard in Power BI how can you truly see what’s happening in real time?
Stop compiling reports.
Start controlling performance.
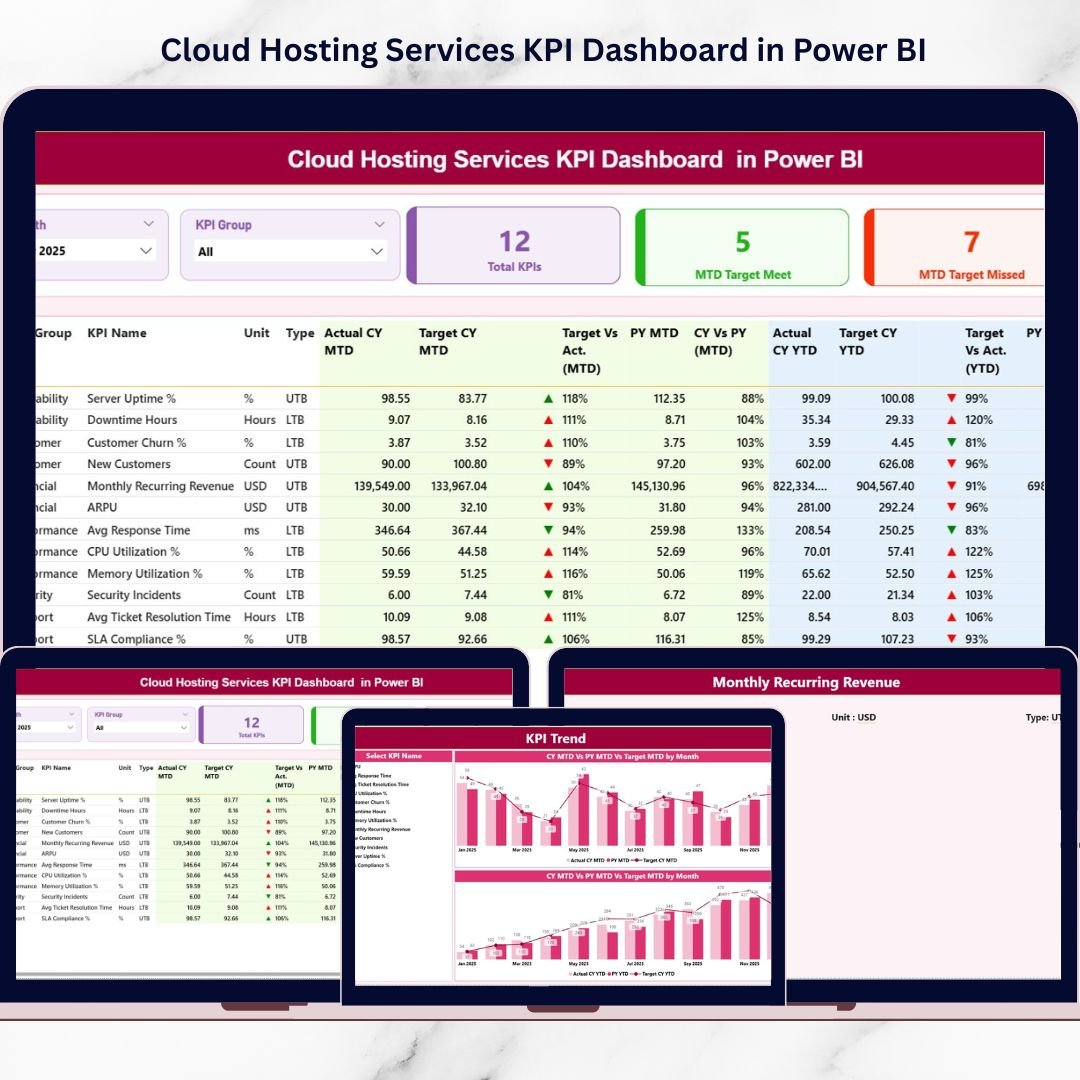
Cloud Hosting Services KPI Dashboard in Power BI the Cloud Hosting Services KPI Dashboard in Power BI transforms structured Excel data into interactive visuals, dynamic KPI tracking, and powerful performance insights. Monitor MTD (Month-to-Date) and YTD (Year-to-Date) results, compare Actual vs Target, analyze Current Year vs Previous Year, and drill into KPI details — all in one professional Power BI solution.
📊 Key Feature of Cloud Hosting Services KPI Dashboard in Power BI
This dashboard includes 3 powerful interactive pages designed for full visibility and control.
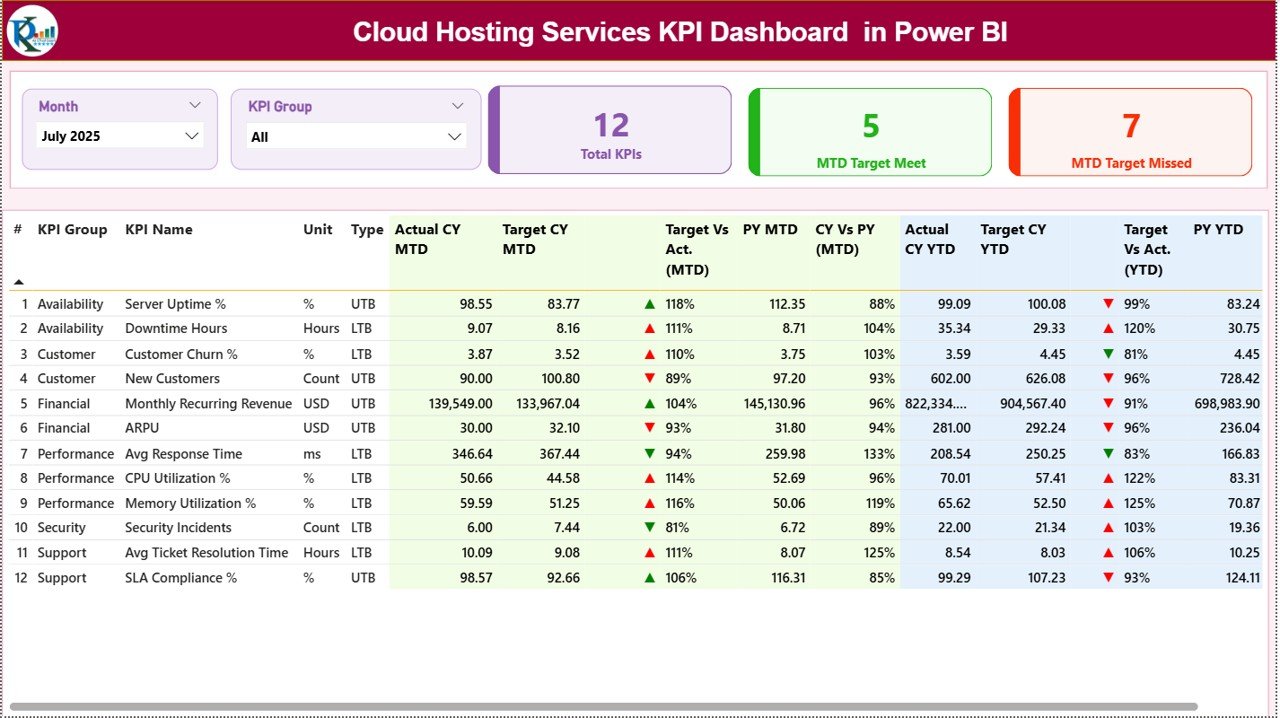
📈 Summary Page – Real-Time Performance Control Center
✔ Month Slicer
✔ KPI Group Slicer
✔ 3 KPI Cards:
-
Total KPIs Count
-
MTD Target Meet Count
-
MTD Target Missed Count
✔ Detailed KPI Table showing:
-
KPI Number, Group, Name, Unit
-
Type (LTB / UTB)
-
Actual CY MTD & Target CY MTD
-
▲ / ▼ Performance Icons
-
Target vs Actual %
-
Previous Year comparison
-
YTD performance section
🟢 ▲ Green = KPI above target
🔴 ▼ Red = KPI below target
Instant clarity. Zero guesswork.
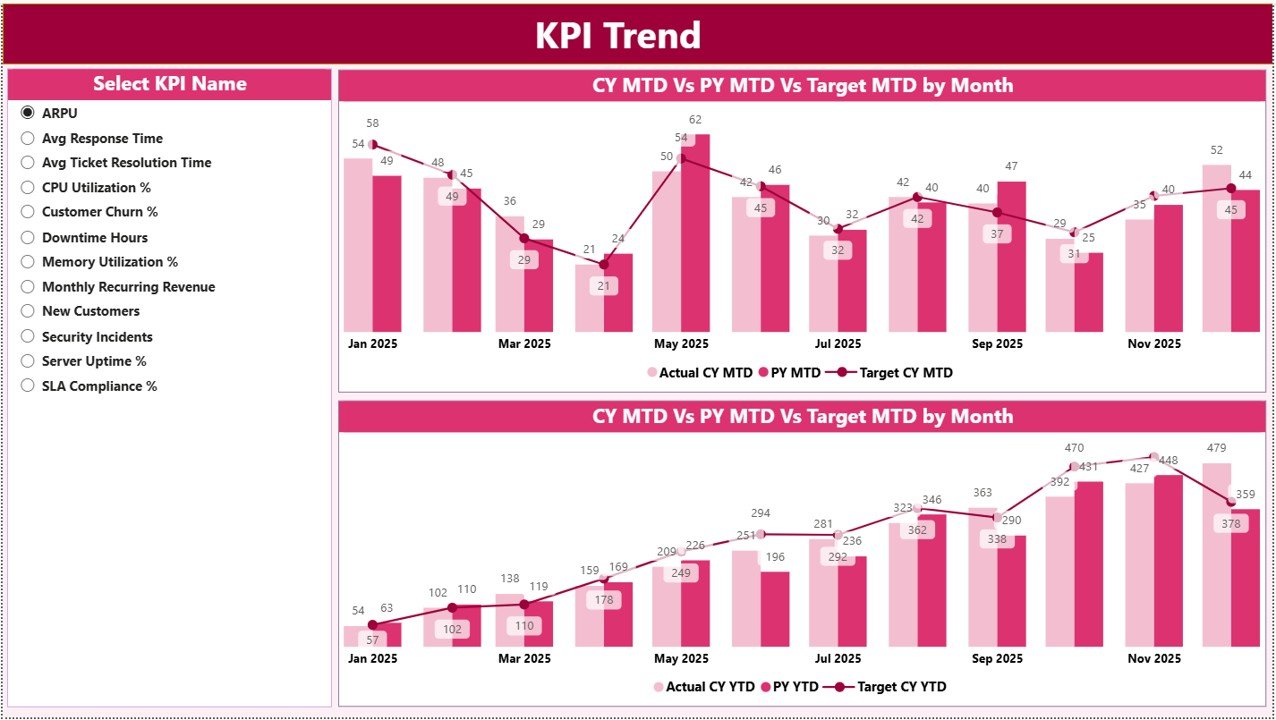
📉 KPI Trend Page – Analyze Performance Over Time
✔ KPI Name Slicer
✔ MTD Combo Chart (Actual vs Target vs PY)
✔ YTD Combo Chart (Actual vs Target vs PY)
✔ Month-by-month trend visualization
Identify patterns, growth direction, and recurring performance gaps instantly.
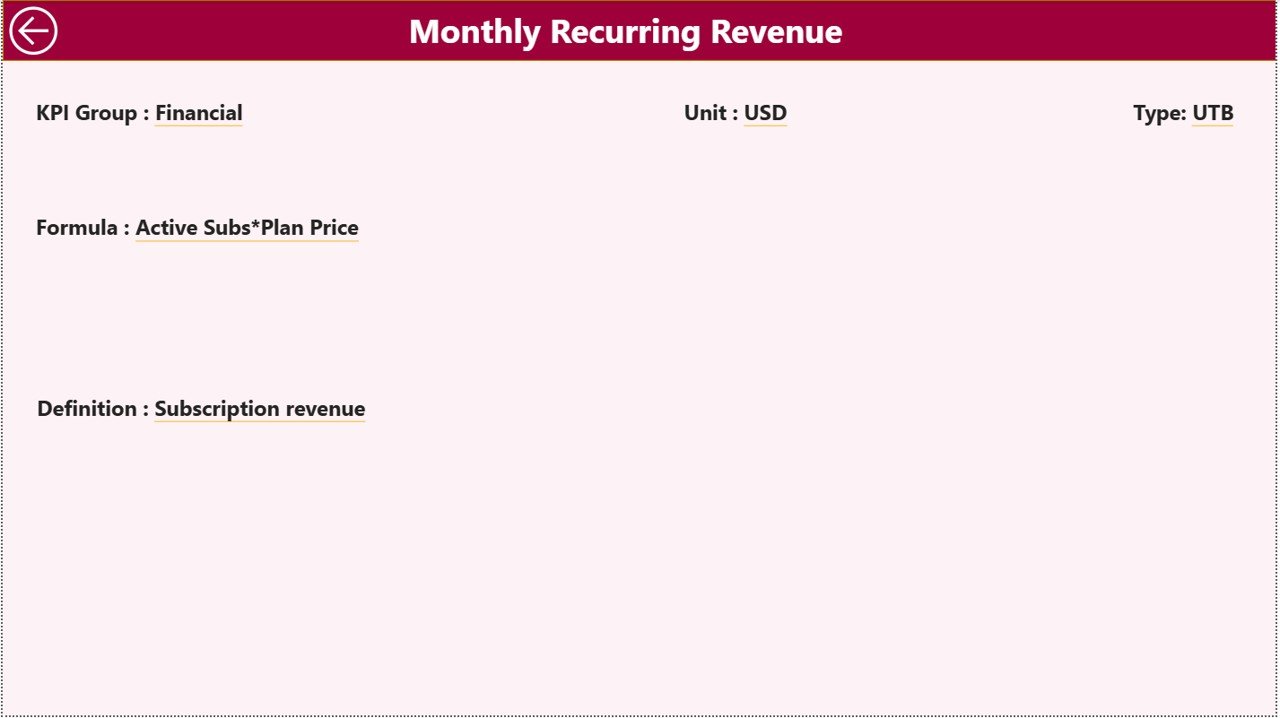
📘 KPI Definition Page – Drill-Through Transparency
✔ KPI Formula
✔ KPI Definition
✔ KPI Unit
✔ KPI Type (Lower the Better / Upper the Better)
Right-click any KPI from Summary → Drill Through → View detailed definition.
Clear logic. Full transparency.
📦 What’s Inside the Cloud Hosting Services KPI Dashboard in Power BI
When you download this product, you receive:
✔ Power BI Dashboard File (.pbix)
✔ Structured Excel Data Model
✔ Interactive slicers
✔ Conditional KPI icons
✔ Automated MTD & YTD comparison
✔ Current vs Previous Year analysis
✔ Drill-through KPI documentation
✔ Executive-ready professional layout
This is not just a dashboard — it’s your cloud performance command center.
🛠 How to Use the Cloud Hosting Services KPI Dashboard in Power BI
1️⃣ Enter monthly data in the Excel file:
-
Input Actual Sheet
-
Input Target Sheet
-
KPI Definition Sheet
2️⃣ Refresh Power BI.
3️⃣ Select Month & KPI Group using slicers.
4️⃣ Analyze performance instantly using icons and charts.
No manual reporting. No complex formulas.
👥 Who Can Benefit from This Cloud Hosting Services KPI Dashboard?
This dashboard is ideal for:
☁ Cloud Hosting Providers
💻 SaaS Companies
🖥 IT Infrastructure Teams
📡 Data Center Operators
📊 Operations Managers
💰 Finance Leaders
🚀 Growing Tech Startups
If uptime, SLA compliance, and revenue growth matter — this dashboard is essential.
🎯 Why Choose Cloud Hosting Services KPI Dashboard in Power BI?
✔ Interactive KPI filtering
✔ Real-time performance visibility
✔ MTD & YTD structured tracking
✔ Year-over-Year comparison
✔ Clear visual performance alerts
✔ Professional executive reporting
✔ Scalable KPI framework
✔ Excel integration for easy data updates
Scale confidently. Measure precisely. Act faster.
Click here to read the Detailed blog post
Visit our YouTube channel to learn step-by-step video tutorials:
👉 https://youtube.com/@PKAnExcelExpert


