
Modern organizations depend heavily on cloud platforms to run applications, manage data, and scale infrastructure efficiently. As businesses migrate workloads to the cloud, monitoring usage, controlling costs, and ensuring performance reliability become increasingly challenging. Many companies still analyze cloud reports manually across multiple systems, which leads to delayed insights, uncontrolled expenses, and inefficient resource utilization.
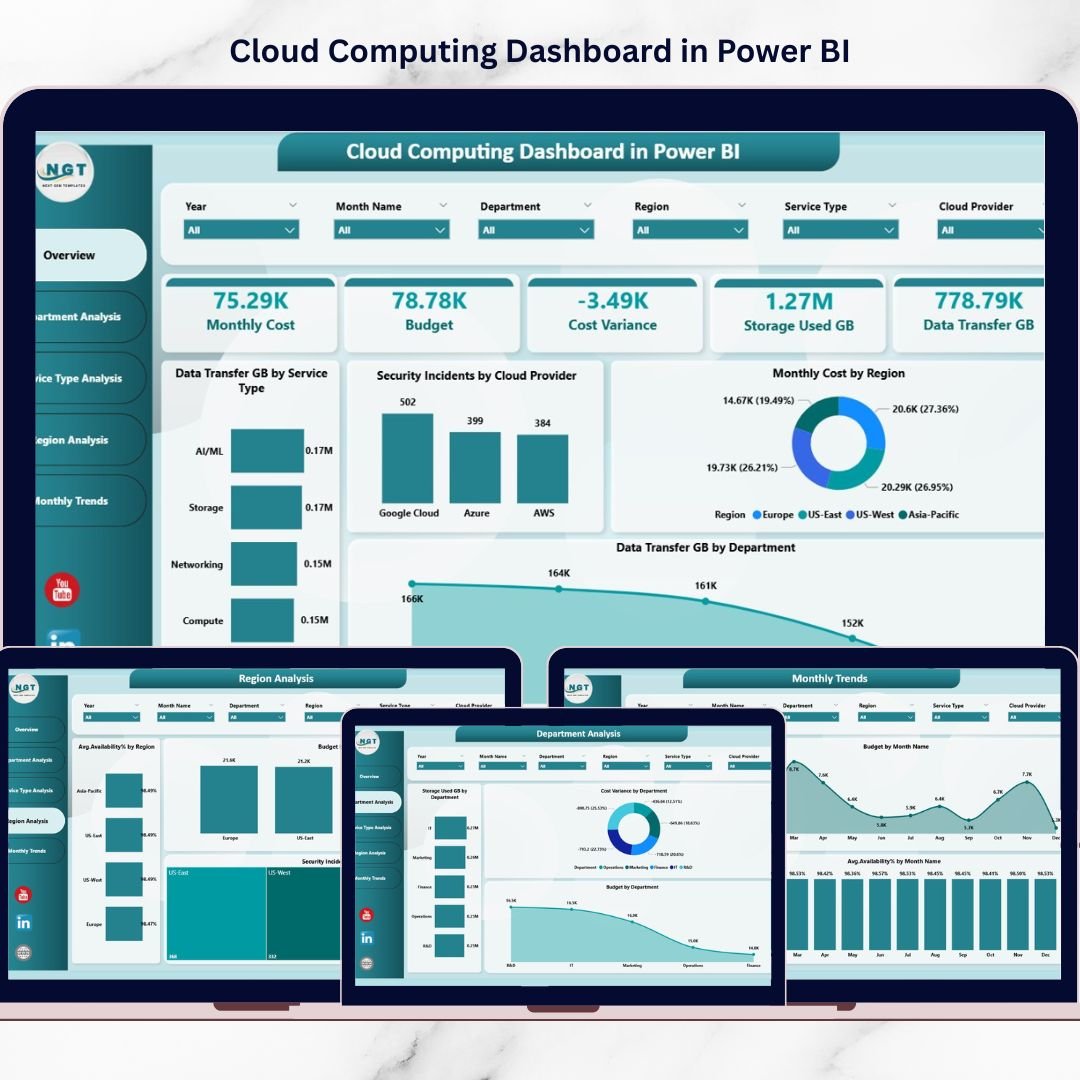
The Cloud Computing Dashboard in Power BI is a powerful, ready-to-use analytics solution designed to transform complex cloud data into clear, interactive insights. Instead of reviewing scattered reports from different providers, organizations can monitor all critical cloud performance indicators in one centralized Power BI dashboard.
This dashboard enables IT teams, finance managers, and executives to track cloud spending, analyze usage patterns, monitor availability, and evaluate security incidents through dynamic visualizations. With real-time filtering and automated analytics, businesses gain complete visibility into cloud operations and make faster data-driven decisions.
Whether your organization uses AWS, Azure, Google Cloud, or hybrid environments, this dashboard simplifies cloud governance and performance monitoring without requiring complex setup or advanced technical expertise.
🚀 Key Features of Cloud Computing Dashboard in Power BI
📊 Centralized Cloud Monitoring – View all cloud KPIs in one interactive dashboard.
💰 Cost vs Budget Tracking – Monitor spending and detect budget variance instantly.
📦 Storage & Data Transfer Analysis – Understand resource consumption clearly.
🌍 Region-Based Insights – Compare performance across geographic locations.
🏢 Department-Level Analysis – Identify resource usage by business units.
🔐 Security Incident Monitoring – Track risks across cloud providers.
📈 Monthly Trend Analysis – Analyze historical performance patterns.
🎯 Interactive Slicers & Filters – Drill into data dynamically.
⚡ Real-Time Analytics Experience – Refresh data and update visuals instantly.
📦 What’s Inside the Cloud Computing Dashboard in Power BI
This ready-to-use Power BI solution includes five analytical dashboard pages; each designed for specific cloud management insights.
📊 Overview Page – Cloud Performance Snapshot
The Overview Page acts as the main control center.
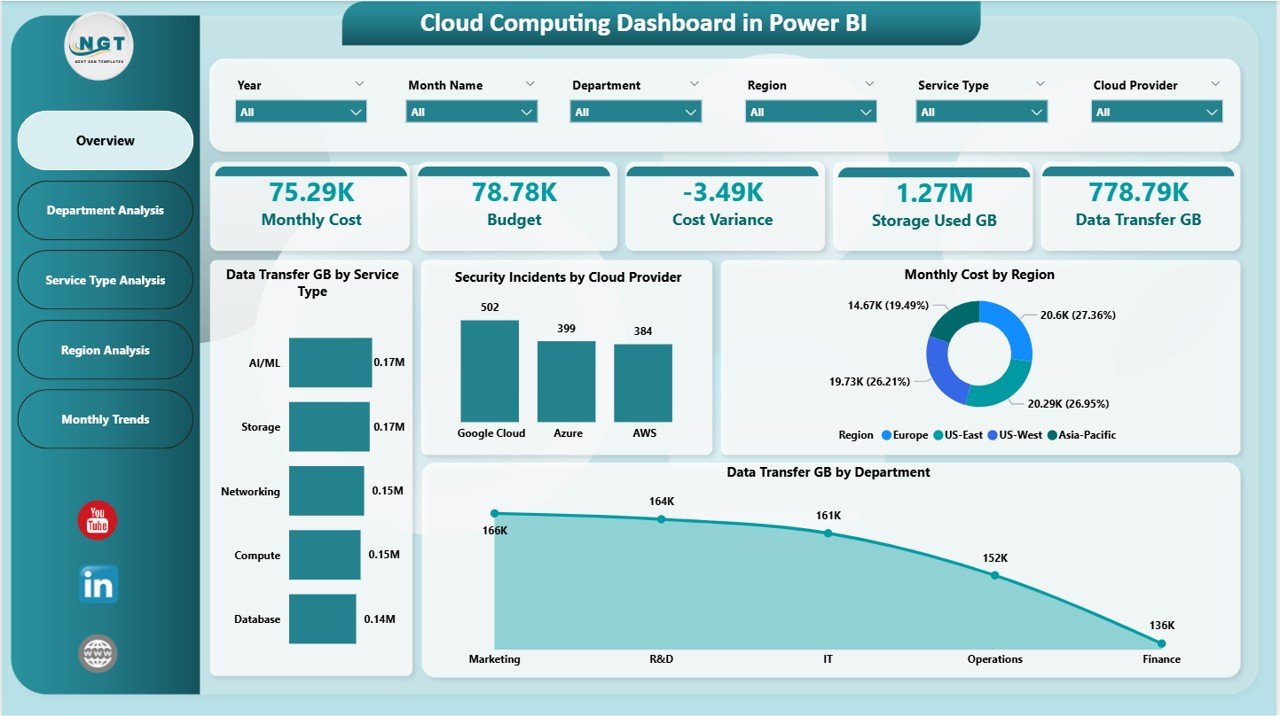
KPI Cards Displayed
-
Monthly Cloud Cost
-
Budget Allocation
-
Cost Variance
-
Storage Used (GB)
-
Data Transfer (GB)
Visual Charts Include
-
Data Transfer by Service Type
-
Security Incidents by Provider
-
Monthly Cost by Region
-
Data Usage by Department
This page instantly reveals cloud health and financial performance.
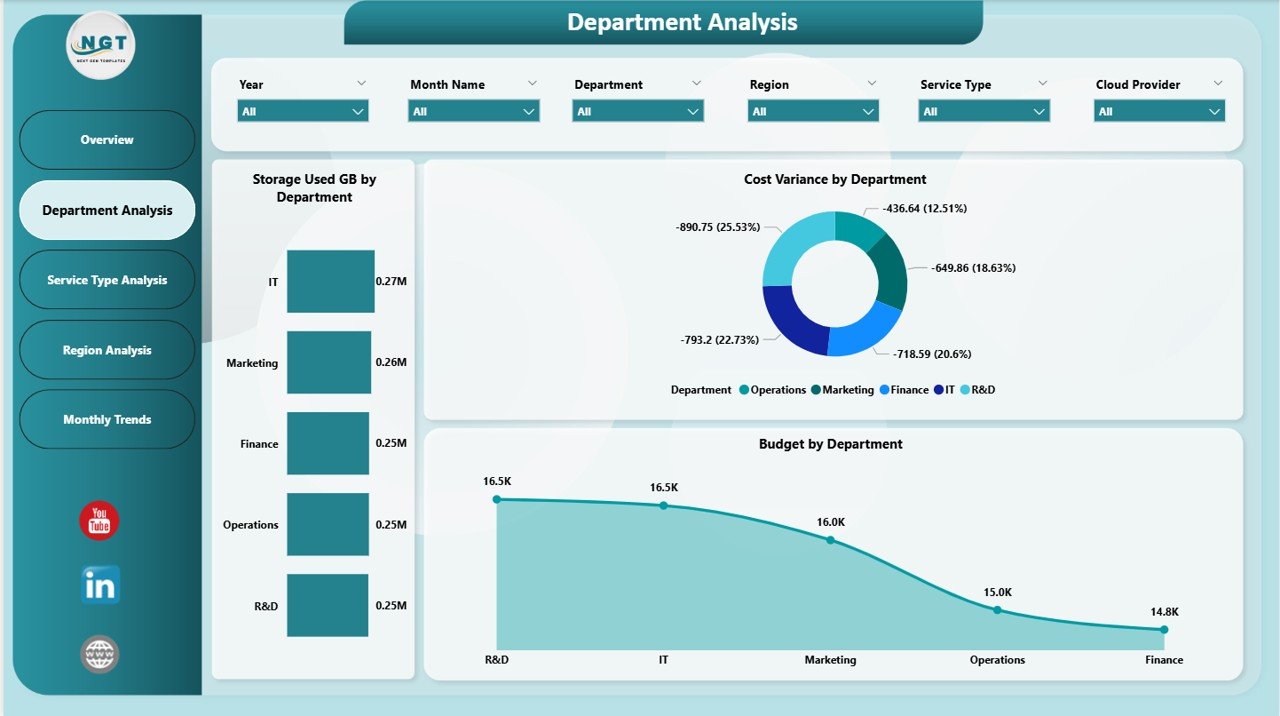
🏢 Department Analysis Page
Analyze how departments consume cloud resources.
Insights Provided
-
Storage usage by department
-
Budget allocation comparison
-
Cost variance tracking
Managers easily identify high-consumption teams and optimize budgets.
⚙️ Service Type Analysis Page
Evaluate performance and efficiency of cloud services.
Charts Included
-
Budget by Service Type
-
Data Transfer by Service
-
Average Compute Hours
Helps organizations optimize workloads and reduce unnecessary spending.
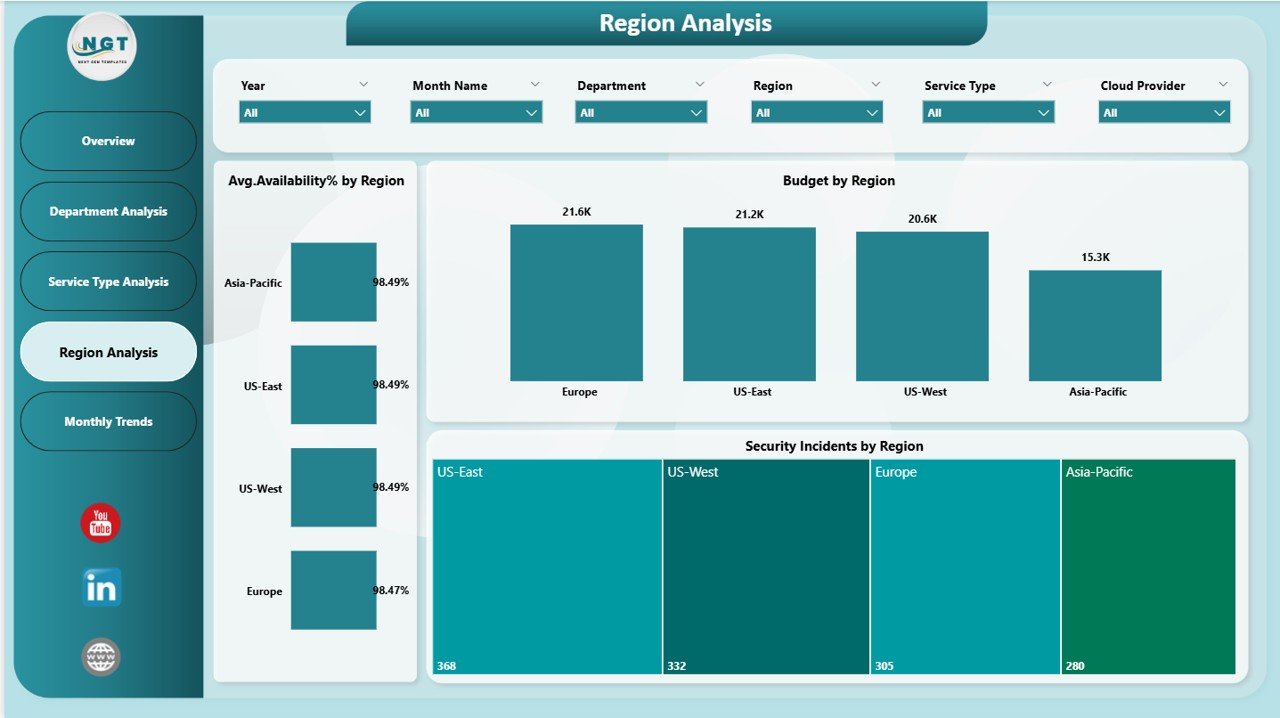
🌍 Region Analysis Page
Monitor cloud performance across deployment regions.
Key Metrics
-
Budget by region
-
Availability percentage
-
Security incidents by region
Supports strategic infrastructure planning and risk assessment.
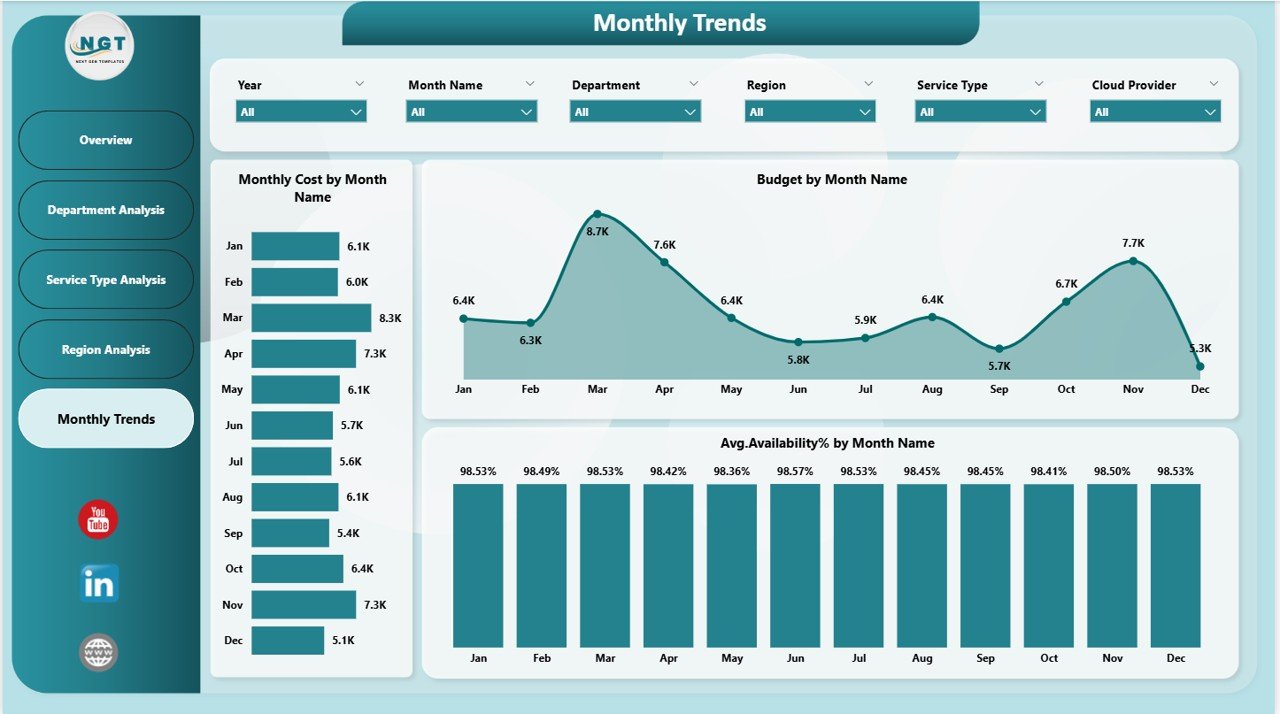
📅 Monthly Trends Page
Understand long-term performance through trend analytics.
Trend Visualizations
-
Monthly cost trends
-
Availability performance trends
-
Budget comparison over time
Improves forecasting and financial planning accuracy.
⚙️ How to Use the Cloud Computing Dashboard
1️⃣ Import cloud usage data into Power BI.
2️⃣ Refresh dataset to update analytics.
3️⃣ Use slicers to filter by department, service, or region.
4️⃣ Review KPI cards for quick insights.
5️⃣ Explore analysis pages for deeper investigation.
6️⃣ Monitor monthly trends for forecasting.
Within minutes, organizations gain enterprise-level cloud visibility.
👥 Who Can Benefit from This Cloud Computing Dashboard
This dashboard is ideal for:
☁️ Cloud Administrators
💻 IT Operations Teams
📊 Finance & Cost Management Teams
🔐 Cybersecurity Analysts
📈 Business Executives
🏢 Digital Transformation Leaders
Any organization using cloud infrastructure can leverage this solution.
💡 Why This Dashboard Improves Cloud Management
Traditional cloud monitoring is reactive. This dashboard enables proactive decision-making.
Benefits include:
✅ Early detection of cost overruns
✅ Improved resource allocation
✅ Better performance visibility
✅ Enhanced security monitoring
✅ Faster executive reporting
✅ Data-driven IT governance
Organizations gain control over cloud environments while reducing operational complexity.
### Click here to read the Detailed blog post
🎥 Visit our YouTube channel to learn step-by-step video tutorials
👉 https://youtube.com/@PKAnExcelExpert


