


Managing clinic tenders without structured performance tracking can silently drain budgets, delay procurement cycles, and create compliance risks. Clinics today deal with medical equipment vendors, service contracts, maintenance tenders, and strict healthcare regulations—all while maintaining cost control and service quality. Relying only on manual Excel tracking is no longer enough.
That is why the Clinic Tender KPI Dashboard in Power BI is designed as a powerful, ready-to-use analytical solution that converts complex tender data into clear KPIs, visual indicators, and actionable insights. This dashboard helps clinic administrators and procurement teams monitor tender performance, identify risks early, and make confident data-driven decisions—month after month.
Built using Power BI with Excel as the backend, this dashboard ensures easy implementation without complex integrations. Whether you manage a single clinic or a multi-facility healthcare setup, this dashboard delivers instant clarity and control over tender performance.
🚀 Key Features of Clinic Tender KPI Dashboard in Power BI
✅ Centralized Tender Performance Monitoring
Track all clinic tender KPIs from one interactive Power BI dashboard instead of juggling multiple Excel files.
📅 Dynamic Month & KPI Group Slicers
Instantly filter KPIs by reporting month or tender category for focused and fast analysis.
🎯 MTD & YTD Performance Tracking
Monitor Month-to-Date and Year-to-Date performance with automated calculations and status icons.
📊 Target vs Actual Comparison
Easily identify over-performance or under-performance using visual indicators and percentage metrics.
📈 Year-over-Year Analysis
Compare Current Year vs Previous Year performance for both MTD and YTD values.
🟢 LTB & UTB KPI Logic
Accurately evaluate KPIs using Lower-The-Better and Upper-The-Better logic.
🔍 Detailed KPI Drill-Through
Access KPI definitions, formulas, and types directly from the dashboard when needed.

📦 What’s Inside the Clinic Tender KPI Dashboard
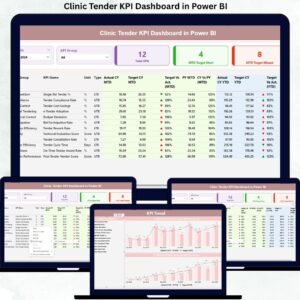
📌 Summary Page
Acts as the control center with KPI cards, slicers, and a detailed KPI table showing MTD and YTD metrics.
📌 KPI Trend Page
Includes combo charts for MTD and YTD trends, comparing Actual, Target, and Previous Year values.
📌 KPI Definition Page
Provides KPI formulas, definitions, and KPI type (LTB / UTB) for complete clarity.
📌 Excel Backend Structure
-
Input_Actual Sheet
-
Input_Target Sheet
-
KPI Definition Sheet
This structure allows automatic KPI calculations without manual formulas.
🛠️ How to Use the Clinic Tender KPI Dashboard
1️⃣ Enter actual and target values in the Excel file
2️⃣ Refresh the Power BI dashboard
3️⃣ Select Month and KPI Group using slicers
4️⃣ Analyze KPI cards, tables, and trends
5️⃣ Identify gaps, risks, and improvement areas instantly
No advanced Power BI knowledge required—just update Excel and analyze insights.
👥 Who Can Benefit from This Clinic Tender KPI Dashboard
🏥 Clinic Administrators
📦 Procurement Managers
💰 Finance Teams
📋 Compliance Officers
🏢 Hospital & Clinic Management Committees
This dashboard is suitable for small, mid-size, and large clinics seeking better procurement governance.


Reviews
There are no reviews yet.