Climate change organizations operate under constant pressure to prove impact, ensure transparency, and deliver measurable results. However, managing performance data across spreadsheets, reports, and manual summaries often slows down decision-making and weakens donor confidence. That is exactly why the Climate Change NGOs KPI Dashboard in Power BI becomes a powerful, must-have analytics solution for modern environmental organizations 🌍📊.
This ready-to-use dashboard converts raw NGO and climate performance data into clear, interactive, and actionable insights. Instead of spending hours preparing reports, NGO leaders can instantly track progress, compare targets with actuals, and communicate impact with confidence. Built using Excel as the data source and Power BI for visualization, this dashboard balances simplicity with advanced analytics—without technical complexity.
Key Features of Climate Change NGOs KPI Dashboard in Power BI
✅ Centralized KPI Monitoring
Track all climate, funding, outreach, and impact KPIs from one interactive dashboard instead of juggling multiple reports.
📅 MTD & YTD Performance Tracking
Monitor Month-to-Date and Year-to-Date performance to balance short-term actions with long-term climate goals.
🎯 Target vs Actual Analysis
Instantly identify whether KPIs meet or miss targets using visual indicators and percentage comparisons.
📈 Year-over-Year Performance Comparison
Analyze Current Year vs Previous Year trends to measure real improvement in climate initiatives.
🧭 Interactive Slicers
Filter data by Month and KPI Group to focus on specific programs, regions, or impact areas.
🔍 Drill-Through KPI Definitions
Access KPI formulas and definitions directly from the dashboard for audit-ready and donor-friendly reporting.
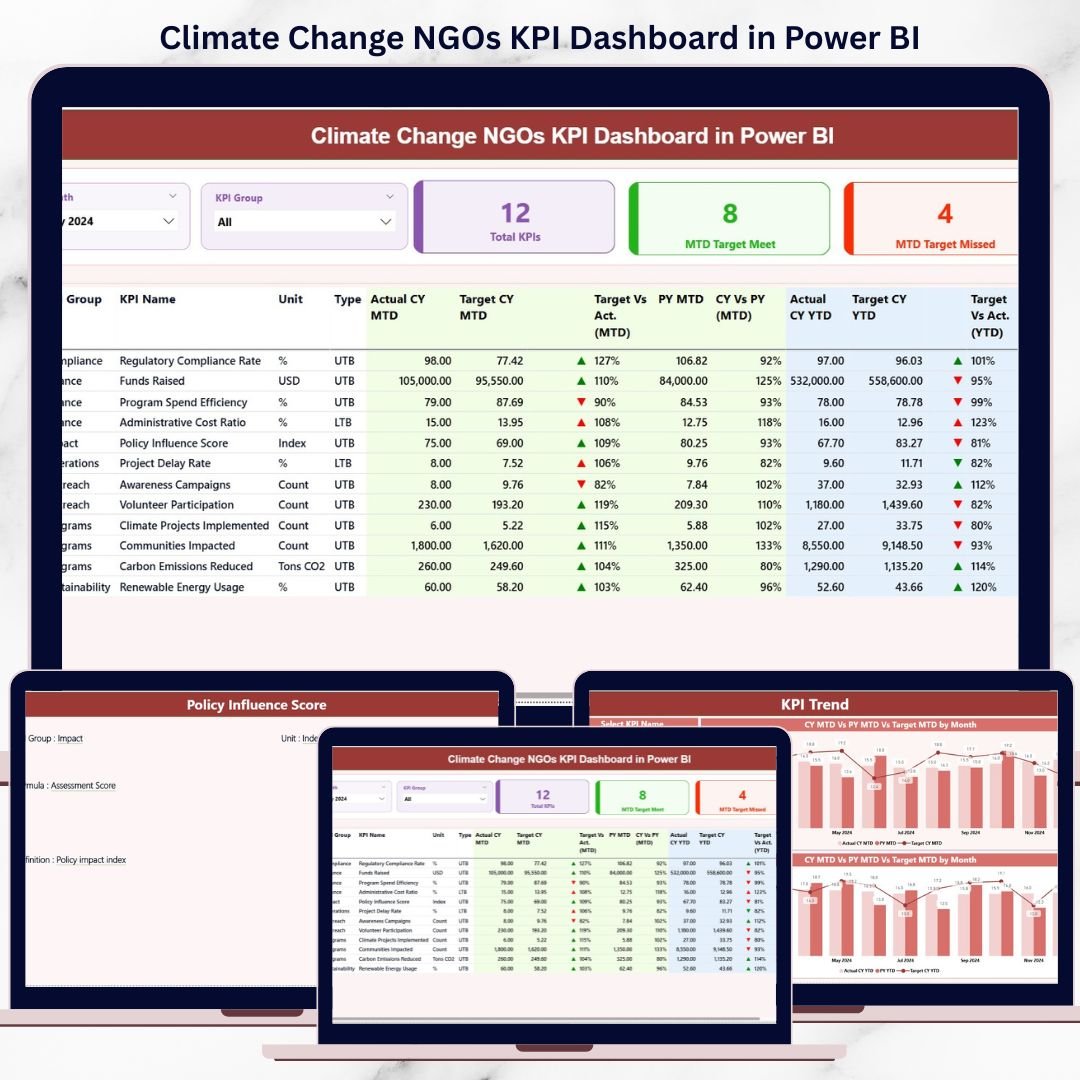
📦 What’s Inside the Climate Change NGOs KPI Dashboard in Power BI
This professionally designed Power BI file includes three powerful analytical pages; each built for a specific reporting need:
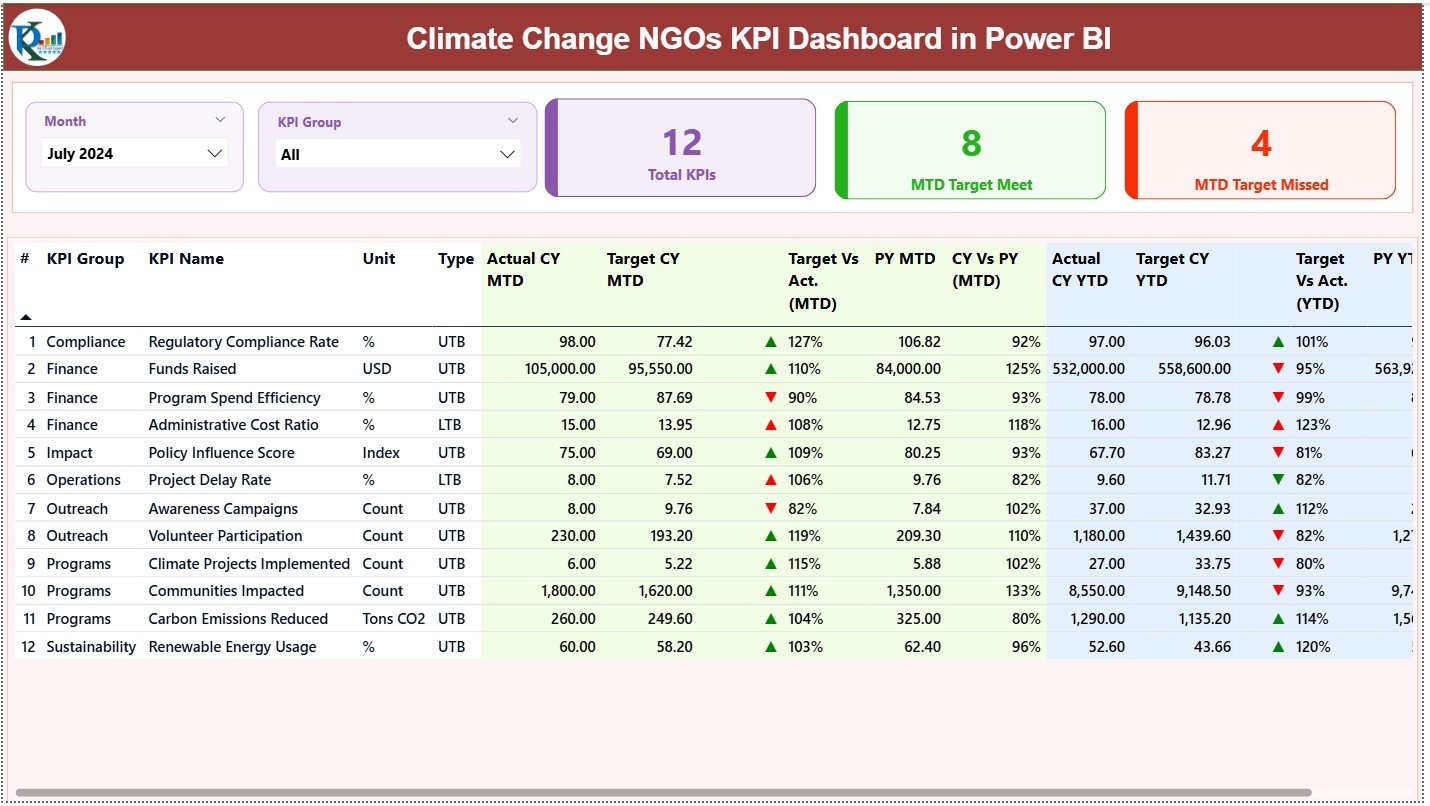
📊 Summary Page
The main overview page with:
-
Month and KPI Group slicers
-
KPI cards showing Total KPIs, MTD Target Met, and MTD Target Missed
-
A detailed KPI table displaying Actual, Target, Previous Year values for both MTD and YTD
-
Visual indicators (▲▼) for quick performance identification
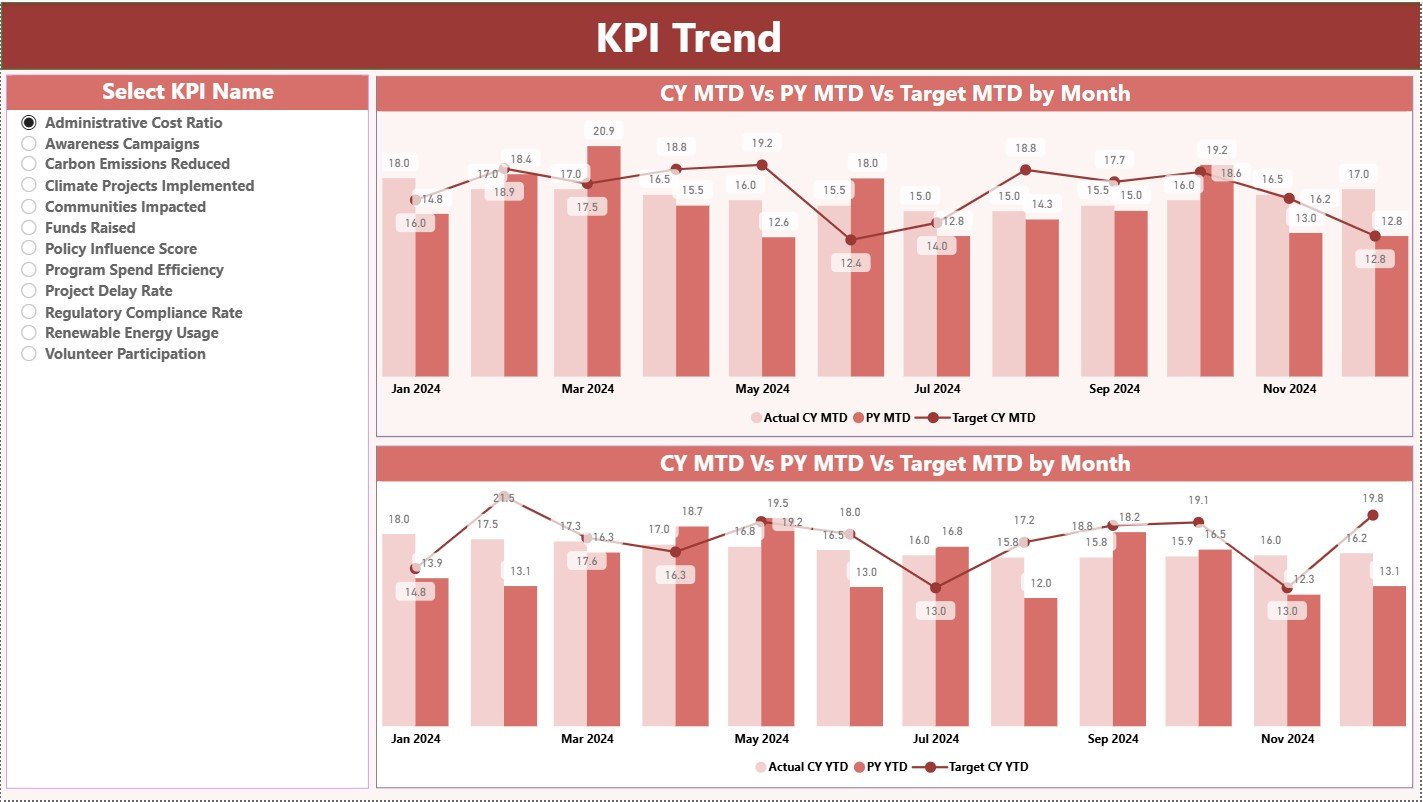
📉 KPI Trend Page
Analyze trends over time using:
-
KPI Name slicer
-
MTD trend combo chart (Actual, Target, PY)
-
YTD trend combo chart (Actual, Target, PY)
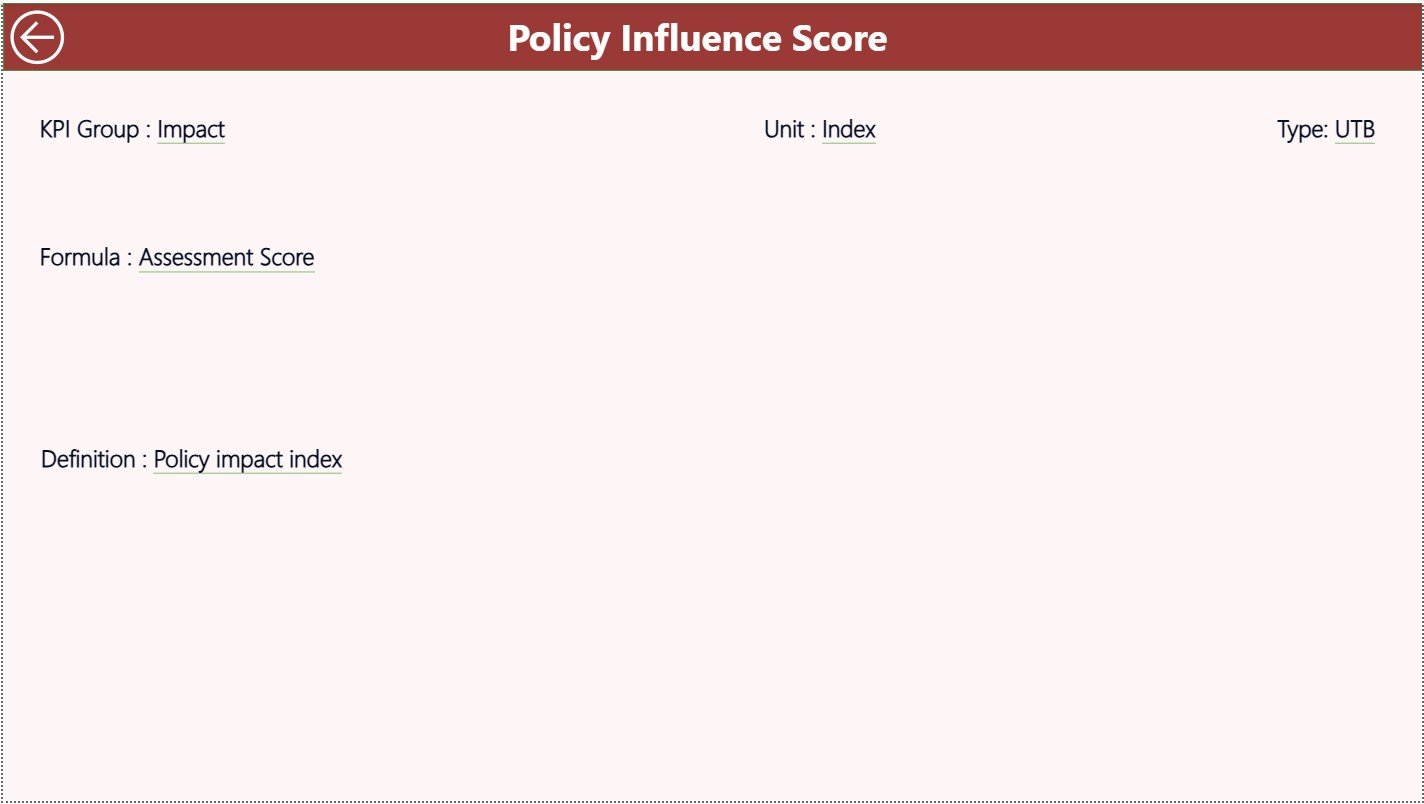
📘 KPI Definition Page (Drill-Through)
View KPI logic including:
-
KPI formula
-
KPI definition
-
KPI type (LTB or UTB)
In addition, the dashboard connects to a structured Excel input file containing Actuals, Targets, and KPI Definitions—making updates fast and error-free.
How to Use the Climate Change NGOs KPI Dashboard in Power BI
Using this dashboard is simple and practical—even for non-technical users:
1️⃣ Enter monthly Actual MTD and YTD values in Excel
2️⃣ Define Target MTD and YTD values
3️⃣ Maintain KPI definitions and types
4️⃣ Refresh Power BI
5️⃣ Instantly view updated visuals and insights
Because calculations are automated, NGOs spend less time on reporting and more time on driving real climate impact 🌱.
👥 Who Can Benefit from This Climate Change NGOs KPI Dashboard in Power BI
This dashboard is ideal for:
🌍 Climate Change NGOs & Environmental Nonprofits
📊 Monitoring & Evaluation Teams
💰 Donor Reporting & Grant Management Teams
📢 Sustainability & Impact Reporting Teams
📈 NGO Leadership & Strategy Teams
Whether you manage awareness campaigns, emission reduction projects, or sustainability programs, this dashboard helps you communicate results clearly and confidently.


Reviews
There are no reviews yet.