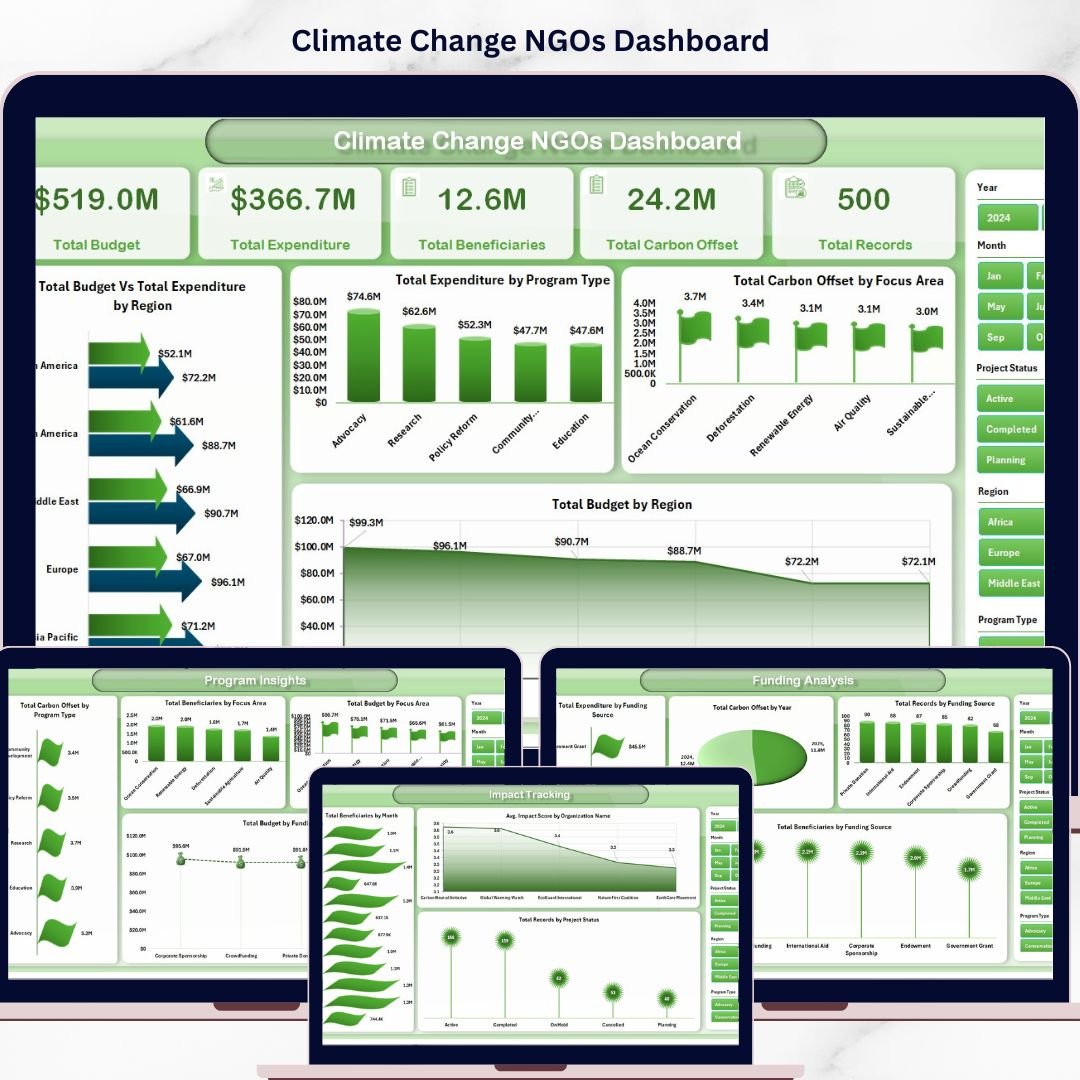

Climate Change NGOs Dashboard in Excel is a professionally designed, ready-to-use analytics solution built for environmental organizations that need to visualize budgets, expenditures, carbon offsets, beneficiaries, and regional performance across their climate programs. If your NGO is still using scattered spreadsheets and manual reports to manage performance data, this Excel dashboard will transform the way you track, analyze, and communicate your climate impact 🌍📊.
This dynamic dashboard uses pivot tables and pivot charts to deliver interactive, filterable analysis across five powerful pages—covering overview metrics, regional breakdowns, program insights, funding analysis, and impact tracking. The data refreshes automatically when you update the Data Sheet and click Refresh All, making it an efficient and scalable reporting tool for NGOs of all sizes.
🔑 Key Features of Climate Change NGOs Dashboard in Excel
📊 Dynamic Pivot-Based Dashboard – All charts and analysis are powered by pivot tables, making the dashboard fully dynamic and refreshable with one click.
🎯 Multi-Page Analysis – Five dedicated analysis pages covering Overview, Regional Analysis, Program Insights, Funding Analysis, and Impact Tracking provide complete visibility into NGO operations.
🔍 Interactive Slicers for Quick Filtering – Multiple slicers on the Overview page allow you to instantly filter data by Region, Program Type, Focus Area, Funding Source, and more.
📈 Budget vs Expenditure Comparison – Visualize Total Budget against Total Expenditure by Region to identify spending efficiency and resource allocation gaps.
🌱 Carbon Offset Tracking – Monitor Total Carbon Offset by Focus Area and by Year to measure the environmental impact of your programs over time.
🤝 Beneficiary and Volunteer Analysis – Track Total Beneficiaries by Country and Total Volunteers by Region to evaluate outreach and community engagement.
💰 Funding Source Breakdown – Understand how funds are distributed across different funding sources and how expenditures align with donor expectations.
⚡ One-Click Refresh – Update data in the Data Sheet, go to Data tab → Refresh All, and every chart and pivot refreshes automatically—no manual editing required.
 Climate Change NGOs Dashboard
📦 What’s Inside the Climate Change NGOs Dashboard in Excel
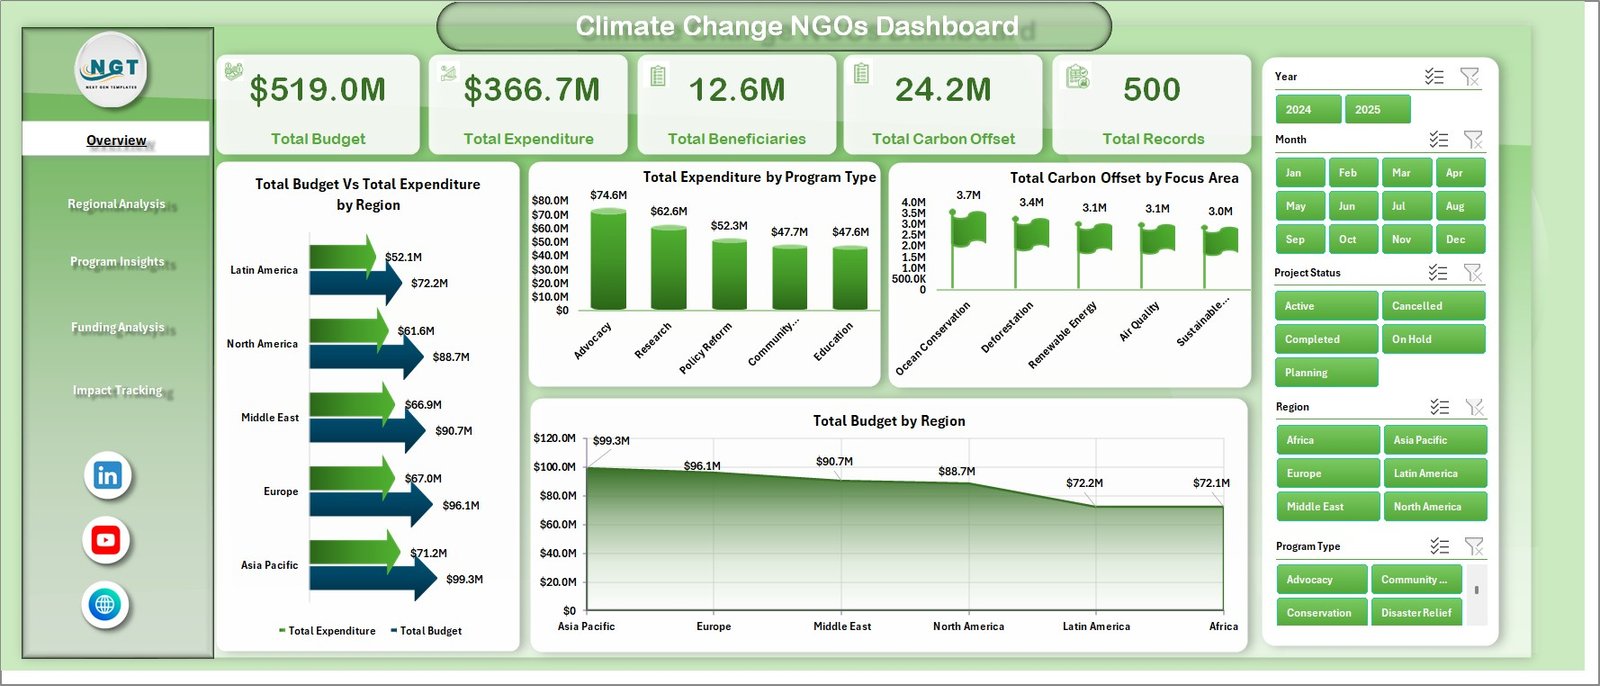
📊 Overview Page – The main summary page displays high-level KPI cards including Total Budget, Total Expenditure, Total Beneficiaries, Total Carbon Offset, and Total Records. Below, interactive charts show Total Budget vs Total Expenditure by Region, Total Expenditure by Program Type, Total Carbon Offset by Focus Area, and Total Budget by Region. Multiple slicers allow instant filtering for focused analysis.
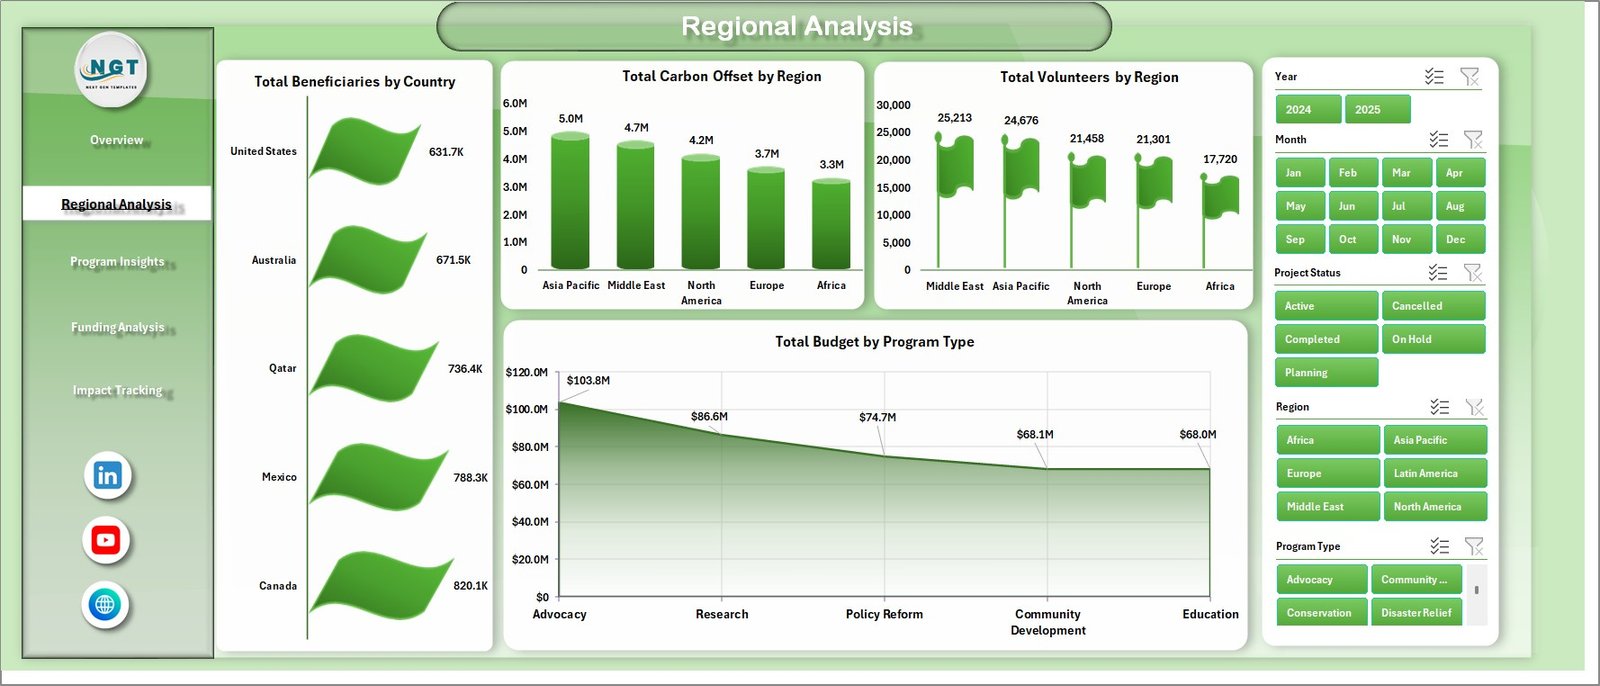
🌍 Regional Analysis Page – Dive deep into geographic performance with charts showing Total Beneficiaries by Country, Total Carbon Offset by Region, Total Volunteers by Region, and Total Budget by Program Type.
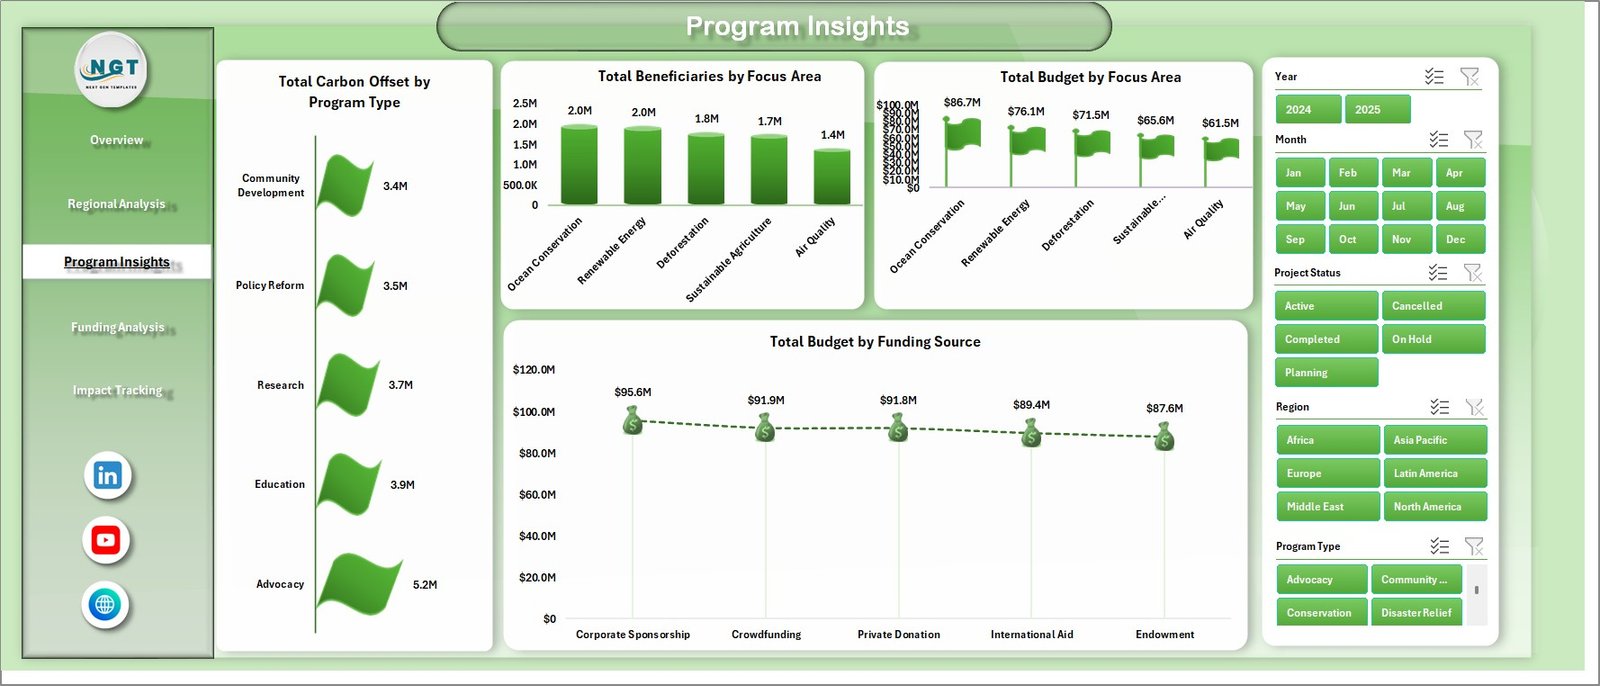
📋 Program Insights Page – Analyze program-level effectiveness through Total Carbon Offset by Program Type, Total Beneficiaries by Focus Area, Total Budget by Focus Area, and Total Budget by Funding Source.
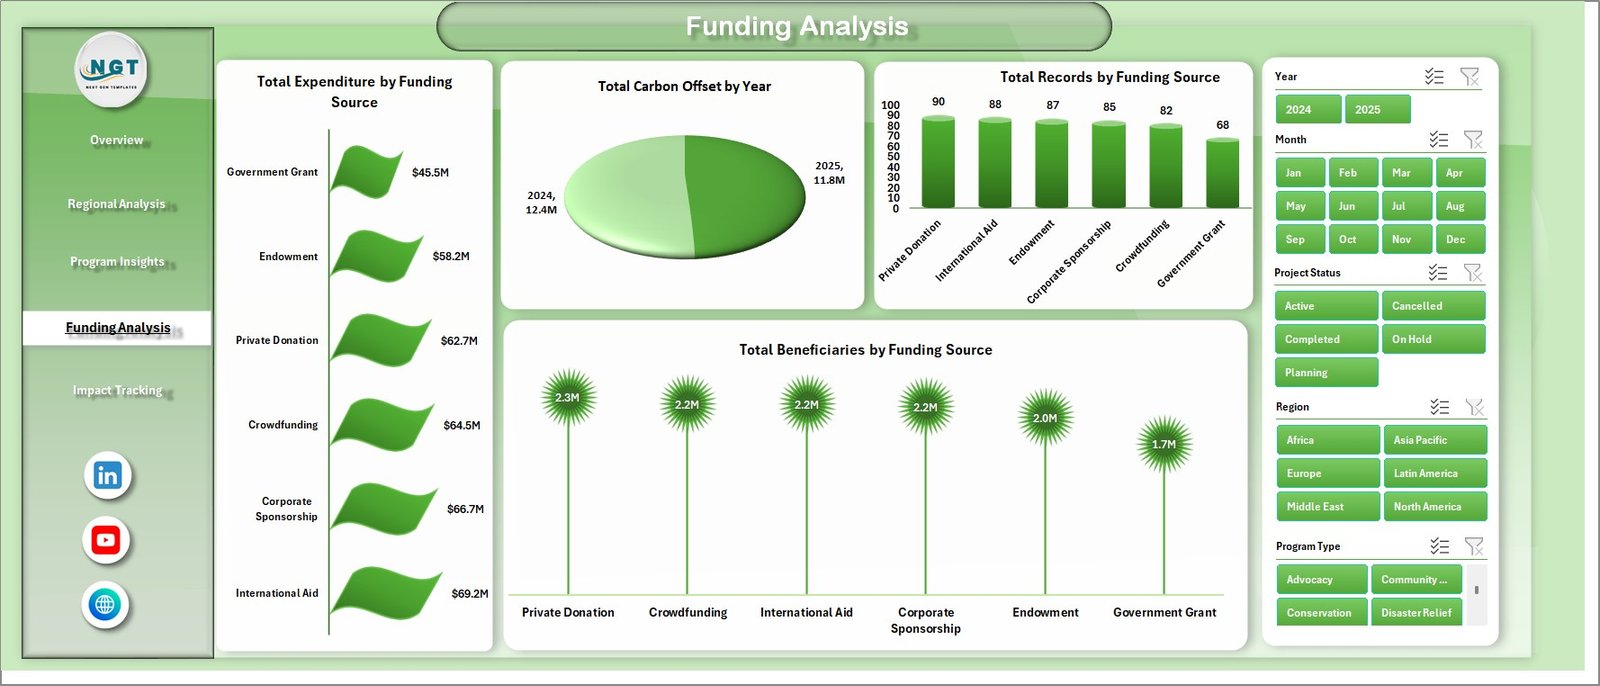
💰 Funding Analysis Page – Track funding efficiency with Total Expenditure by Funding Source, Total Carbon Offset by Year, Total Records by Funding Source, and Total Beneficiaries by Funding Source.
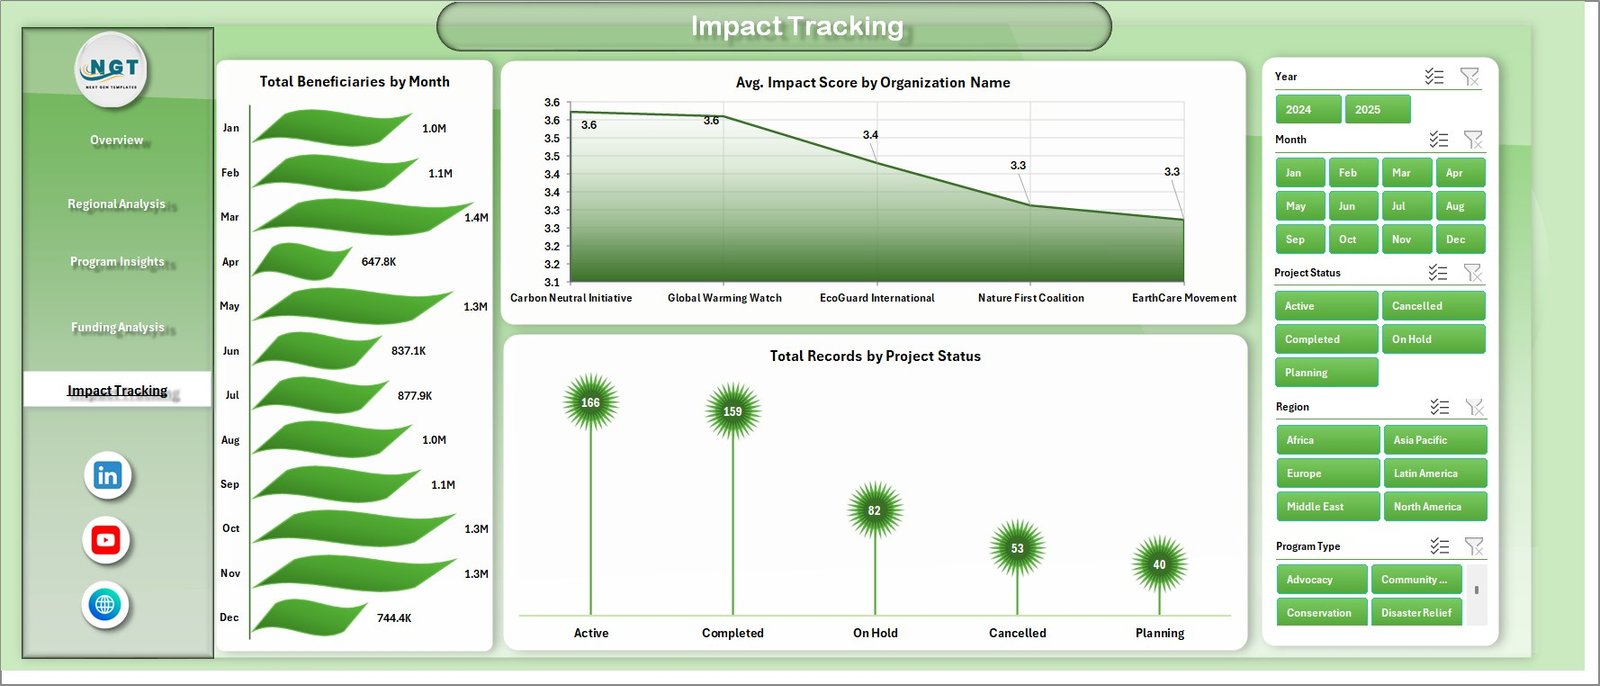
📈 Impact Tracking Page – Monitor impact trends through Total Beneficiaries by Month, Average Impact Score by Organization Name, and Total Records by Project Status to evaluate the effectiveness of your climate initiatives.
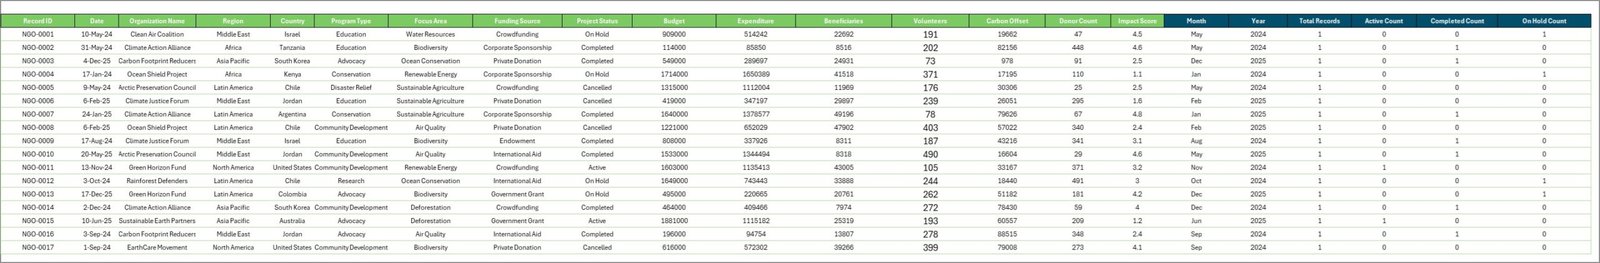
📂 Data Sheet – The structured data input sheet where you add or update your NGO operational data in a consistent tabular format. This sheet powers all the pivot tables and charts across the dashboard.
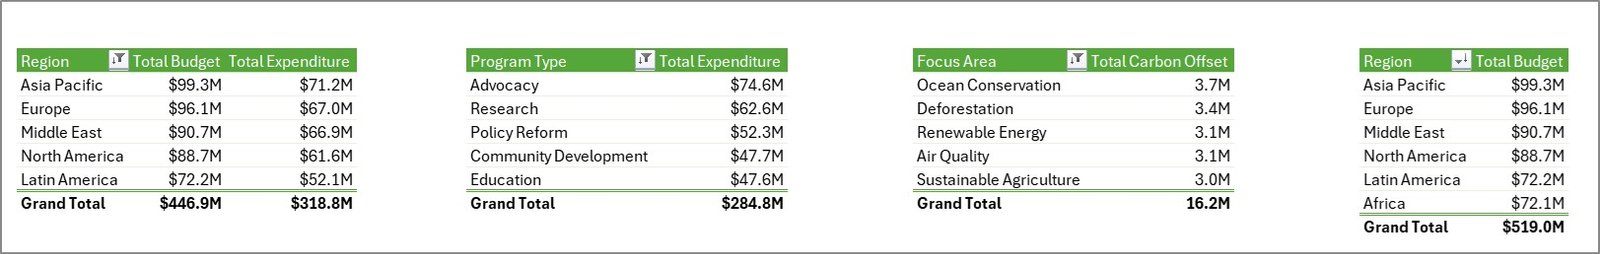
🔧 Support Sheet – Contains all pivot tables that drive the dashboard. After updating the Data Sheet, simply click Refresh All to update every pivot and chart. You can keep this sheet hidden during presentations.
⚙️ How to Use the Climate Change NGOs Dashboard in Excel
1️⃣ Open the Data Sheet and enter your NGO’s operational data in the same format
2️⃣ Go to the Data tab in the Excel Ribbon and click Refresh All
3️⃣ All pivot tables in the Support Sheet will refresh automatically
4️⃣ All charts across all five dashboard pages update instantly
5️⃣ Use slicers on the Overview page to filter and explore your data dynamically
👥 Who Can Benefit from This Climate Change NGOs Dashboard in Excel
🌱 Climate Change NGOs & Environmental Organizations – Visualize program performance and climate impact clearly
📊 Monitoring & Evaluation Teams – Track budgets, beneficiaries, and outcomes across programs and regions
💰 Donor Reporting & Grant Management Teams – Present transparent, data-backed reports to donors and stakeholders
📈 Sustainability & Program Managers – Optimize resource allocation and measure environmental outcomes
🏛️ Government & Policy Organizations – Analyze NGO performance data for evidence-based policy decisions
📖 Click here to read the Detailed Blog Post
🎥 Visit our YouTube channel to learn step-by-step video tutorials
👉 YouTube.com/@NextGenTemplates


Reviews
There are no reviews yet.