The cement industry operates with a high level of complexity—from raw material extraction to kiln operations, clinker production, quality control, packaging, logistics, and sales. Every stage impacts the final output, efficiency, and profitability. To manage such a dynamic environment, cement companies need clear, accurate, and real-time performance insights. This is exactly where the Cement Industry KPI Dashboard in Excel becomes a game-changer.
Designed for plant managers, quality teams, production supervisors, safety departments, and senior leadership, this dashboard organizes all operational KPIs into one simple, visual, and ready-to-use Excel file. Whether you’re tracking energy consumption, kiln running hours, machine downtime, dispatch volume, or safety incidents, this template gives you complete control over your manufacturing operations—without expensive software.
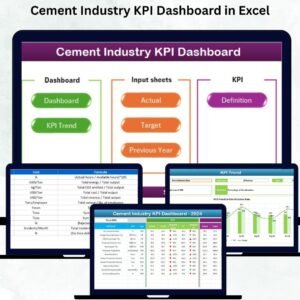
With dynamic dropdowns, MTD/YTD insights, Actual vs Target comparisons, Previous Year integration, trend charts, and color-coded indicators, this dashboard helps you make faster, smarter, and data-backed decisions across your entire cement manufacturing ecosystem.
✨ Key Features of the Cement Industry KPI Dashboard in Excel
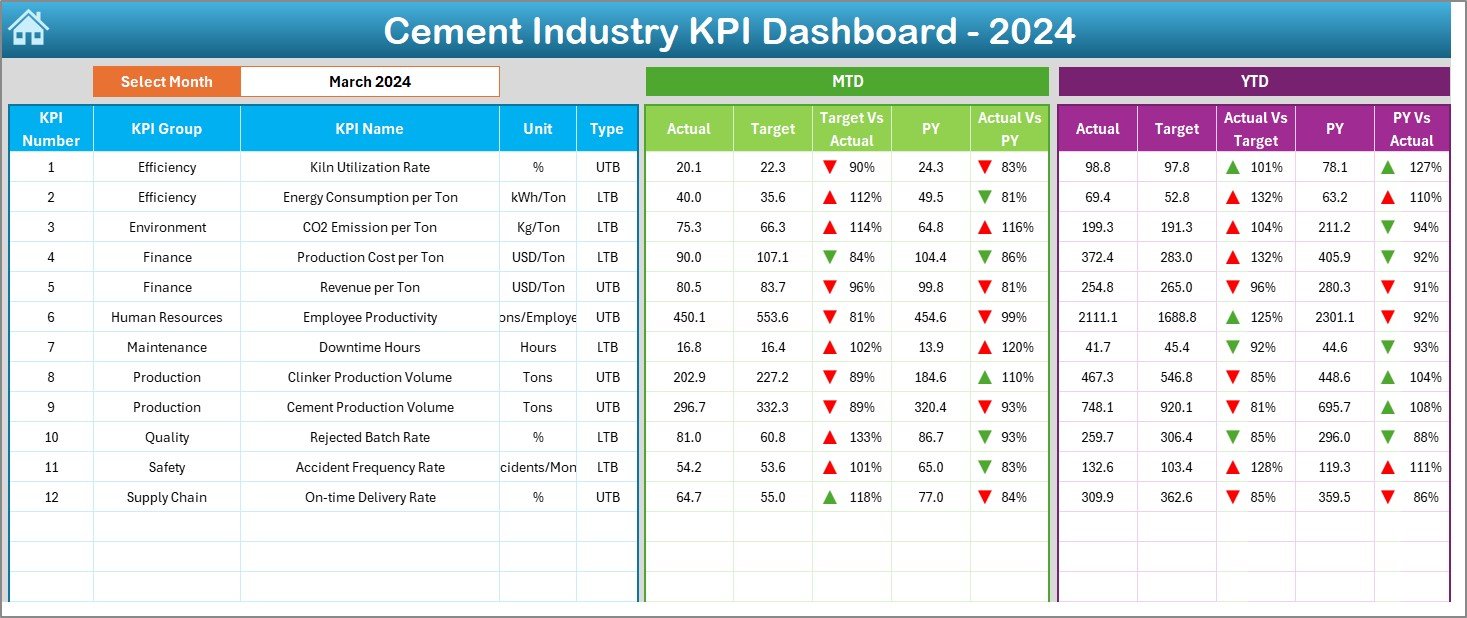
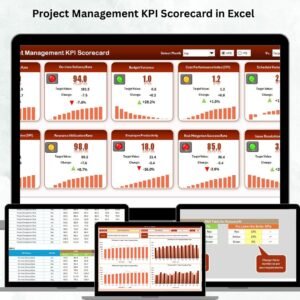
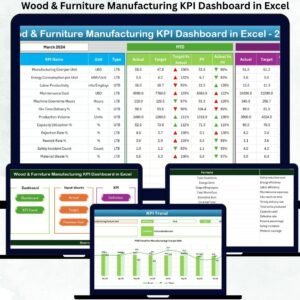
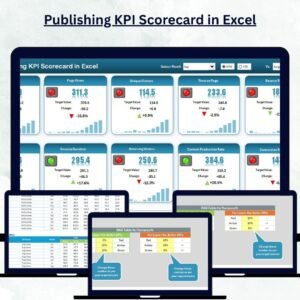
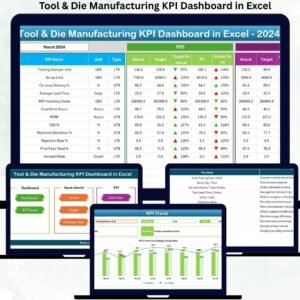
📊 Main Dashboard with Real-Time Insights
The Dashboard Sheet is your central performance hub.
-
Select any month using the dropdown in cell D3
-
View MTD and YTD values
-
Compare Actual vs Target and Actual vs Previous Year
-
Instantly identify good or poor performance using color-coded icons
This gives teams a complete monthly performance snapshot in seconds.
🎯 Actual vs Target Tracking (MTD & YTD)
Quickly see whether KPIs hit or missed their targets.
Green arrows indicate positive performance, while red arrows show decline—helping managers focus on problem areas immediately.
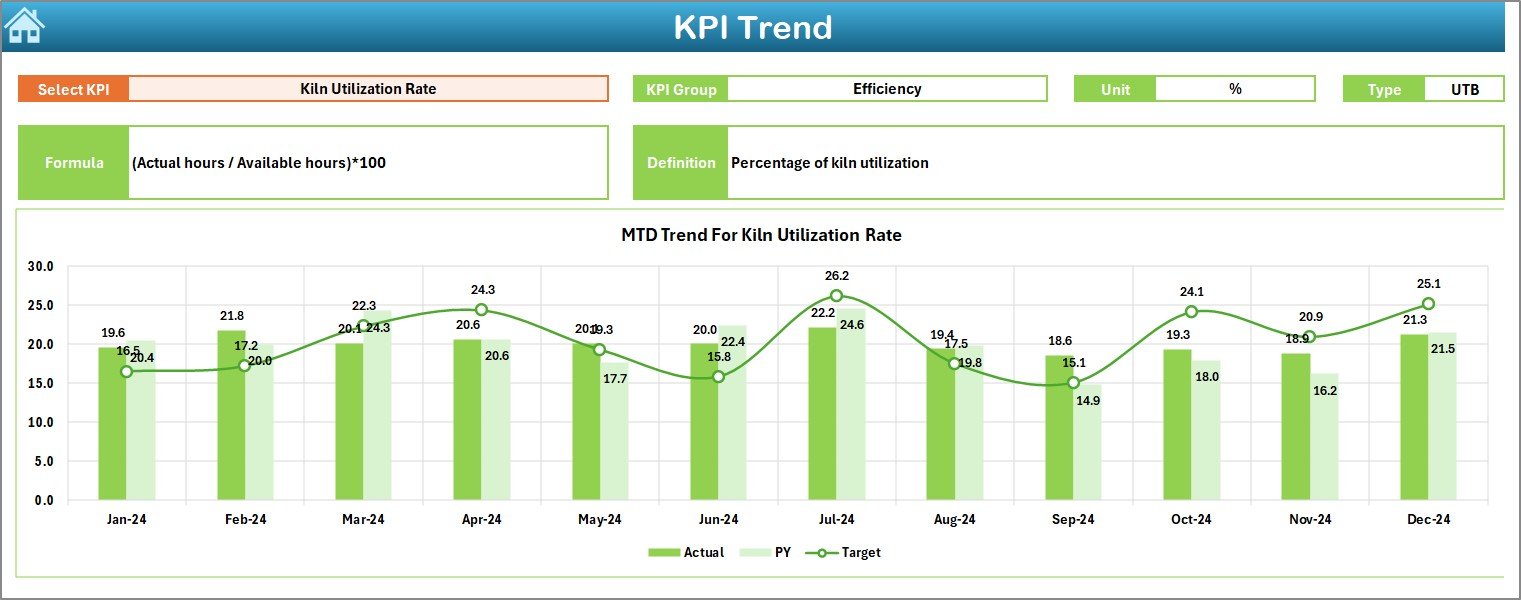
📈 KPI Trend Analysis (MTD & YTD Charts)
The KPI Trend Sheet allows deep analysis of every metric.
-
Select KPI from dropdown (cell C3)
-
View KPI Group, Unit, Formula & Definition
-
Analyze MTD and YTD charts for Actual, Target & Previous Year
This helps you understand patterns, seasonal behavior, and performance shifts.
🧮 Excel-Based, Fully Automated Calculations
No manual formulas or complex steps. The dashboard updates automatically when you refresh the file, saving hours of reporting time every month.
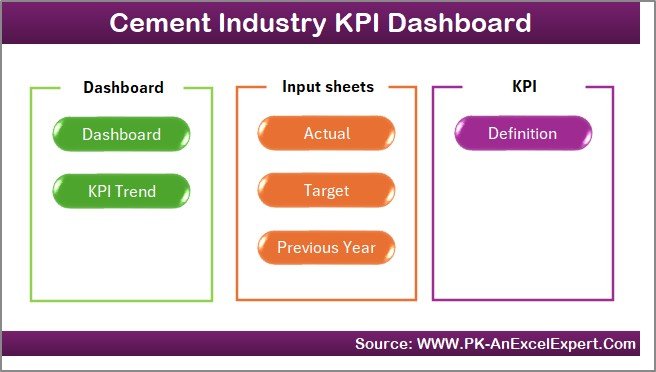
📘 What’s Inside the Cement Industry KPI Dashboard in Excel
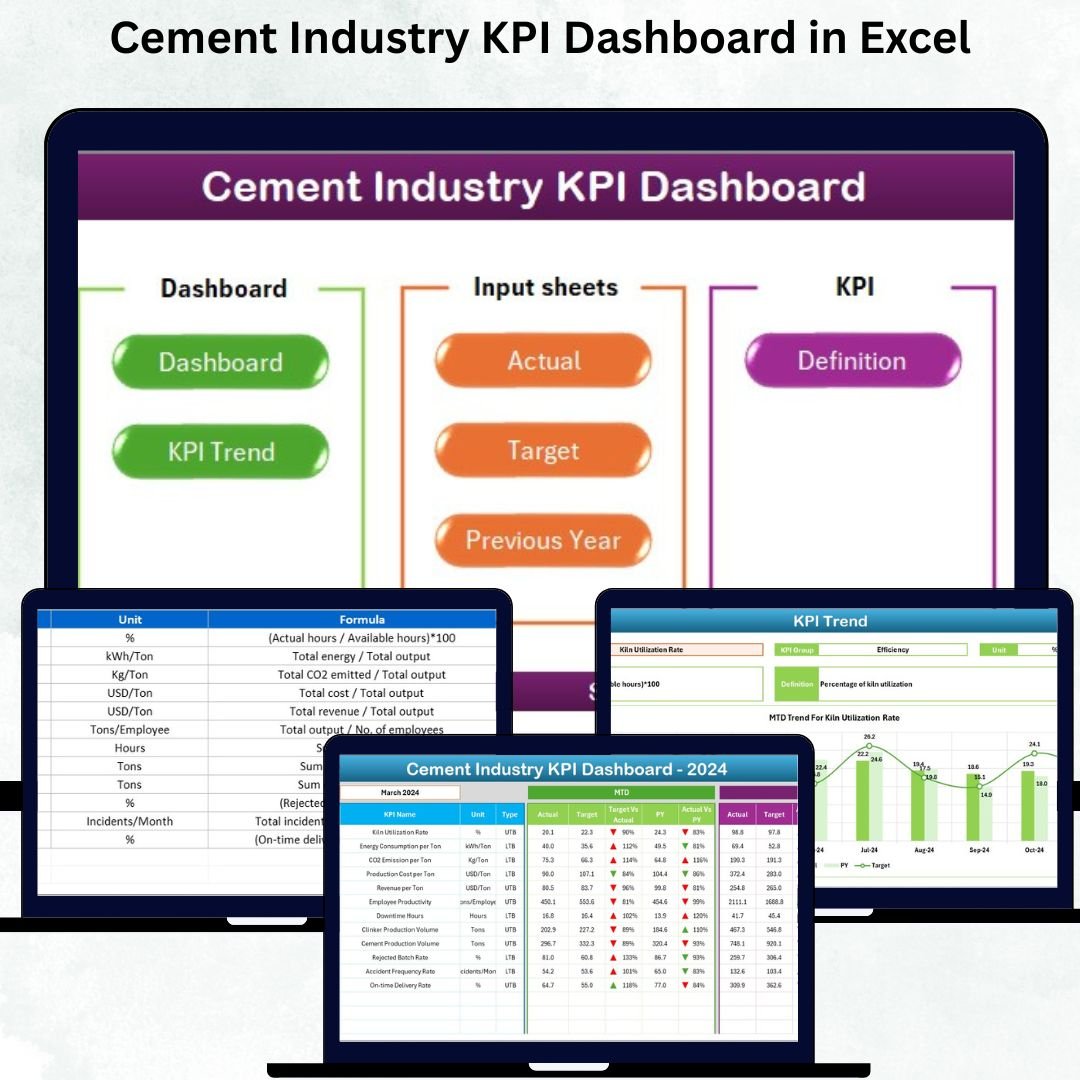
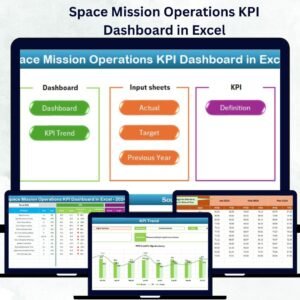
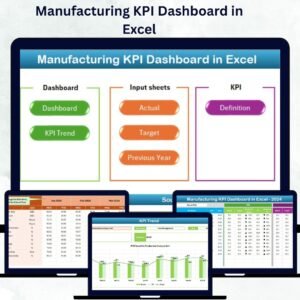
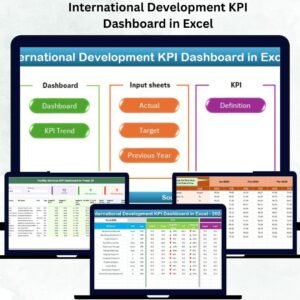
1️⃣ Home Sheet – Quick Navigation Panel
Jump across sheets instantly using navigation buttons for Dashboard, KPI Trend, Input Sheets, and Definitions. Saves time and improves usability.
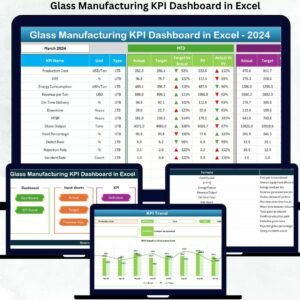
2️⃣ Dashboard Sheet – Complete KPI Monitoring
Displays:
-
MTD & YTD values
-
Actual vs Target
-
Actual vs Previous Year
-
Performance trend arrows
-
Color-coded indicators
This page is designed for high-impact presentations and quick reviews.
3️⃣ KPI Trend Sheet – Detailed KPI-wise Analytics
Includes:
-
KPI metadata (group, unit, formula, definition)
-
MTD & YTD trend charts
This helps you identify bottlenecks and performance improvements.
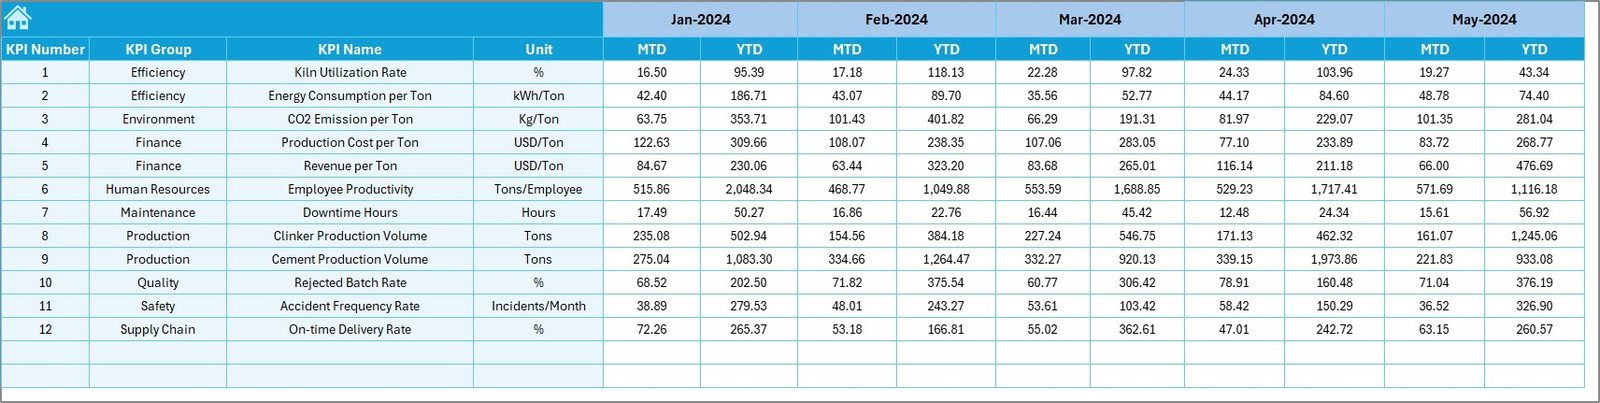
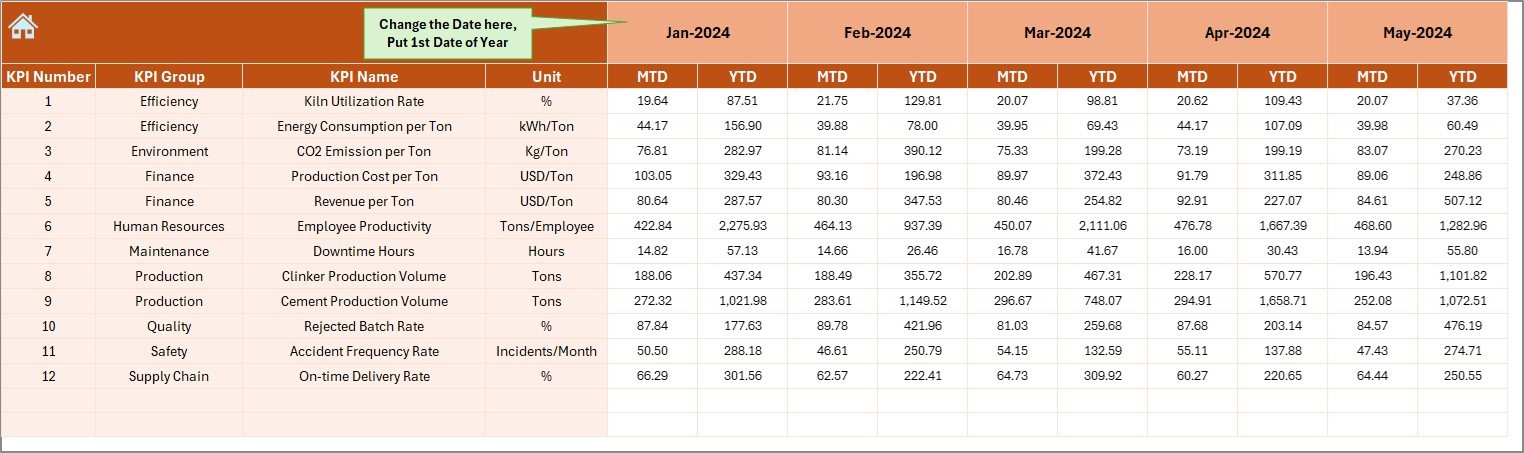
4️⃣ Actual Input Sheet
Enter monthly MTD and YTD KPI numbers.
Simple structure ensures easy and accurate data entry.
5️⃣ Target Input Sheet
Set monthly and yearly targets for every KPI.
This forms the foundation for all performance comparisons.
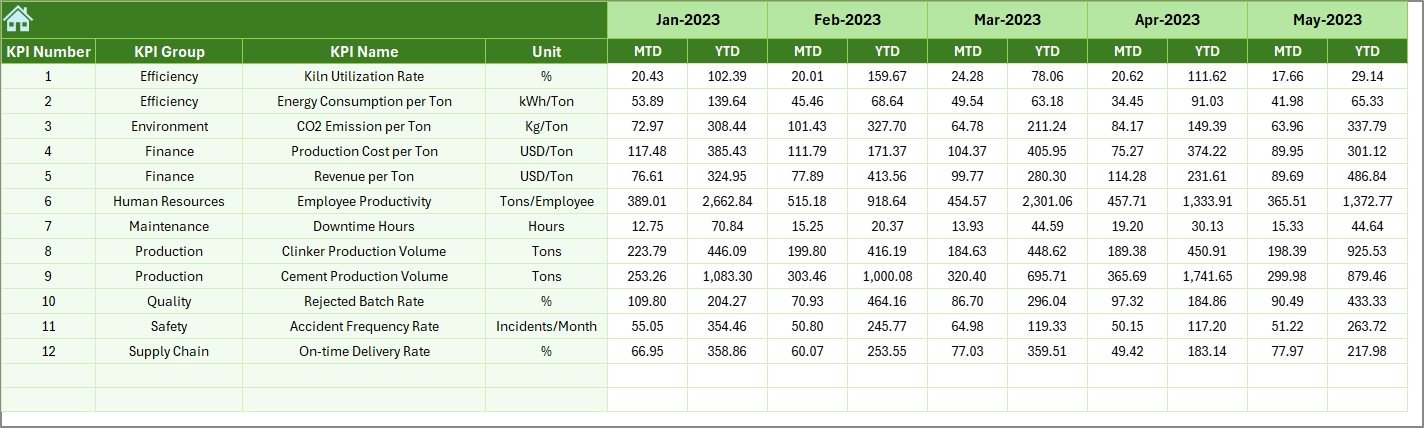
6️⃣ Previous Year Numbers Sheet
Enter last year’s MTD and YTD values to compare historical performance.
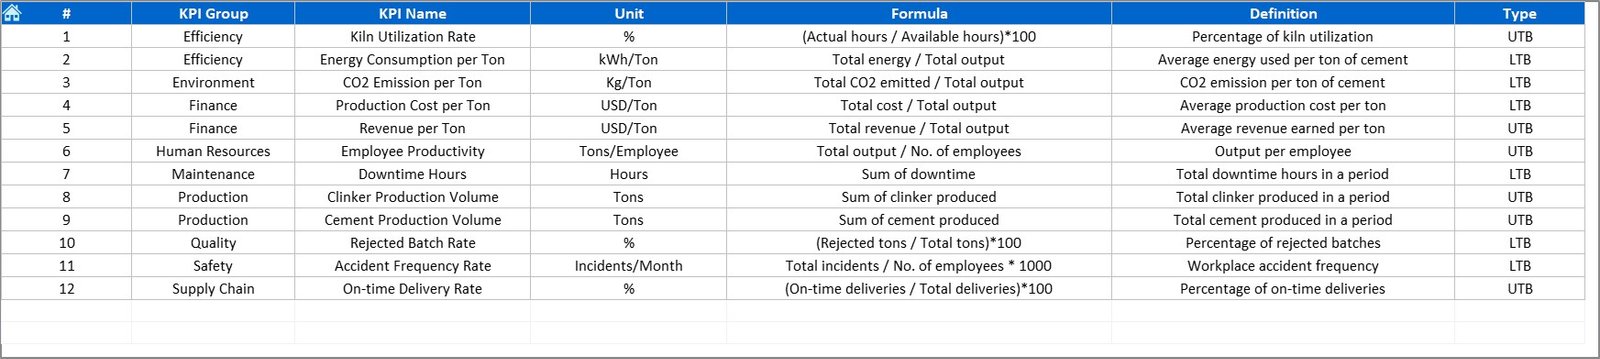
7️⃣ KPI Definition Sheet
Centralized KPI dictionary containing names, units, formulas, and definitions.
Perfect for training new team members and ensuring consistency.
🛠 How to Use the Cement Industry KPI Dashboard in Excel
Step 1: Update Actual, Target & Previous Year Sheets
Enter your values every month—do not change headers or formulas.
Step 2: Click Refresh All
Go to Data → Refresh All
All charts and tables update automatically.
Step 3: View Dashboard Outputs
Select month → Analyze performance with clean visuals.
Step 4: Drill into Trend Analysis
Use the KPI Trend Sheet to understand long-term behavior.
Step 5: Update KPI Definitions (Optional)
Add or edit KPIs anytime through the KPI Definition Sheet.
🎯 Who Can Benefit from This Cement Industry KPI Dashboard
👷 Plant Managers
Monitor production efficiency, clinker output, kiln performance, and downtime.
⚙️ Maintenance Teams
Track machine breakdowns, MTTR, PM compliance, and equipment health.
🧪 Quality Control Teams
Analyze product strength, fineness, raw mix variance, and compliance metrics.
🦺 Safety Departments
Monitor LTIFR, near misses, and safety training completion.
🚚 Sales & Dispatch Teams
Track dispatch volume, on-time delivery, revenue per ton, and dealer satisfaction.
📊 Senior Leadership
Get a complete operational performance view for strategic planning.


Reviews
There are no reviews yet.