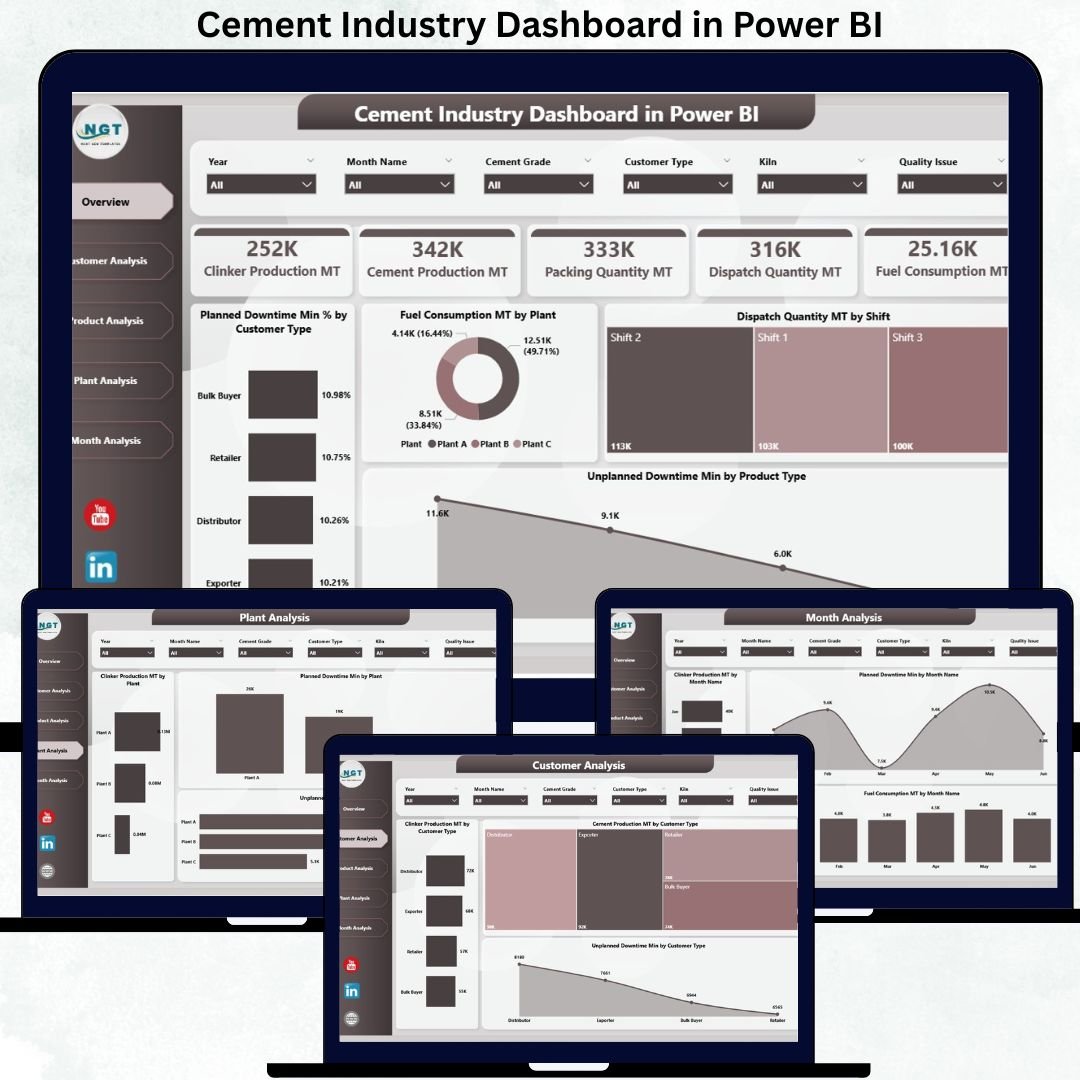
The cement industry is one of the most complex manufacturing environments, with continuous production cycles, heavy machinery, multi-plant operations, fuel-intensive processes, and strict quality requirements. Managing these operations manually often leads to delays, hidden issues, and inconsistent reporting. That’s why modern cement companies rely on a Cement Industry Dashboard in Power BI—a complete performance monitoring system that gives fast, reliable, and actionable insights.
This ready-to-use Power BI dashboard converts raw cement production data into meaningful visuals, KPIs, and trend analytics. It helps leaders, plant managers, and production teams monitor clinker production, cement output, downtime patterns, fuel consumption, dispatch performance, and customer demand with absolute clarity. With slicers, interactive charts, and drill-through capability, this dashboard makes data-based decision-making easier, faster, and more accurate.
⚡ Key Features of Cement Industry Dashboard in Power BI
This dashboard includes five analytical pages, each designed to help cement companies view performance from different angles.
📊 Overview Page – Instant Visibility of Key Operations
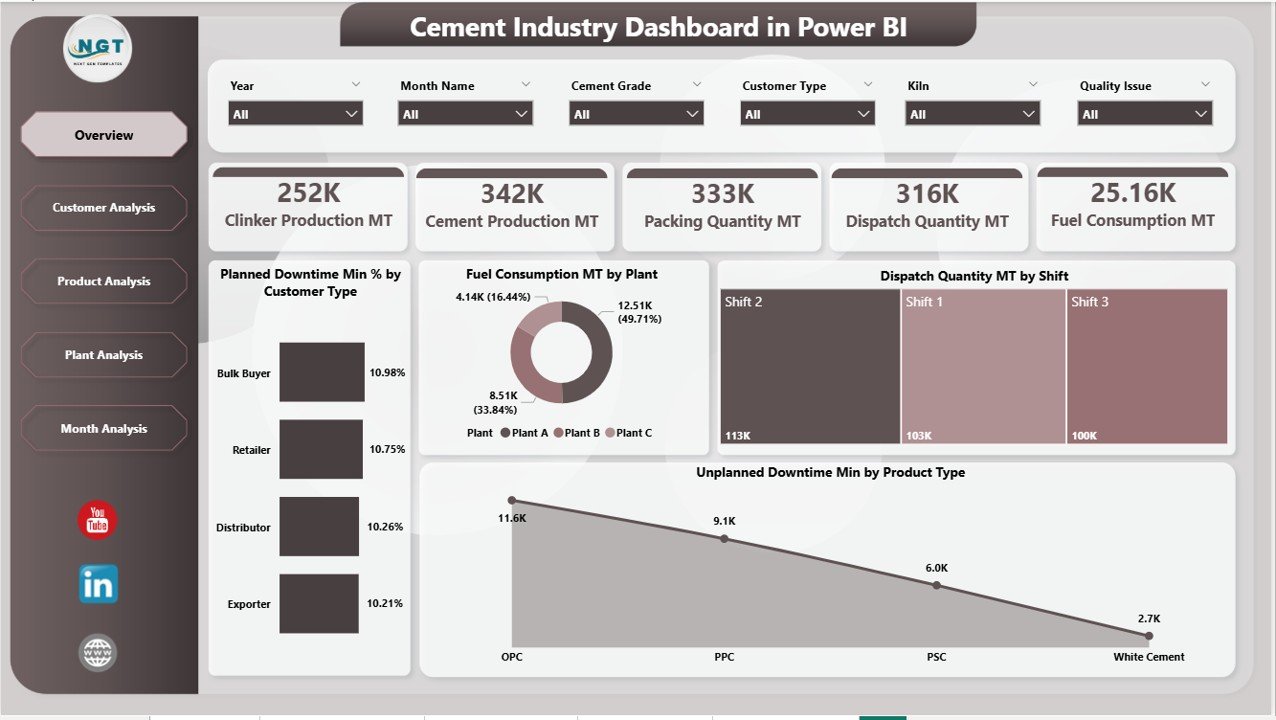
The Overview page works as the central performance hub.
It includes four essential KPI cards:
-
🧱 Total Clinker Production (MT)
-
⚙️ Total Cement Production (MT)
-
🕒 Total Planned Downtime (Min)
-
🔧 Total Unplanned Downtime (Min)
It also features four powerful visuals:
-
📉 Planned Downtime % by Customer Type
-
🔥 Fuel Consumption (MT) by Plant
-
🚚 Dispatch Quantity (MT) by Shift
-
⚠️ Unplanned Downtime (Min) by Product Type
With slicers for Month, Plant, Customer Type, and Product Type, users explore hundreds of insights in seconds.
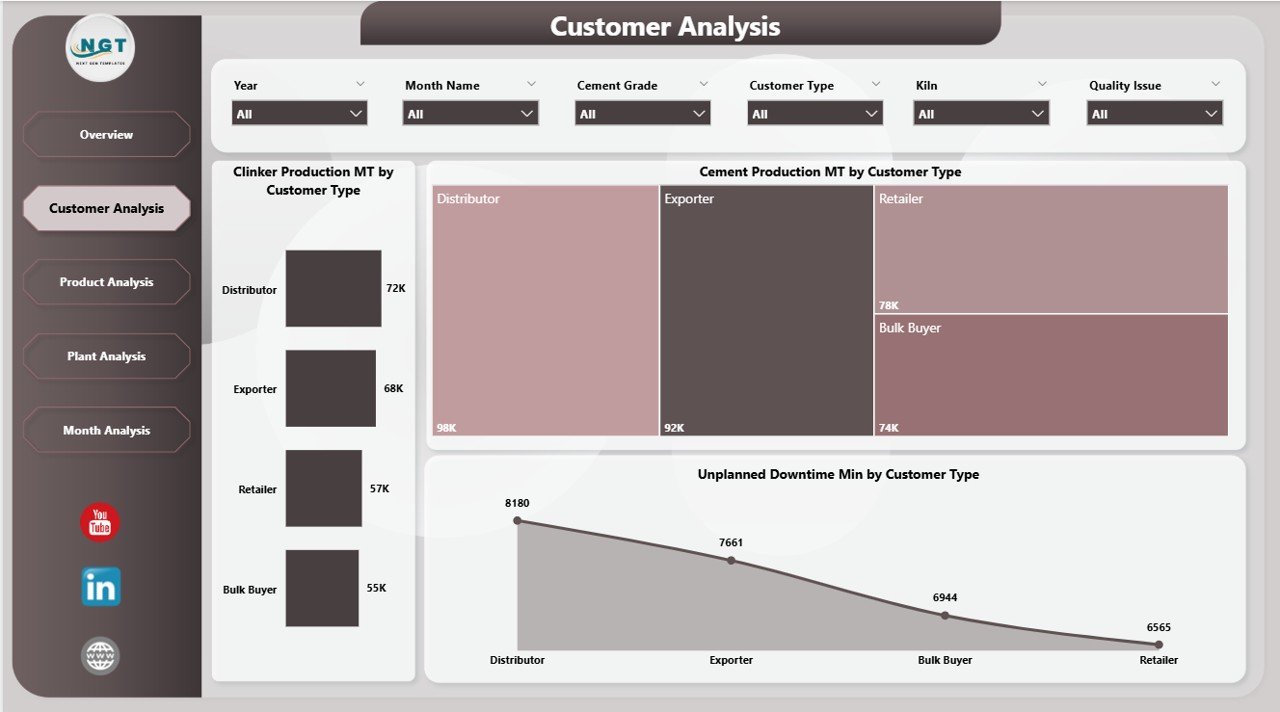
👥 Customer Analysis Page – Understand Customer-Driven Production
This page helps cement companies understand how different customer segments influence production and downtime.
It includes:
-
🧱 Clinker Production by Customer Type
-
🏗 Cement Production by Customer Type
-
⏱ Unplanned Downtime by Customer Type
These insights help teams optimize production planning and improve dispatch accuracy for various customer groups.
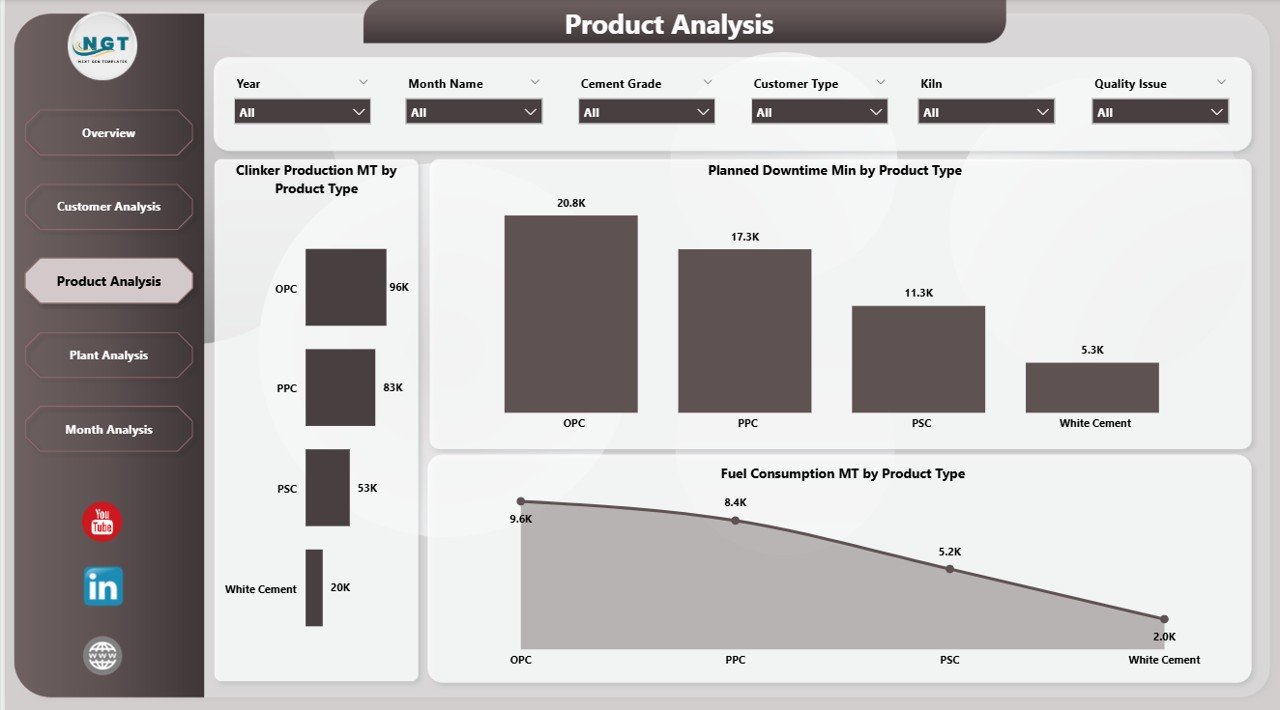
🧪 Product Analysis Page – Compare Performance Across Cement Types
Different cement types require different processing times, energy needs, and machine schedules.
This page offers:
-
🧱 Clinker Production by Product Type
-
🕒 Planned Downtime by Product Type
-
🔥 Fuel Consumption by Product Type
Managers use these insights to reduce cost, improve margin, and optimize product mix.
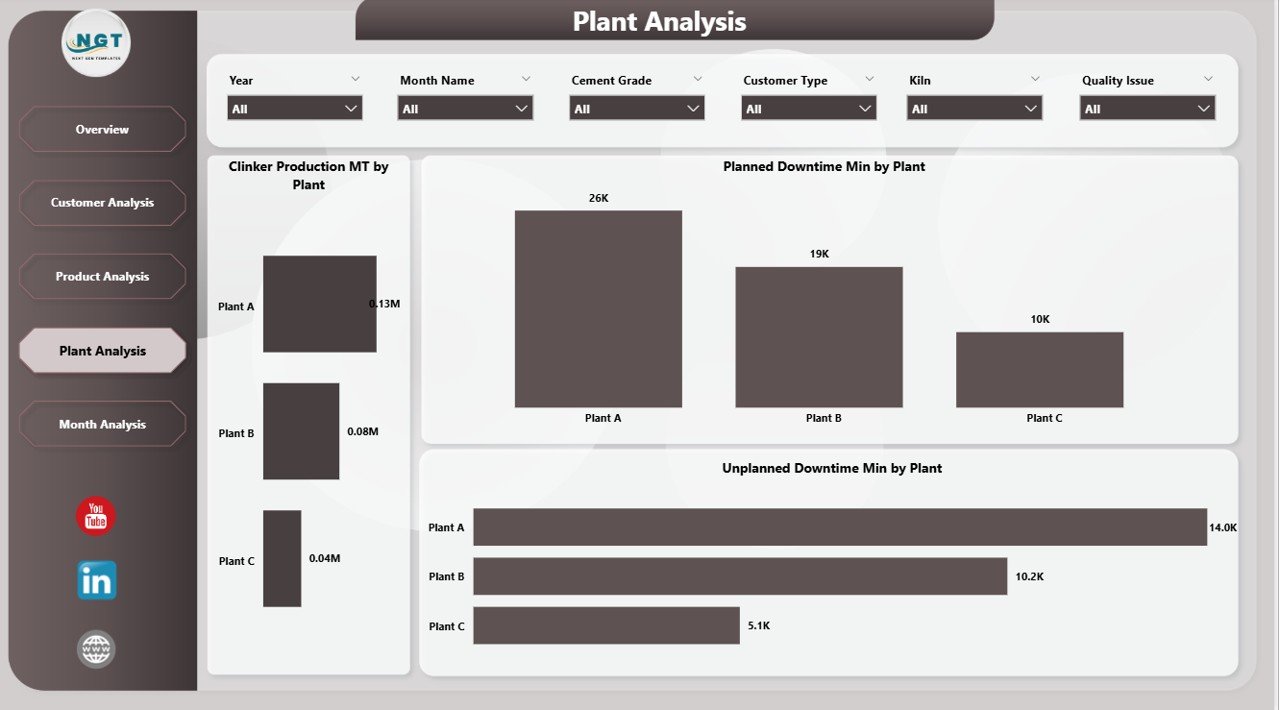
🏭 Plant Analysis Page – Benchmark Multi-Plant Operations
Most cement companies operate multiple plants. This page helps compare performance side-by-side.
It includes:
-
📈 Clinker Production by Plant
-
🕒 Planned Downtime by Plant
-
⚠️ Unplanned Downtime by Plant
The page highlights top-performing plants and plants needing operational improvements.
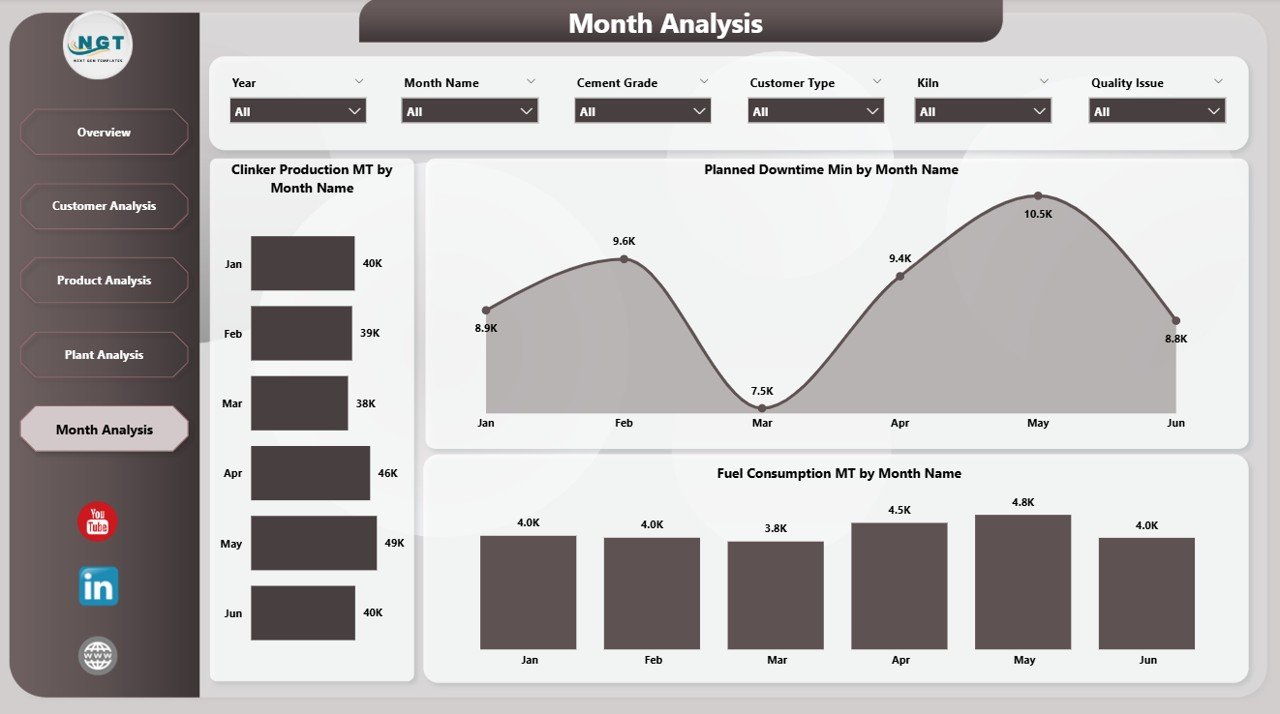
📅 Monthly Trends Page – Reveal Trends, Seasonality & Stability
Trend analysis is essential for forecasting and planning.
This page includes:
-
📈 Clinker Production by Month
-
🕒 Planned Downtime by Month
-
🔥 Fuel Consumption by Month
Managers use these insights to plan maintenance, optimize budgets, and predict production cycles.
📦 What’s Inside the Cement Industry Dashboard in Power BI
When you download the product, you get:
-
📁 Fully interactive Power BI (.pbix) file
-
📊 Structured Excel data source
-
🎛 Slicers for plant, month, customer type & product type
-
🔍 Drill-through analytics
-
📈 KPI cards, detailed tables, and trend charts
-
⚡ Auto-refresh functionality for instant updates
Everything is built for speed, clarity, and professional reporting.
🧭 How to Use the Cement Industry Dashboard in Power BI
Using the dashboard is extremely simple:
1️⃣ Enter or import data into the Excel file
2️⃣ Refresh the Power BI dashboard
3️⃣ Use slicers to filter performance
4️⃣ Explore the Overview, Customer, Product, Plant & Trend pages
5️⃣ Use insights to improve production and reduce downtime
No coding or technical skills needed.
👥 Who Can Benefit from This Dashboard?
This dashboard is ideal for:
-
🏭 Plant Managers
-
⚙️ Production Heads
-
🧪 Quality & Process Teams
-
🔧 Maintenance Teams
-
💼 Senior Management
-
🛠 Supply Chain & Dispatch Teams
If your goal is higher efficiency, reduced downtime, and better decision-making—this dashboard is essential.
### Click here to read the Detailed blog post
Visit our YouTube channel to learn step-by-step video tutorials
👉 Youtube.com/@PKAnExcelExpert


Reviews
There are no reviews yet.