Running a catering business requires more than culinary talent — it demands precision, tracking, and smart decision-making 🍽️. The Catering Business KPI Dashboard in Google Sheets is a ready-to-use, automated, and visual performance management system designed to help catering entrepreneurs, restaurant owners, and event managers monitor every key metric in one place.
This dashboard transforms complex catering data into actionable insights — enabling you to measure sales, costs, and performance trends effortlessly, anytime, anywhere.
✳️ Key Features of the Catering Business KPI Dashboard in Google Sheets
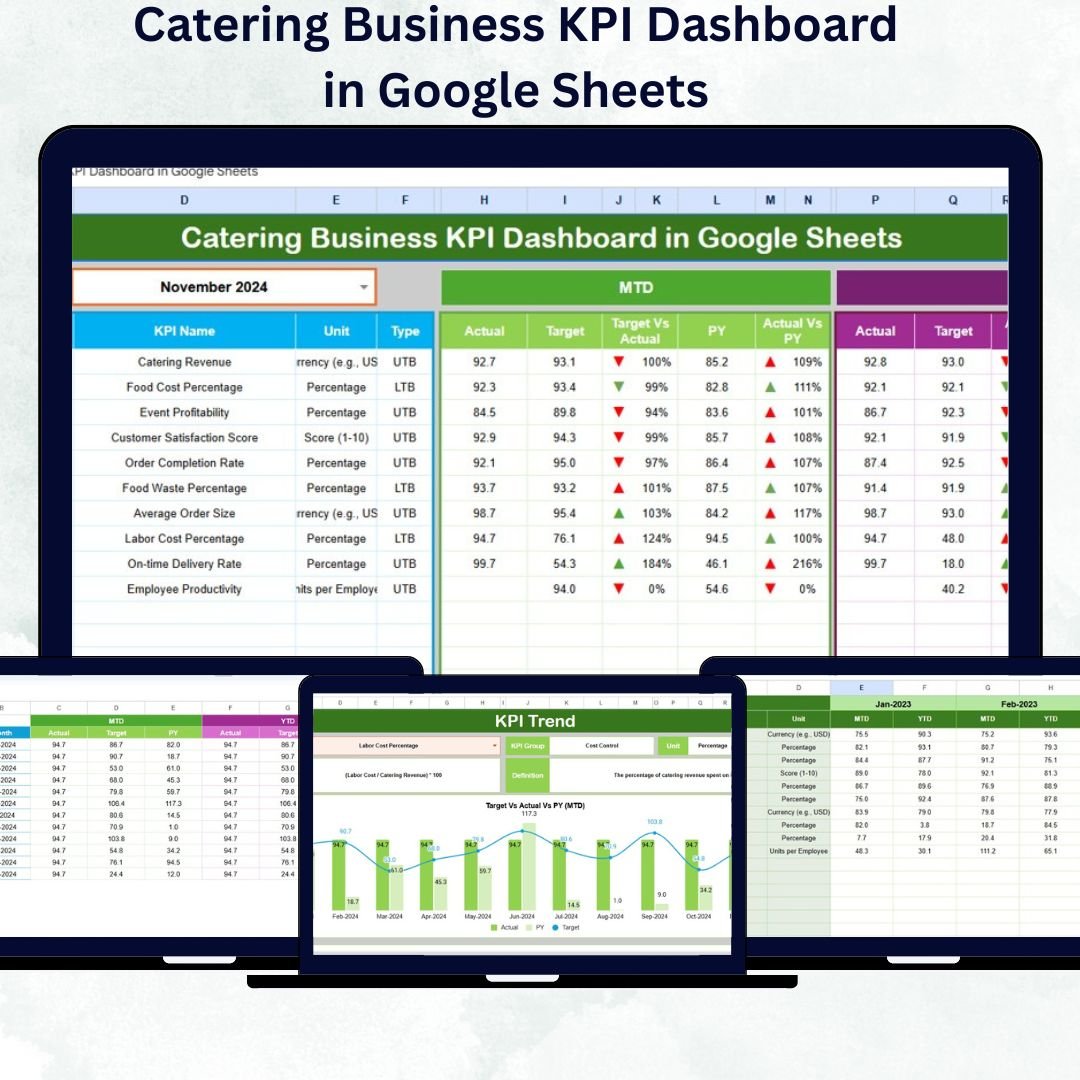
✅ Interactive Dashboard: Choose any month from a drop-down menu (cell D3) and instantly view updated KPIs such as revenue, customer satisfaction, food cost, and staff productivity.
📊 MTD & YTD Analysis: Track Month-to-Date and Year-to-Date results against Targets and Previous Year with clear up/down arrows for quick visual understanding.
📈 Automated Trend Charts: Get real-time visualization for each KPI’s trend. Spot performance shifts and take corrective actions early.
⚙️ Fully Customizable: Add, remove, or modify KPIs based on your unique business goals — all without writing a single formula!
📂 Real-Time Collaboration: Google Sheets enables multiple users to edit and view performance data at once, making teamwork seamless.
💡 Built-In Formulas: Eliminate manual reporting. Every calculation — from revenue growth to cost efficiency — runs automatically.
🔒 Data Accuracy & Integrity: Protect formulas, use drop-downs for data validation, and ensure consistent results every time.
📦 What’s Inside the Catering Business KPI Dashboard in Google Sheets
This professional dashboard template includes 6 well-organized worksheets, each designed to make performance management simple and effective:
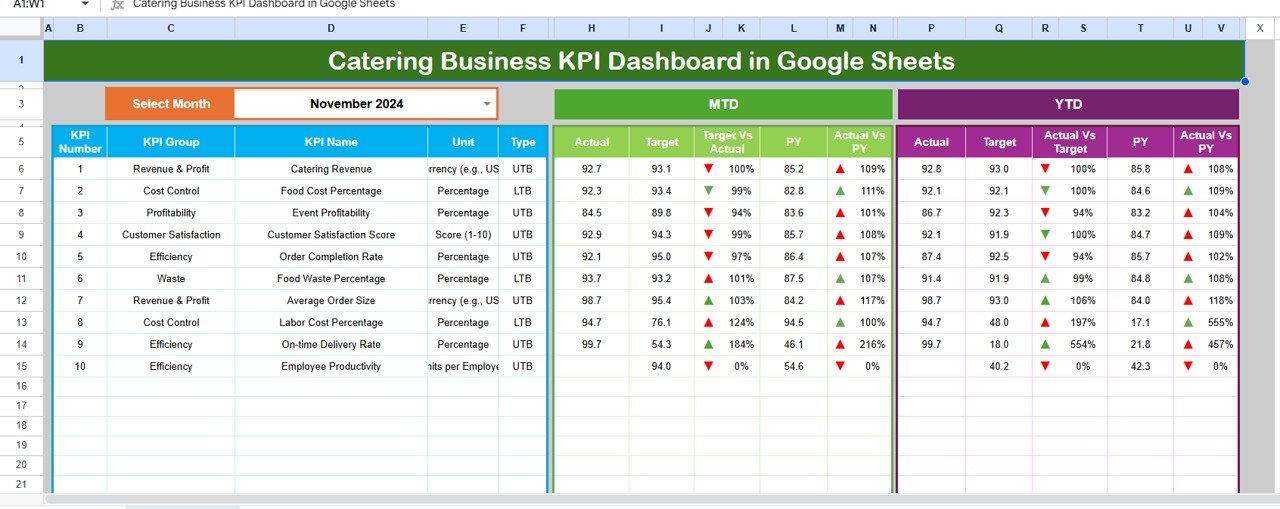
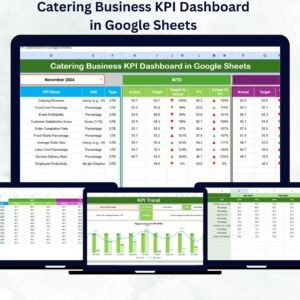
1️⃣ Dashboard Sheet Tab:
The main control center that summarizes KPIs visually. It shows MTD vs Target vs Previous Year and YTD vs Target vs Previous Year using dynamic charts and conditional arrows.
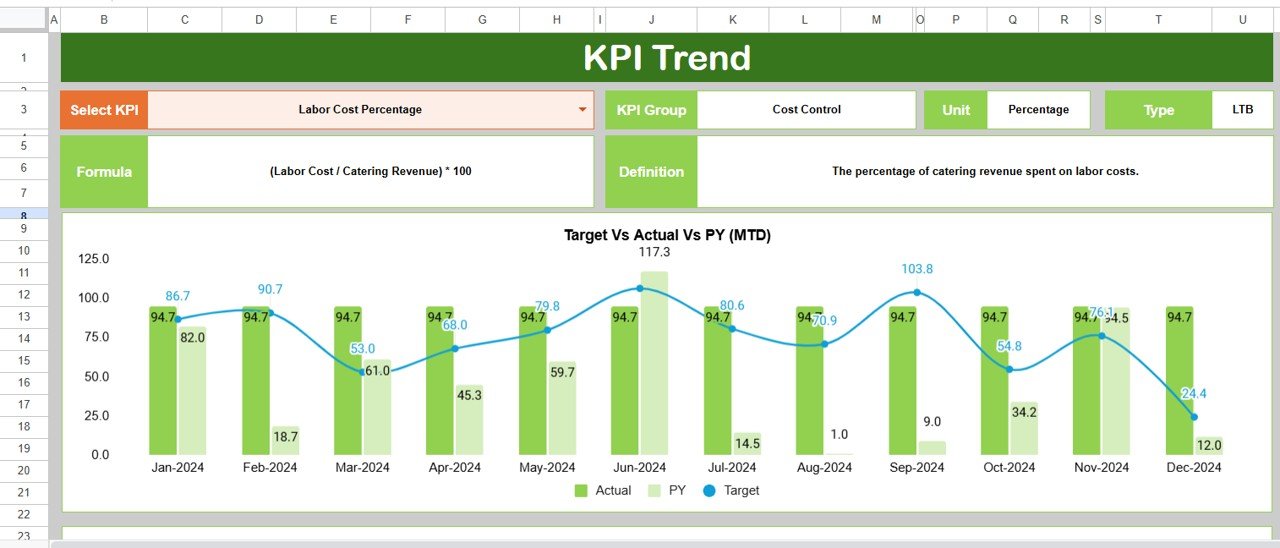
2️⃣ Trend Sheet Tab:
Dive deep into any KPI by selecting from a drop-down list. Displays KPI Group, Unit, Type (UTB/LTB), Formula, Definition, and detailed MTD–YTD trends.
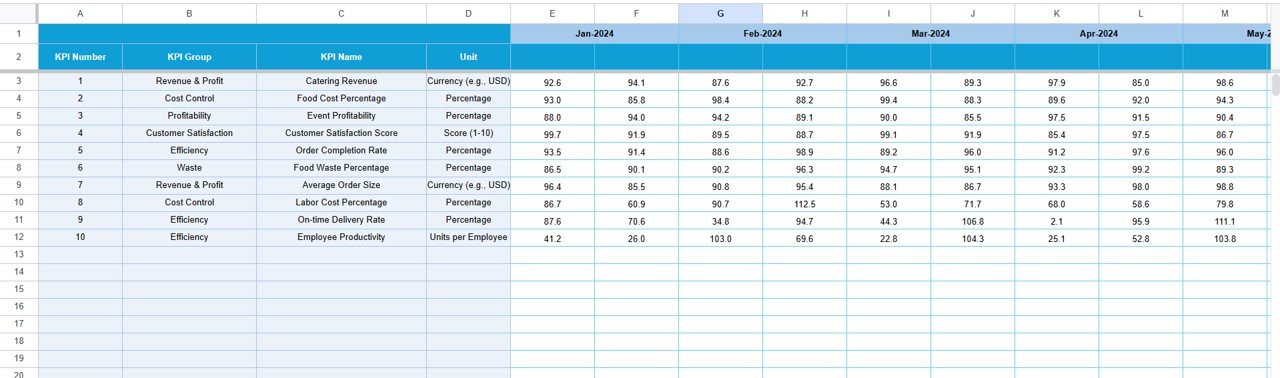
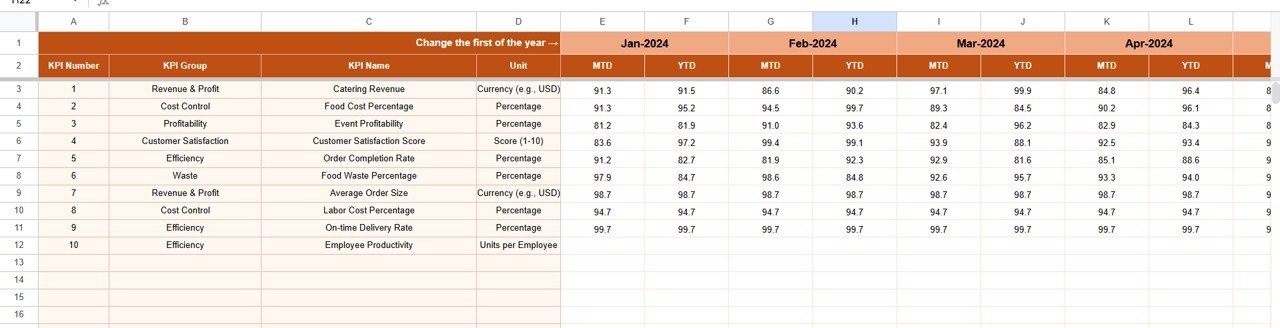
3️⃣ Actual Numbers Input Sheet:
Input monthly performance metrics such as total revenue, order count, client satisfaction, or staff hours.
4️⃣ Target Sheet Tab:
Define monthly targets for each KPI. Compare goals with actuals to measure team performance effectively.
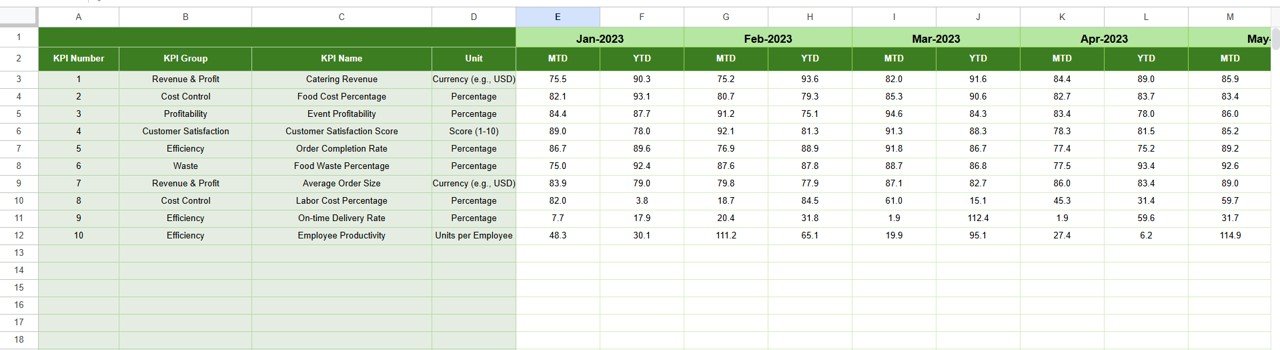
5️⃣ Previous Year Numbers Sheet:
Enter last year’s results to analyze growth patterns using built-in conditional formatting.
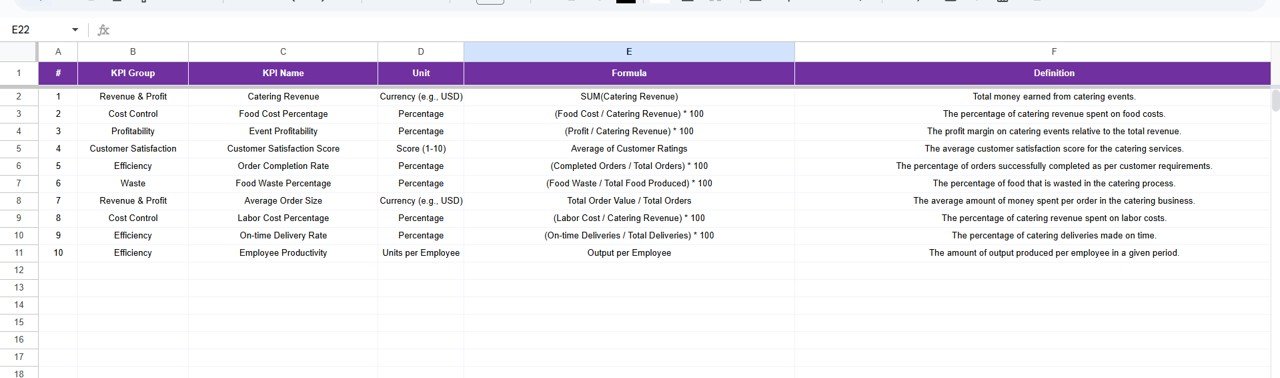
6️⃣ KPI Definition Sheet Tab:
Standardize KPI details for accuracy — include name, group, formula, and definition. This ensures uniform understanding across departments.
⚙️ How to Use the Catering Business KPI Dashboard in Google Sheets
🧾 Step 1: Open the file and go to the Actual Numbers Input sheet to record your business data.
📅 Step 2: Use the Target sheet to set monthly goals for each KPI.
📊 Step 3: Navigate to the Dashboard tab, select the desired month (cell D3), and watch the metrics refresh automatically.
📈 Step 4: Use the Trend tab to analyze KPI progress — identify improvement areas or declining trends.
🤝 Step 5: Share the live dashboard with your team via Google Drive for real-time updates and collaboration.
It’s that simple! No coding, no macros — just smart spreadsheet automation.
👥 Who Can Benefit from This Catering Business KPI Dashboard
🍴 Catering Business Owners — Track revenue, expenses, and service quality in one glance.
🏨 Restaurant Chains Offering Catering Services — Monitor multi-location KPIs efficiently.
🎉 Event Management Firms — Manage multiple catering projects with accurate performance tracking.
💼 Corporate Food Service Providers — Evaluate operational productivity and client satisfaction.
🚀 Entrepreneurs & Startups — Gain control over operations and scale efficiently using data insights.
Whether you run a small catering kitchen or a large enterprise, this Google Sheets dashboard helps you make better, faster, and smarter business decisions.


Reviews
There are no reviews yet.