Running a car rental business today is far more complex than simply renting vehicles. Every day, teams must track rentals, revenue, maintenance costs, customer behavior, branch performance, and city-wise demand. However, when this data stays scattered across spreadsheets or disconnected systems, decision-making becomes slow, reactive, and inefficient.
That is exactly where the Car Rental Services Dashboard in Power BI becomes a game-changing analytics solution 🚗📊.
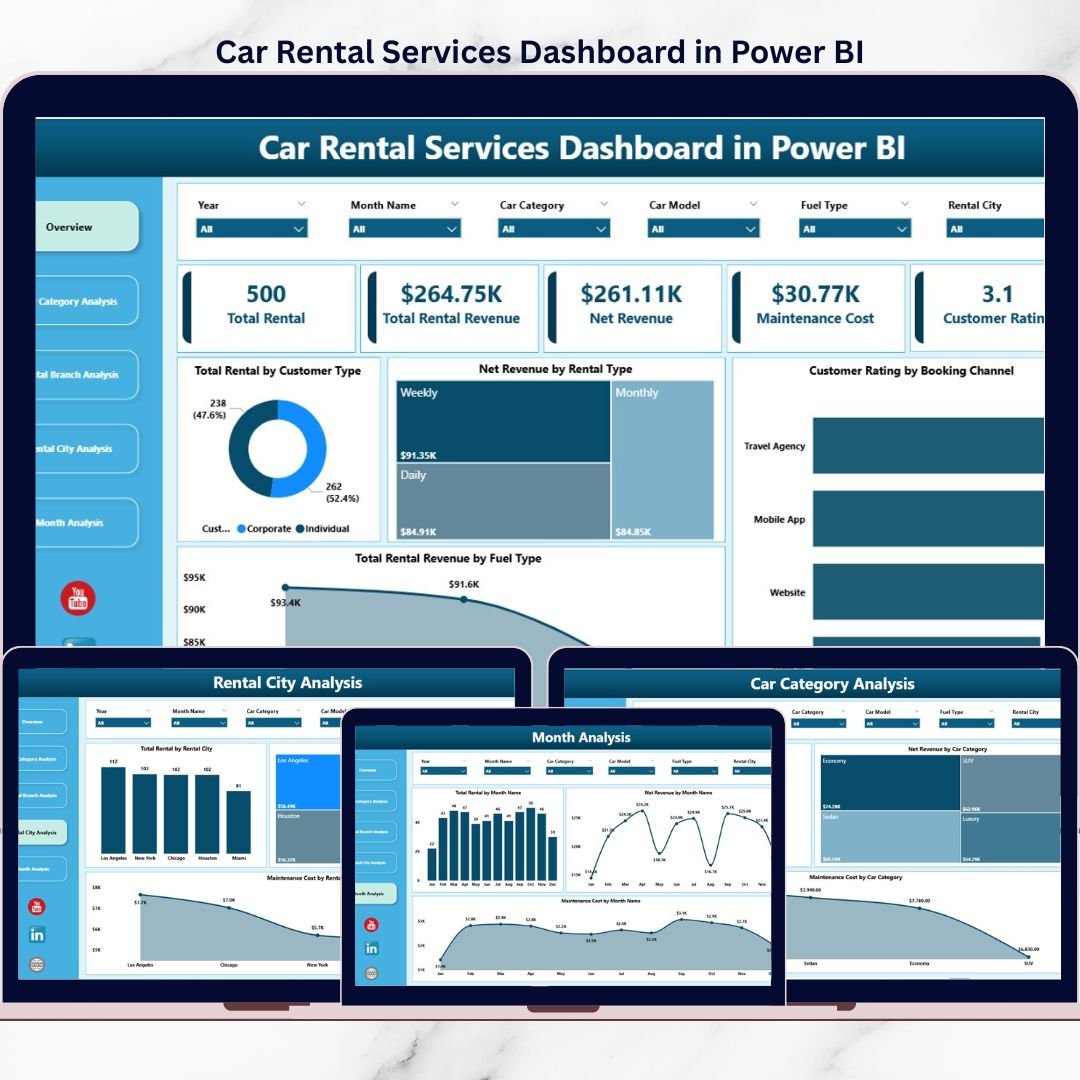
This ready-to-use Power BI dashboard is designed to give car rental owners, managers, and analysts a clear, real-time view of rental operations. Instead of manually reviewing multiple Excel files, users can instantly monitor total rentals, net revenue, maintenance costs, customer behavior, and location-wise performance through interactive visuals and KPIs.
Because the dashboard is built in Power BI, it delivers dynamic filtering, drill-down analysis, and professional visuals suitable for both operational reviews and management presentations. Moreover, it connects seamlessly with Excel or database sources, making data updates simple and scalable.
With five structured analytical pages, this dashboard helps car rental businesses identify performance gaps early, optimize fleet usage, control costs, and drive profitable growth.
## 🚗 Key Features of Car Rental Services Dashboard in Power BI
This dashboard is designed for real-world car rental operations.
📊 Real-Time Rental Performance Tracking
Instant visibility into rentals, revenue, and costs.
🎯 Interactive Slicers & Filters
Analyze data by city, branch, category, customer type, and month.
📈 Dynamic KPI Cards
Quick snapshot of business health.
🏢 Branch & City-Wise Analysis
Understand location-level performance clearly.
🚘 Car Category Insights
Optimize fleet mix and reduce losses.
📅 Monthly Trend Analysis
Track seasonality and growth patterns.
🧩 Scalable & Professional Power BI Design
Suitable for leadership and operations teams.
## 📂 What’s Inside the Car Rental Services Dashboard in Power BI
This dashboard includes 5 well-structured analytical pages, each answering a key business question.
📊 Overview Page
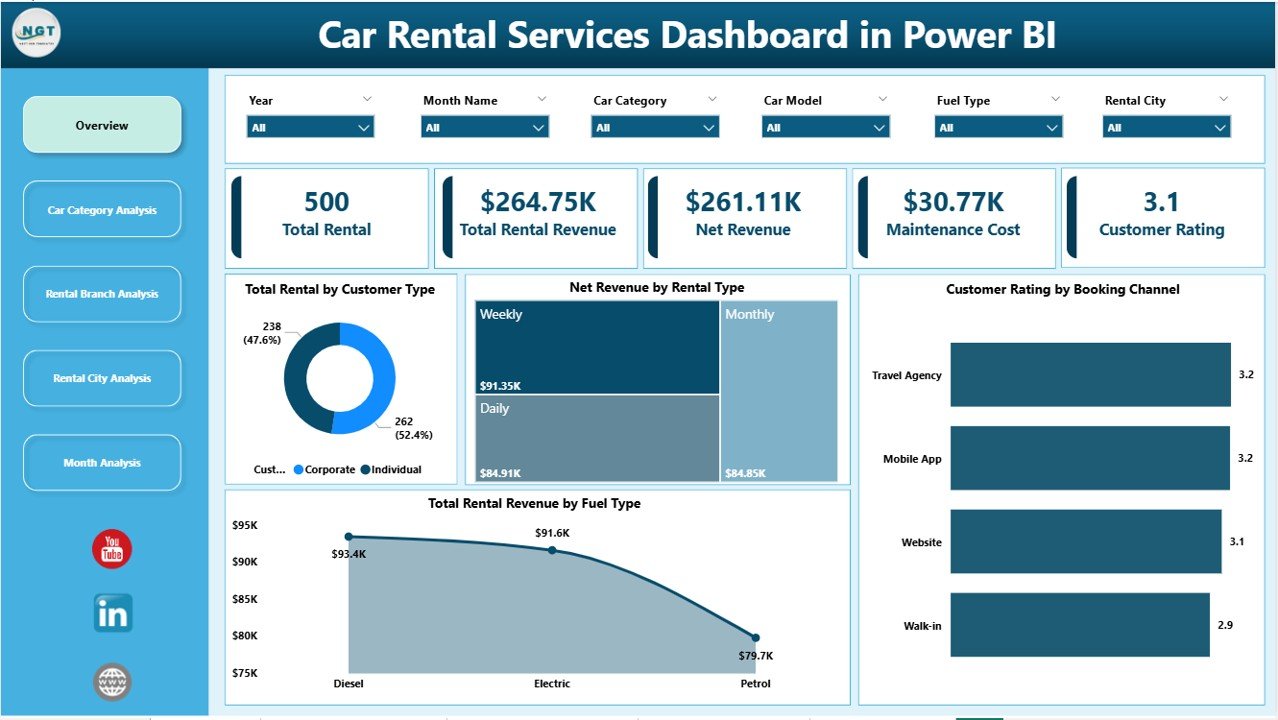
The central control panel of the dashboard with:
-
Interactive slicers for filtering
-
High-level KPIs for instant insights
KPI visuals include:
-
Total Rental by Customer Type
-
Net Revenue by Rental Type
-
Customer Rating by Booking Channel
-
Total Rental Revenue by Fuel Type
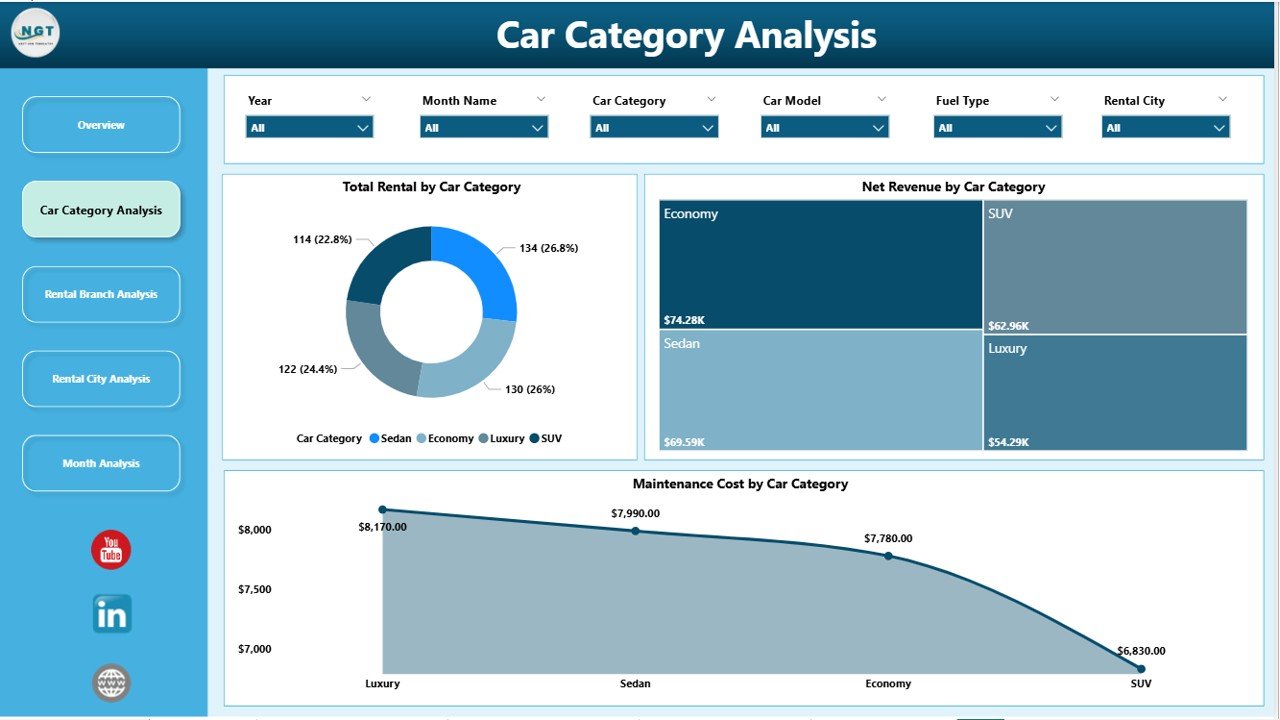
🚘 Car Category Analysis Page
Analyze performance by vehicle category using:
-
Total Rental by Car Category
-
Net Revenue by Car Category
-
Maintenance Cost by Car Category
This page helps identify profitable categories and costly segments.
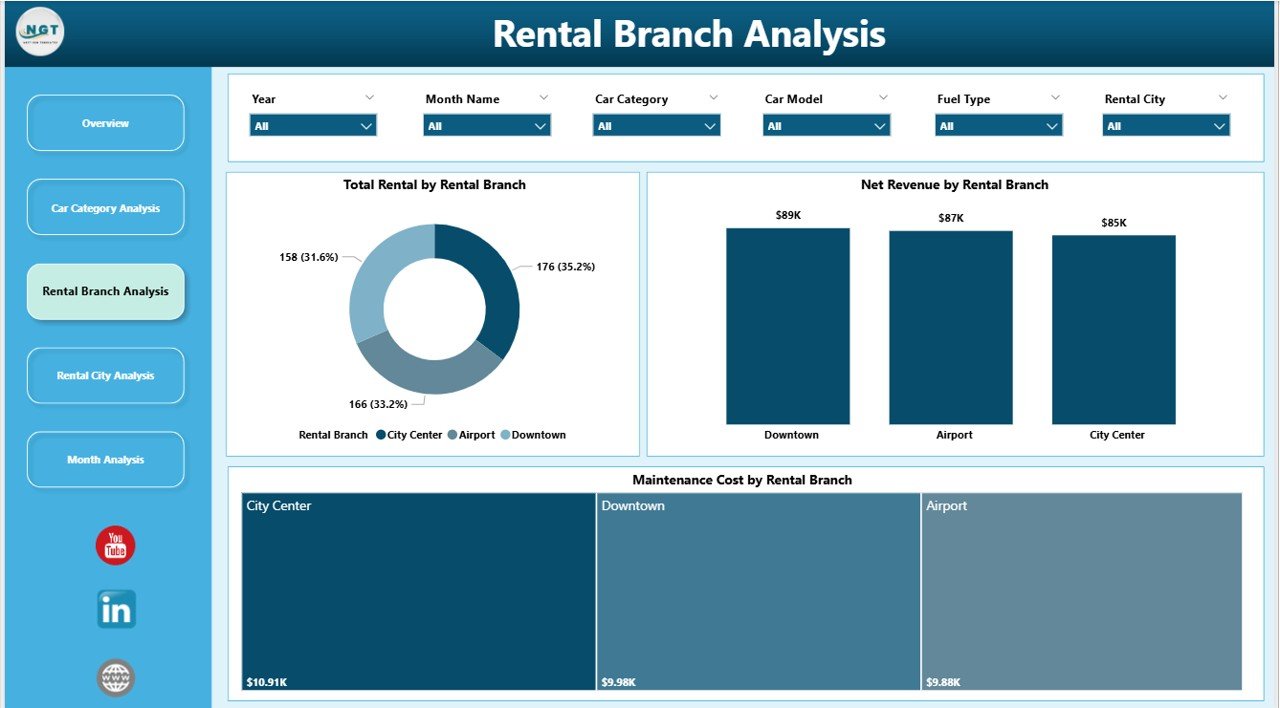
🏢 Rental Branch Analysis Page
Branch-wise performance comparison through:
-
Total Rental by Rental Branch
-
Net Revenue by Rental Branch
-
Maintenance Cost by Rental Branch
This supports branch accountability and resource optimization.
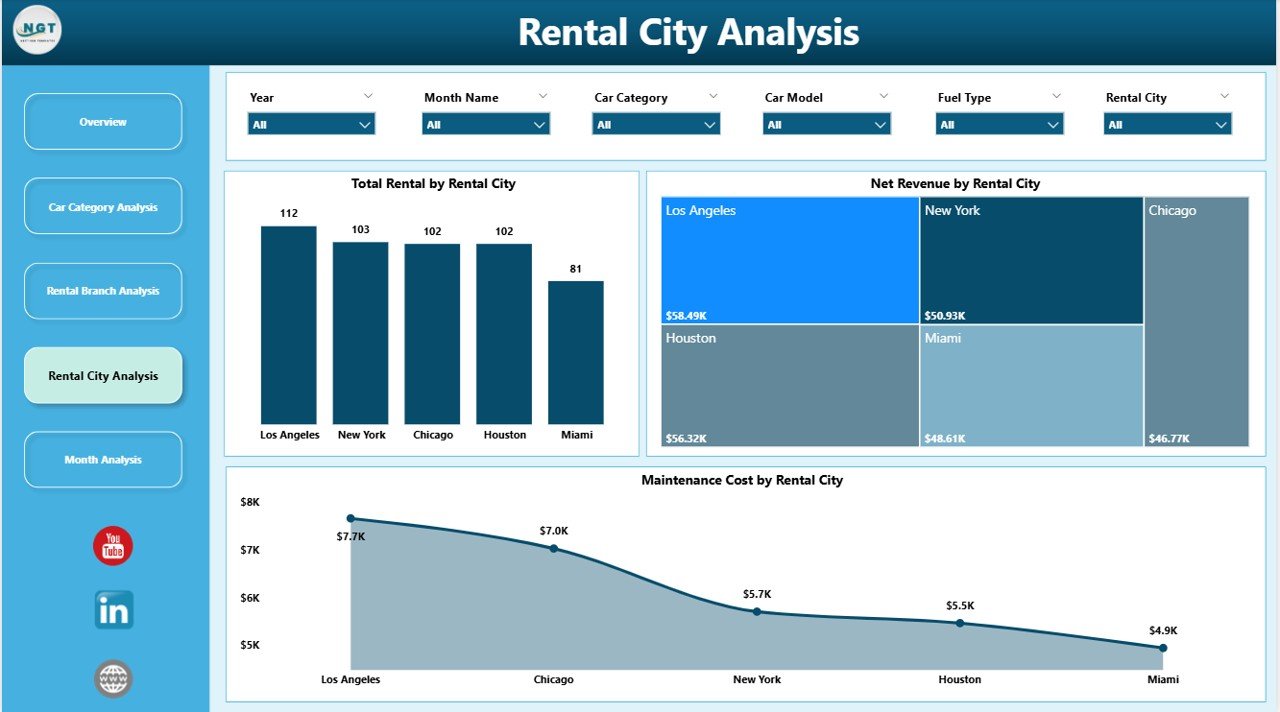
🌆 Rental City Analysis Page
City-level demand and profitability insights with:
-
Total Rental by Rental City
-
Net Revenue by Rental City
-
Maintenance Cost by Rental City
Ideal for multi-city planning and fleet allocation.
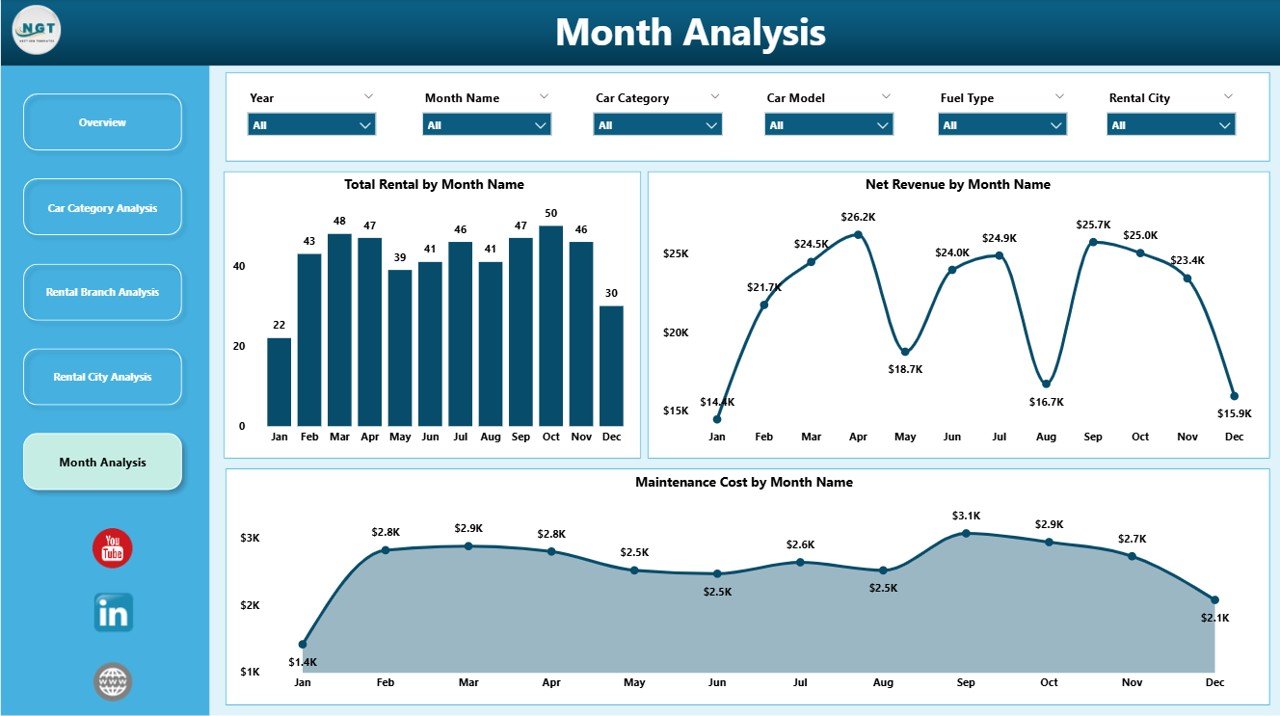
📅 Month Analysis Page
Time-based performance tracking using:
-
Total Rental by Month
-
Net Revenue by Month
-
Maintenance Cost by Month
This page supports forecasting, budgeting, and seasonal planning.
## 🛠️ How to Use the Car Rental Services Dashboard in Power BI
Using the dashboard is simple and efficient:
1️⃣ Connect your rental data (Excel or database)
2️⃣ Refresh the Power BI dataset
3️⃣ Use slicers to filter by city, branch, category, or month
4️⃣ Review KPIs and charts instantly
5️⃣ Drill down into problem areas
6️⃣ Use insights for pricing, fleet, and expansion decisions
No advanced technical expertise required.
## 👥 Who Can Benefit from This Car Rental Services Dashboard
This dashboard is ideal for:
✔️ Car Rental Business Owners
✔️ Operations & Fleet Managers
✔️ Regional & Branch Managers
✔️ Finance & Revenue Teams
✔️ Business Analysts
✔️ Strategy & Planning Teams
Suitable for small rental companies and large multi-city operators.
### Click here to read the Detailed blog post
Visit our YouTube channel to learn step-by-step video tutorials
👉 https://youtube.com/@PKAnExcelExpert


Reviews
There are no reviews yet.