
Call centers manage massive call volumes every single day. When the queue grows, customers wait longer—and many eventually hang up before reaching an agent. These abandoned calls directly impact customer satisfaction, increase service complaints, and reduce business efficiency. To solve this challenge, every call center needs a clear and reliable way to measure and minimize call abandonment.
The Call Abandonment Rate KPI Dashboard in Power BI gives you a complete, real-time view of call center performance. It tracks how many calls drop, why callers disconnect, and how well your team responds during busy hours. With this dashboard, leaders can reduce call abandonment, improve response time, and make smarter staffing and scheduling decisions.
This ready-to-use Power BI dashboard transforms your Excel-based data into dynamic visuals, KPI cards, trend lines, variance comparisons, and drill-through insights. You can monitor MTD (Month-to-Date), YTD (Year-to-Date), targets, actuals, and previous year performance—all in one place. The dashboard provides a 360° view of call center health, helping teams identify problems early and drive immediate improvements.
📊 Key Features of the Call Abandonment Rate KPI Dashboard in Power BI
The dashboard comes with a powerful 3-page design that makes analysis simple, fast, and actionable.
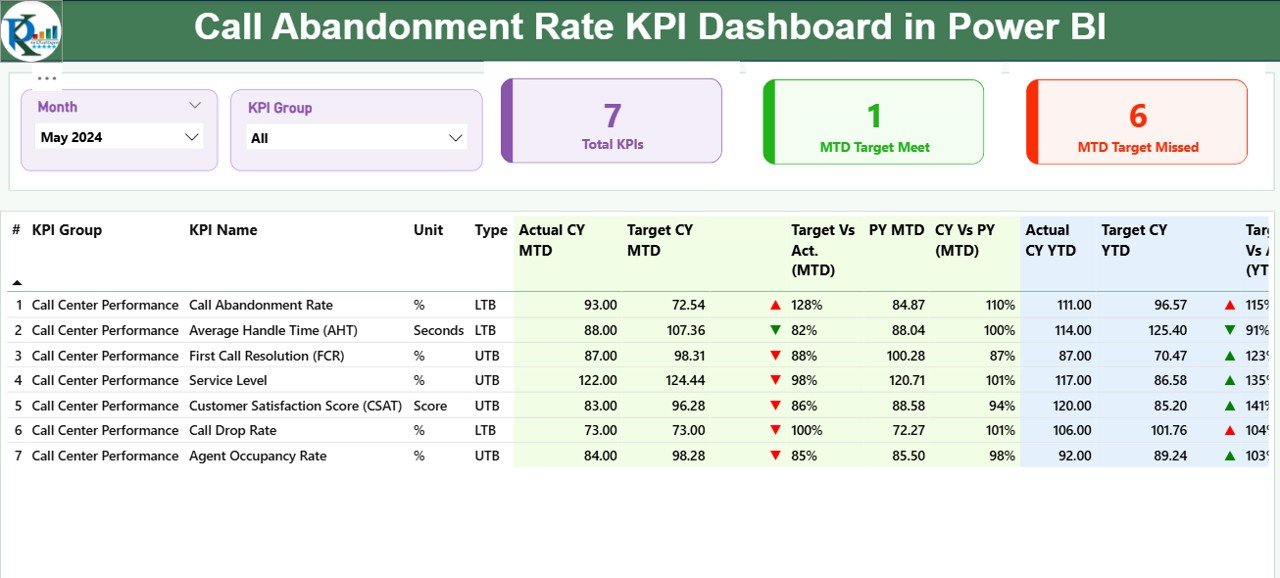
⭐ 1. Summary Page – Complete KPI View in One Screen
This page gives you a full snapshot of call abandonment performance.
It includes:
-
✔ Month slicer & KPI Group slicer
-
✔ Total KPIs count
-
✔ MTD Target Meet count
-
✔ MTD Target Missed count
The detailed KPI table displays everything you need to measure call center performance:
-
KPI Number
-
KPI Name
-
KPI Group
-
Unit
-
Type (LTB/UTB)
-
MTD Actual & MTD Target
-
YTD Actual & YTD Target
-
Previous year comparisons
-
Performance icons (▲ green for good, ▼ red for poor)
With this clear layout, you instantly know whether your call center is improving or falling behind.
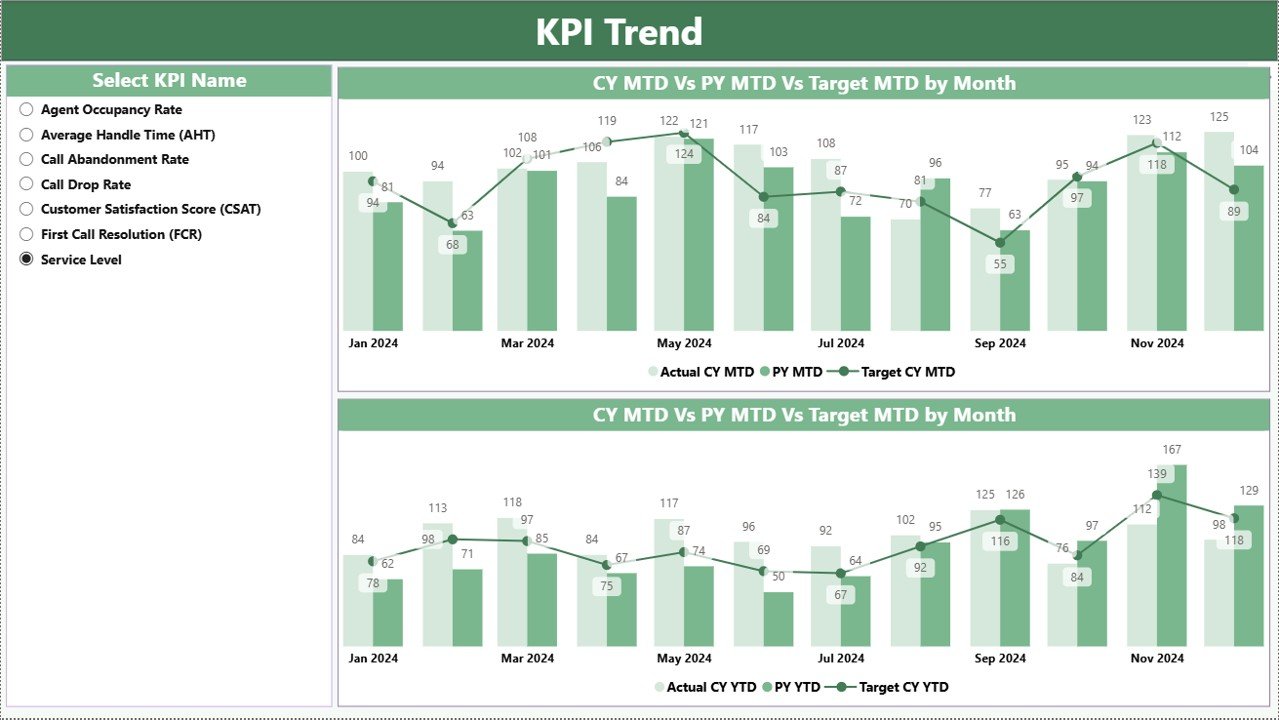
⭐ 2. KPI Trend Page – Analyze Monthly & Yearly Patterns
This page helps you dive deeper into trends.
It shows:
-
✔ Actual Current Year
-
✔ Previous Year
-
✔ Target lines
You can choose any KPI using the KPI Name slicer and track both MTD and YTD performance across months. This reveals which months experience high call abandonment and how performance changes year over year.
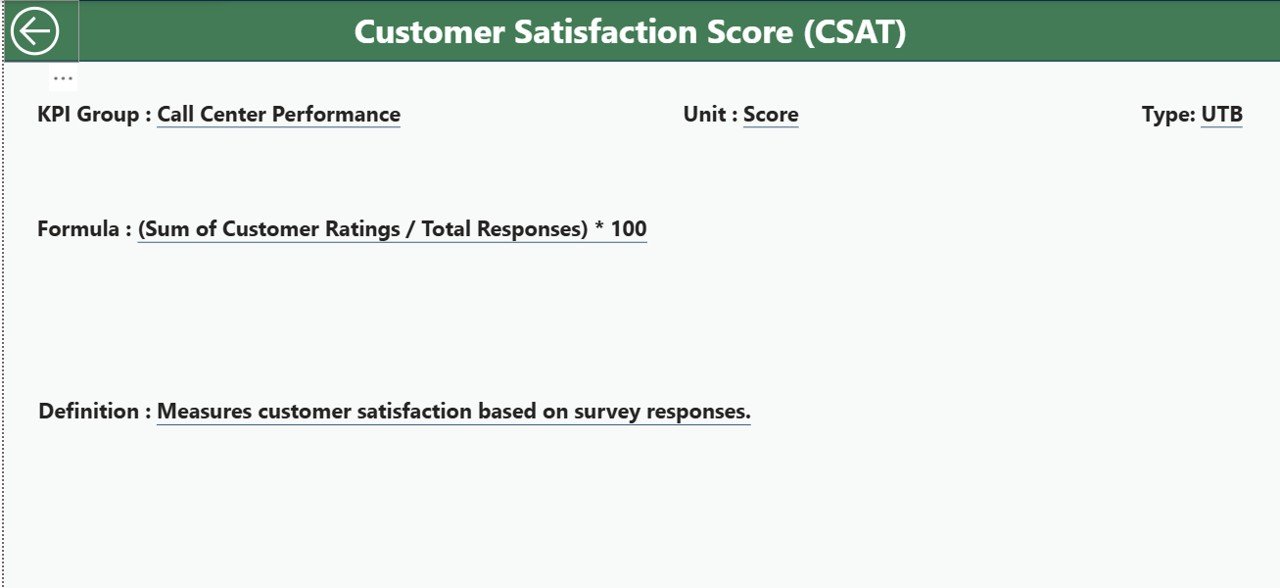
⭐ 3. KPI Definition Page – Drill Through for KPI Details
This hidden page acts as a complete KPI reference library.
You can view:
-
KPI Number
-
KPI Group
-
KPI Name
-
Formula
-
Definition
-
Unit
-
Type (UTB/LTB)
Simply right-click a KPI in the summary table → Drill Through → View its full definition. A Back button returns you to the main dashboard instantly.
📦 What’s Inside the Call Abandonment Rate KPI Dashboard in Power BI
Inside your Power BI package, you get:
-
A fully built 3-page dashboard
-
Slicers for quick filters
-
Dynamic KPI cards
-
Clear trend lines for MTD/YTD
-
Detailed KPI tables
-
Color-coded icons for performance
-
Drill-through functionality
-
Easy-to-edit Excel input sheets
The Excel file includes:
-
Input_Actual (MTD/YTD actual performance)
-
Input_Target (MTD/YTD targets)
-
KPI Definition (definitions, formulas, units, types)
Just update these sheets, refresh Power BI, and your dashboard updates automatically.
🧩 How to Use the Call Abandonment Rate KPI Dashboard
Using this dashboard is extremely simple:
-
📄 Fill data in Actual, Target, and KPI Definition sheets
-
🔄 Refresh Power BI to load updated results
-
🎚 Use slicers to filter KPI groups and months
-
📊 Review MTD/YTD performance
-
⚠ Identify high-risk KPIs early
-
🔍 Track trends across months
-
🚀 Improve staffing and call routing strategies
No coding, no complex setup—just enter data and get instant insights.
👤 Who Can Benefit from This Dashboard
This dashboard is perfect for:
-
☎ Call Center Managers
-
📊 Business Analysts
-
🧑🤝🧑 Customer Experience Teams
-
🧭 Quality Managers
-
👥 Workforce Planning Teams
-
🏢 Operations Leaders
Anyone who handles customer service or call center performance will benefit from this dashboard.
### Click hare to read the Detailed blog post
Visit our YouTube channel to learn step-by-step video tutorials
👉 Youtube.com/@PKAnExcelExpert


Reviews
There are no reviews yet.