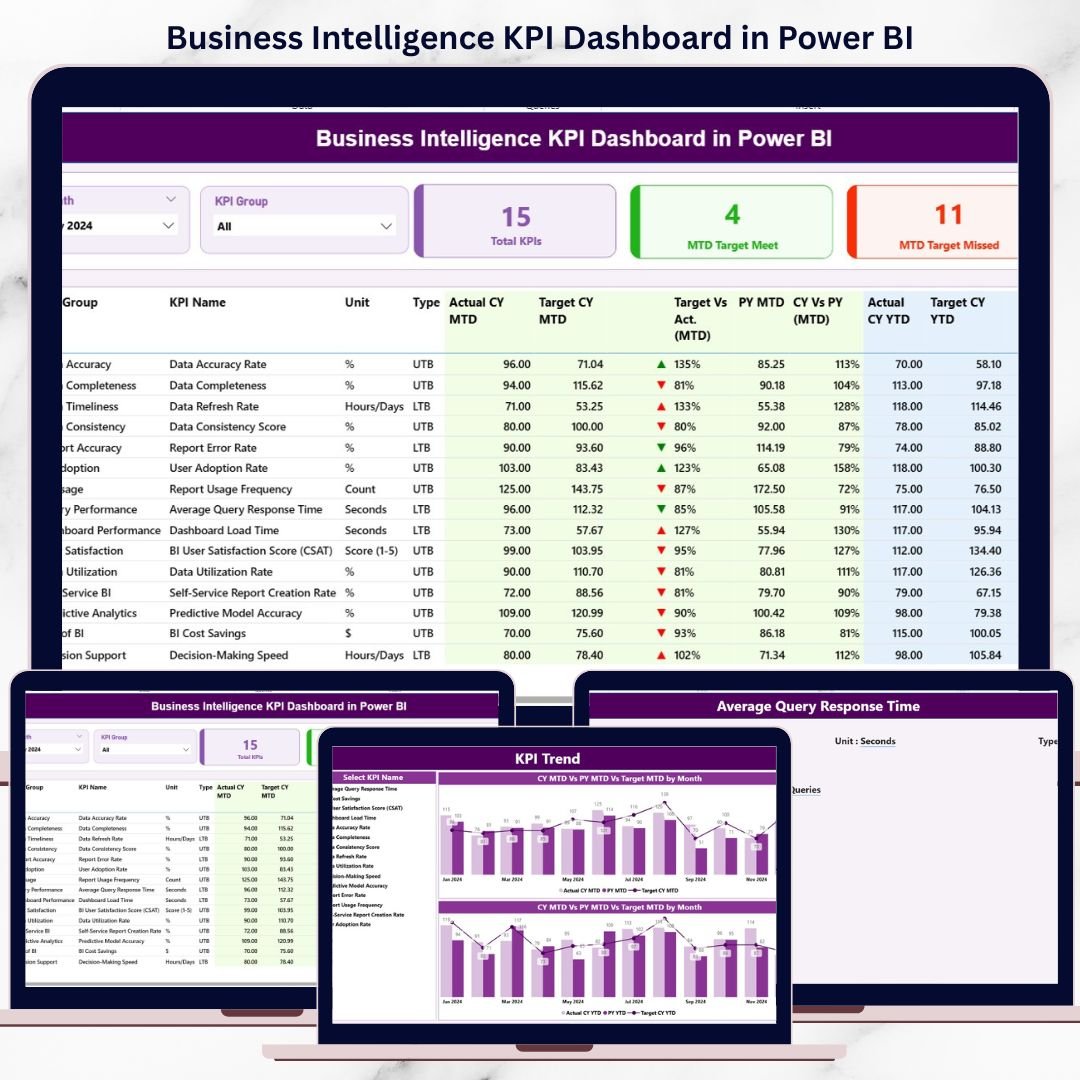
In today’s fast-paced and competitive business environment, data is everywhere—but insight is rare. Organizations track dozens of metrics across Excel files, emails, and static reports, yet decision-makers still struggle to understand whether performance is improving or declining. That is exactly why the Business Intelligence KPI Dashboard in Power BI becomes a must-have solution for modern businesses.
This ready-to-use Power BI dashboard transforms raw KPI data into clear, visual, and actionable insights. Instead of manually preparing reports every month, leadership teams can instantly monitor performance, track targets, and compare results against previous periods—all from one interactive dashboard.
Designed with simplicity and scalability in mind, this dashboard uses Excel as the data source and Power BI Desktop as the visualization layer. As a result, you get enterprise-level analytics without complex systems or heavy technical dependencies.
## 🚀 Key Features of Business Intelligence KPI Dashboard in Power BI
📊 Centralized KPI Monitoring
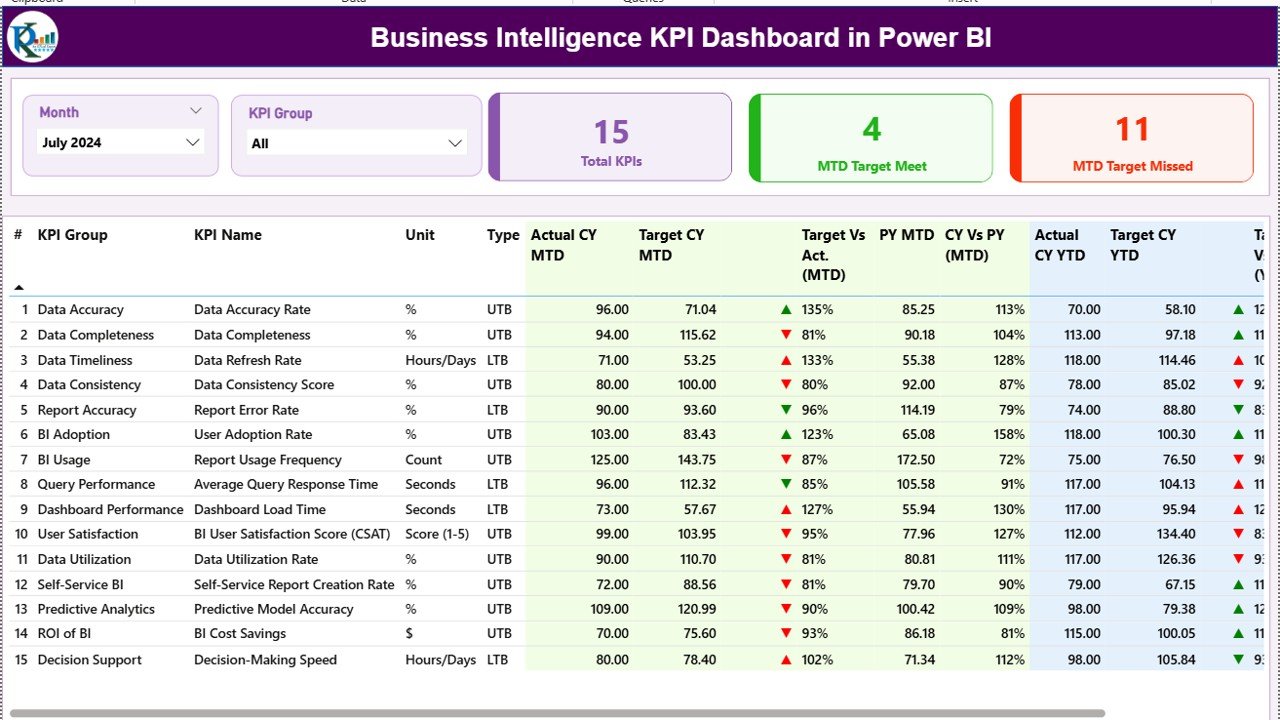
All your critical KPIs are displayed in one unified dashboard, eliminating the need for multiple reports.
📅 MTD & YTD Performance Tracking
Track Month-to-Date and Year-to-Date performance side by side for short-term and long-term analysis.
🎯 Target vs Actual Comparison
Instantly identify performance gaps using calculated percentages and visual indicators.
📈 Previous Year Comparison
Analyze trends and seasonality by comparing current performance with last year.
🎛️ Interactive Slicers
Filter performance by Month and KPI Group to focus on what matters most.
🧠 Clear KPI Logic & Definitions
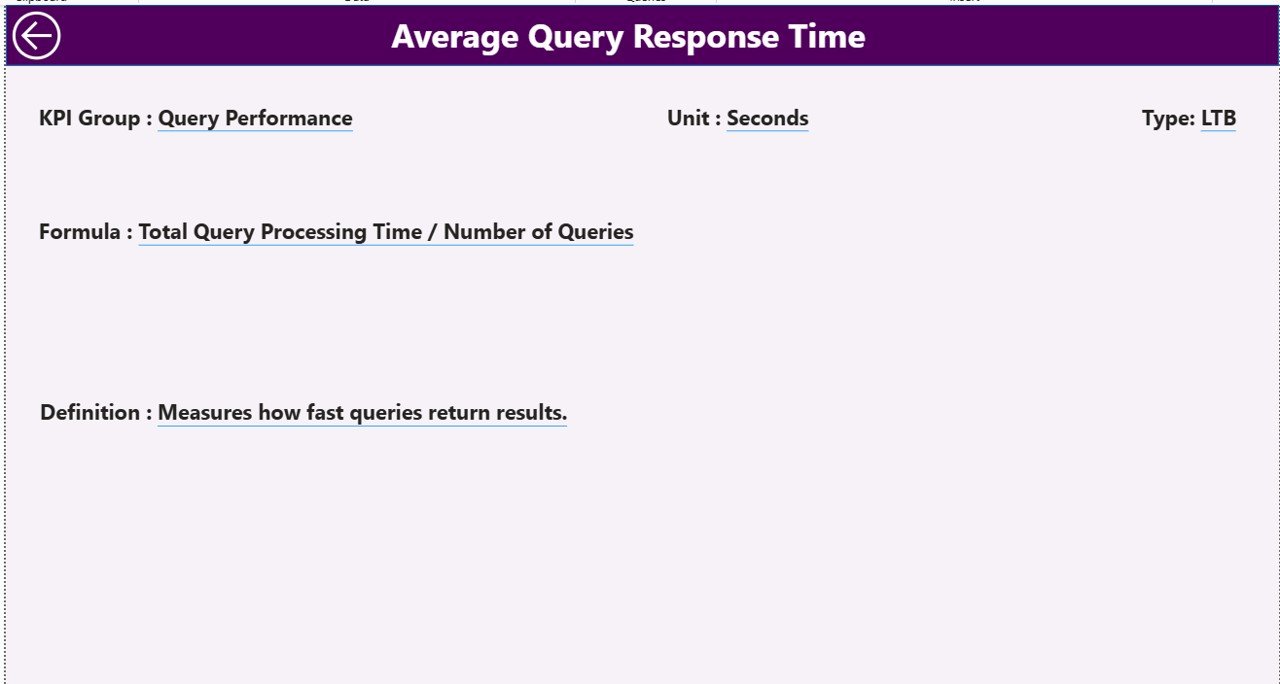
Each KPI comes with definitions, formulas, units, and KPI type (LTB/UTB) for clarity.
⚡ Fast & Automated Reporting
Update Excel data and refresh Power BI—no manual report building required.
## 📦 What’s Inside the Business Intelligence KPI Dashboard in Power BI
📄 Summary Page – Overall performance snapshot with KPI cards and detailed KPI table
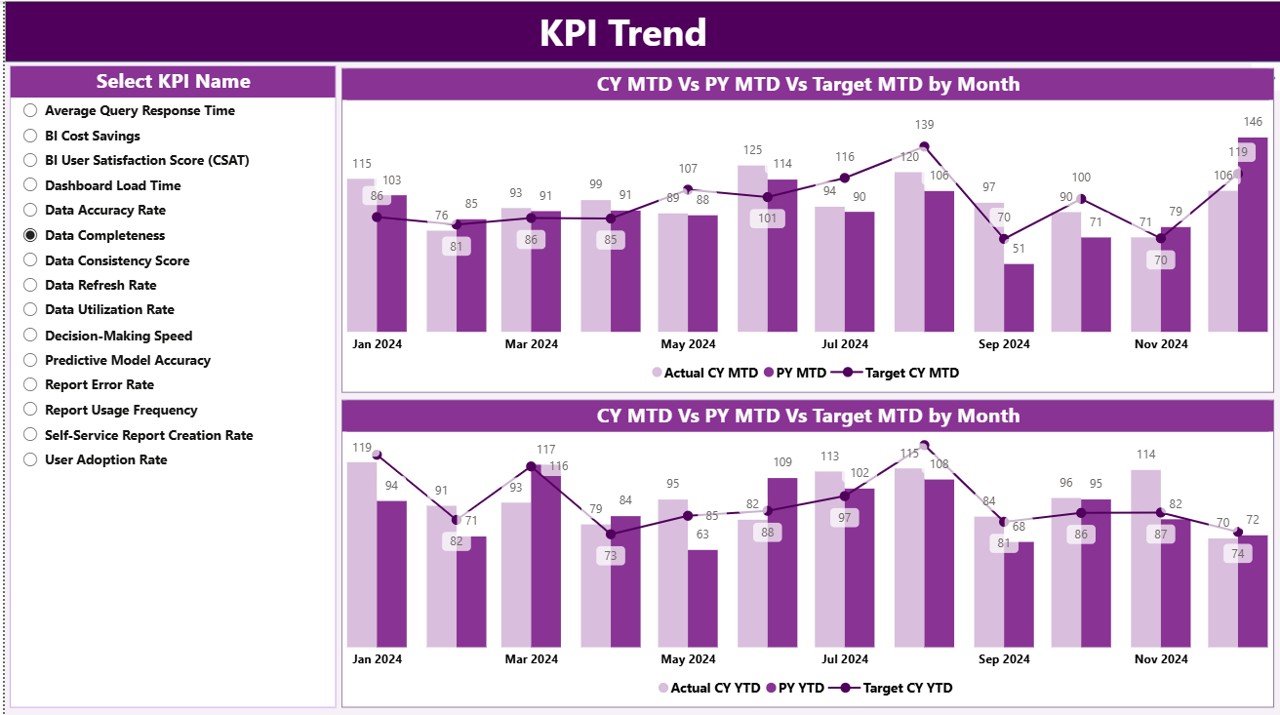
📄 KPI Trend Page – MTD and YTD trend analysis using combo charts
📄 KPI Definition Page – Drill-through reference page for KPI logic and formulas
📊 Excel Input File with:
-
Actual Data Sheet
-
Target Data Sheet
-
KPI Definition Sheet
Each component is structured to ensure clarity, consistency, and ease of maintenance.
## 🧭 How to Use the Business Intelligence KPI Dashboard in Power BI
🟢 Step 1: Enter KPI actual data in the Excel input file
🟢 Step 2: Update target values and KPI definitions
🟢 Step 3: Open the Power BI file and refresh data
🟢 Step 4: Use slicers to filter by Month and KPI Group
🟢 Step 5: Analyze Summary, Trends, and KPI definitions
🟢 Step 6: Use insights for reviews, meetings, and planning
You do not need advanced Power BI skills—basic Excel knowledge is enough.
## 👥 Who Can Benefit from This Business Intelligence KPI Dashboard in Power BI
🏢 Business Owners & CXOs
📊 Operations & Strategy Teams
💼 Finance & Planning Departments
📈 Sales & Marketing Teams
🧑💼 HR & Admin Teams
🚀 Growing Startups & Enterprises
If you want data-driven decisions without complexity, this dashboard fits perfectly.
### 🔗 Click here to read the Detailed blog post
📺 Visit our YouTube channel to learn step-by-step video tutorials
👉 Youtube.com/@PKAnExcelExpert


Reviews
There are no reviews yet.