In today’s data-driven business world, making decisions without clear insights is risky. Yet, many organizations still rely on multiple Excel files, manual calculations, and static reports. As a result, performance tracking becomes slow, confusing, and error-prone. That is exactly why the Business Intelligence KPI Dashboard in Excel is a must-have digital solution for modern businesses.
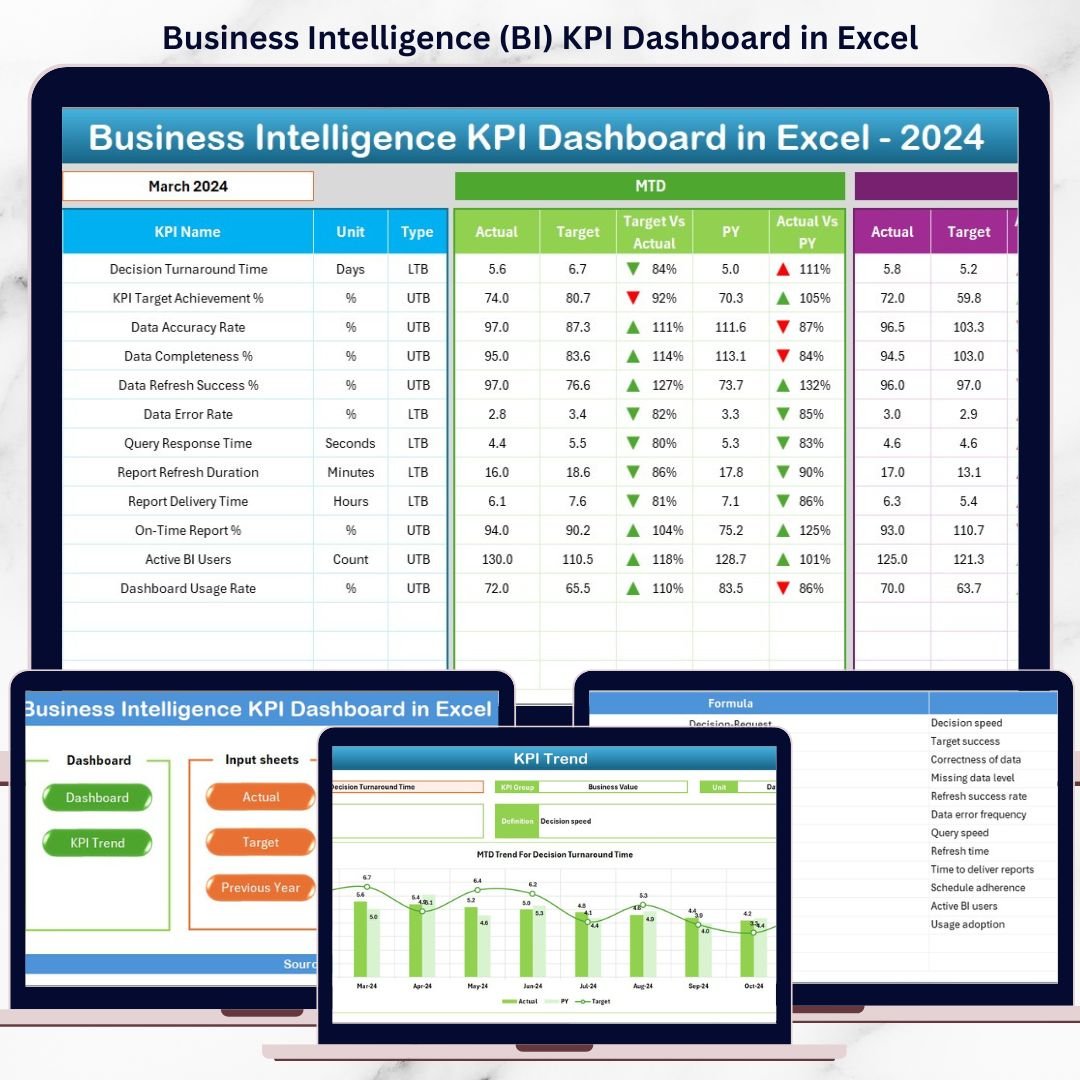
This ready-to-use dashboard transforms raw business data into clear, actionable insights. Instead of switching between multiple sheets and reports, you can track MTD (Month-to-Date) and YTD (Year-to-Date) performance from one powerful Excel dashboard. Moreover, it compares Actual, Target, and Previous Year values instantly, helping you identify gaps, trends, and opportunities without delay.
Designed with simplicity and flexibility in mind, this Excel-based BI dashboard requires no advanced technical skills. You just enter data, select a month, and review performance instantly. As a result, teams save time, reduce reporting errors, and focus more on strategic decisions.
🚀 Key Feature of Business Intelligence KPI Dashboard in Excel
✨ Centralized KPI Monitoring – Track all business KPIs in one single dashboard
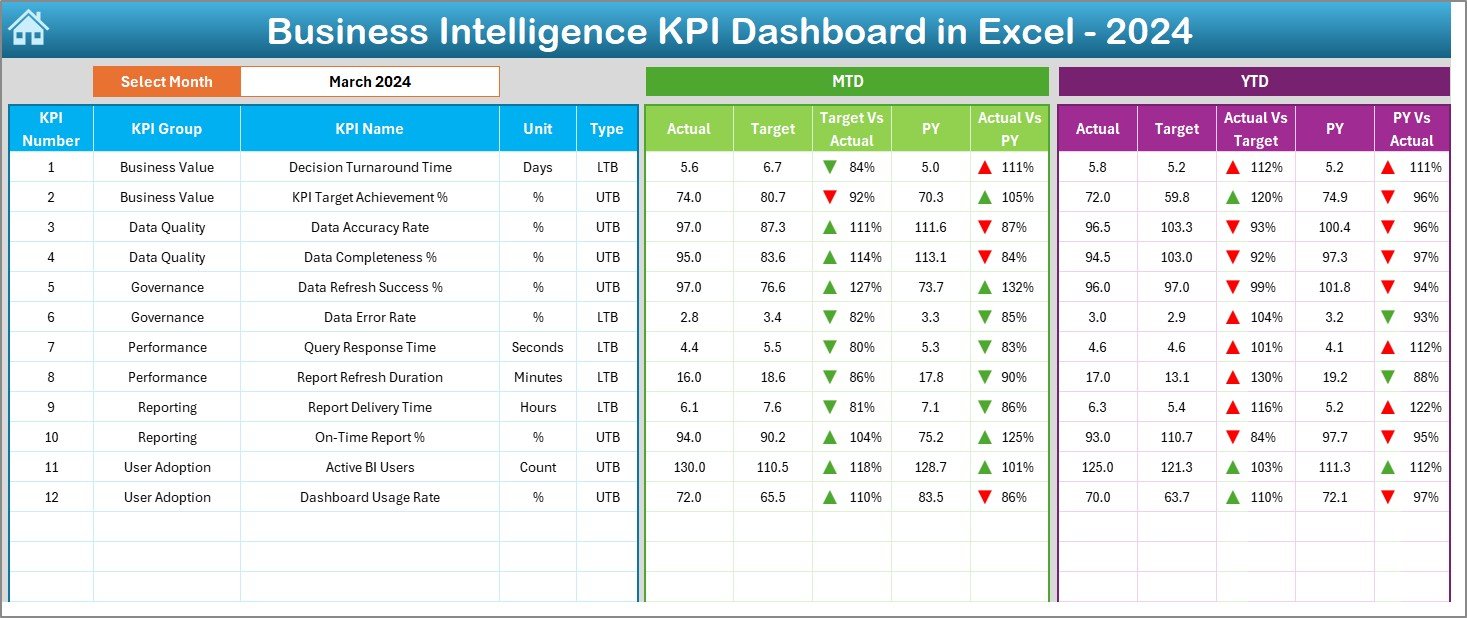
📅 Dynamic Month Selection – Change the month and see instant updates
📈 MTD & YTD Performance Tracking – Monitor short-term and long-term performance
🎯 Actual vs Target Comparison – Instantly spot underperforming KPIs
📊 Previous Year Analysis – Identify growth trends with year-over-year comparison
🔺 Conditional Formatting Arrows – Quickly visualize performance improvement or decline
🧭 Easy Navigation Summary Page – Jump to any worksheet with one click
🧠 User-Friendly Design – No advanced Excel or BI skills required
📦 What’s Inside the Business Intelligence KPI Dashboard in Excel
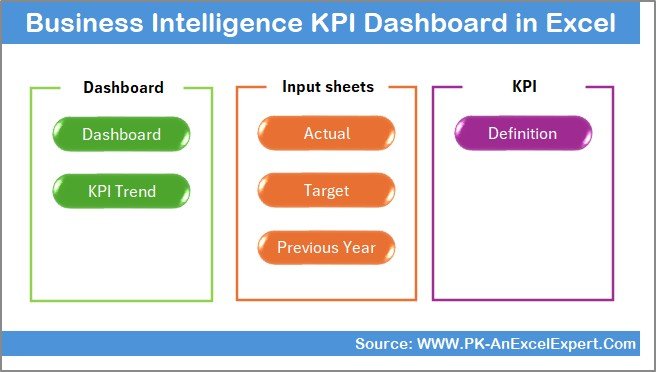
This digital product includes 7 professionally designed Excel worksheets, each serving a specific purpose:
📌 Summary Page – A clean index page with navigation buttons for smooth user experience
📌 Dashboard Sheet – The main KPI view showing MTD & YTD Actual, Target, and Previous Year data
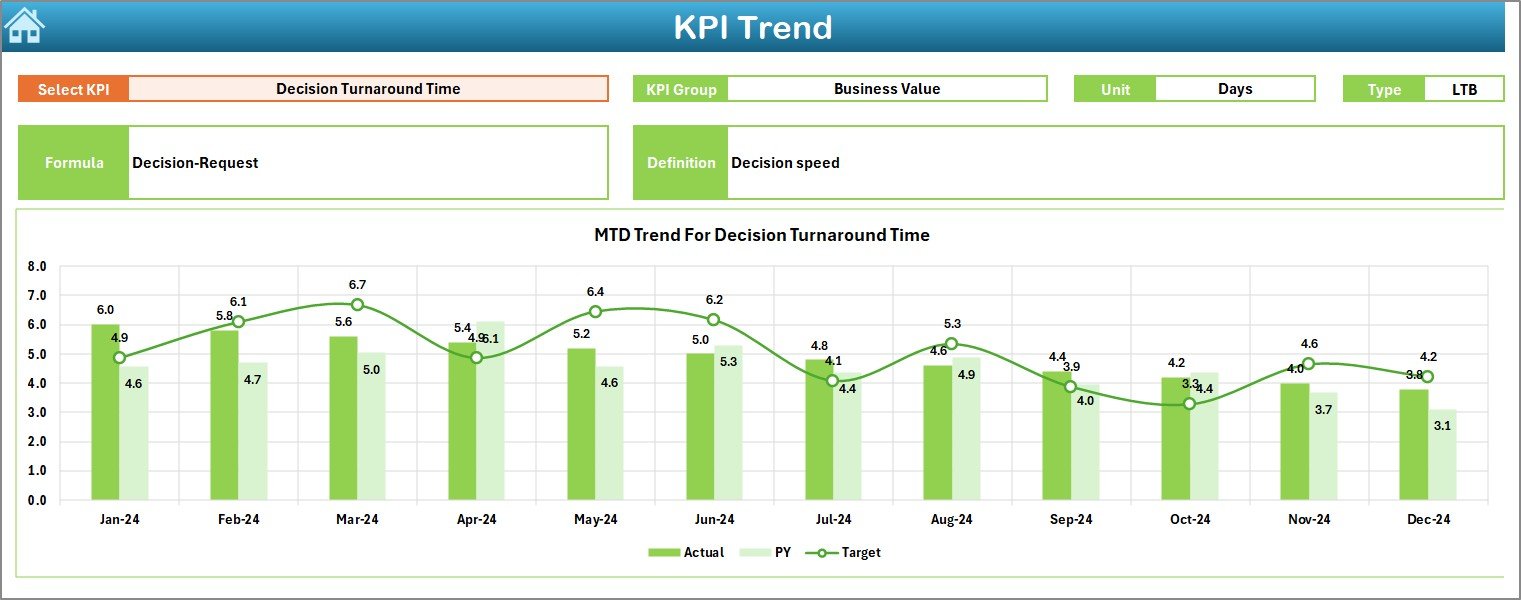
📌 Trend Sheet – Detailed KPI-wise trend analysis with interactive charts
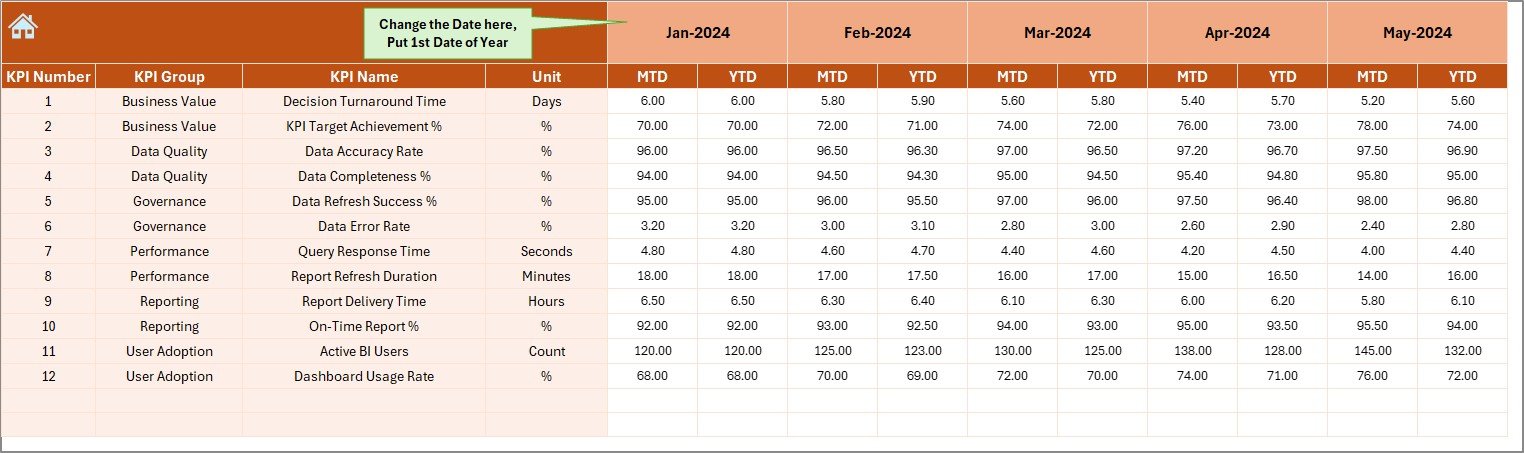
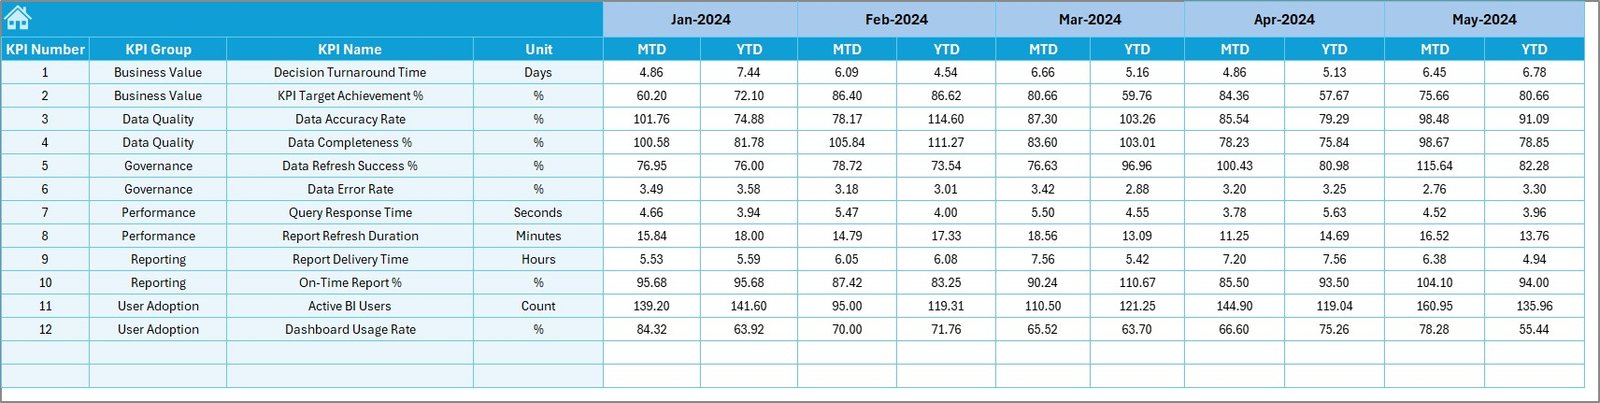
📌 Actual Numbers Input Sheet – Dedicated sheet to enter current year MTD and YTD actual data
📌 Target Sheet – Store monthly target values separately for accurate comparison
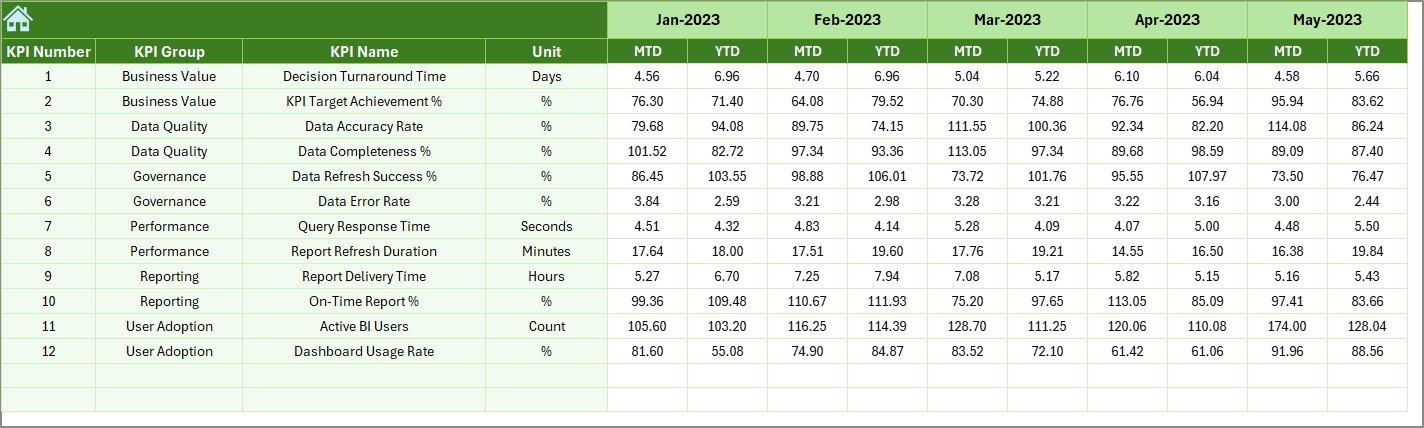
📌 Previous Year Number Sheet – Capture historical data for year-over-year analysis
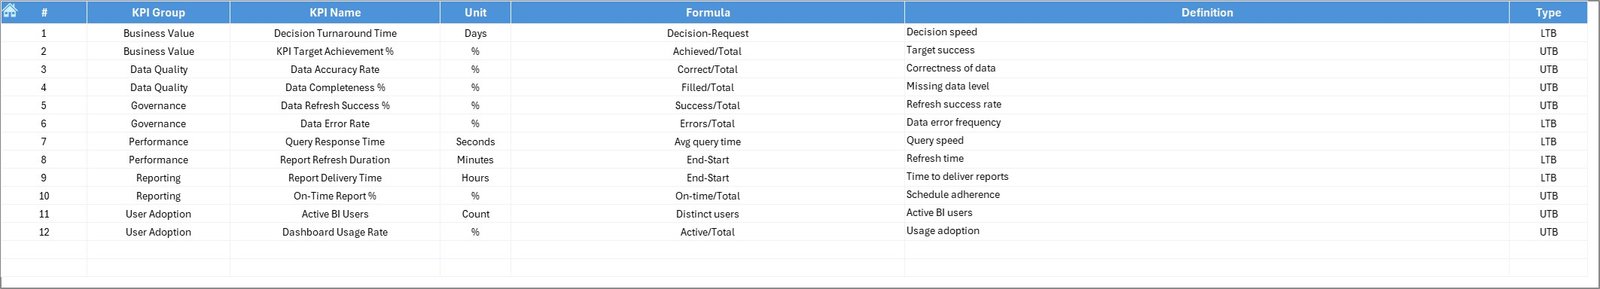
📌 KPI Definition Sheet – Document KPI name, group, unit, formula, and definition clearly
Because data, targets, and analysis are separated, the dashboard remains clean, scalable, and error-free.
🛠️ How to Use the Business Intelligence KPI Dashboard in Excel
Using this dashboard is simple and straightforward:
1️⃣ Enter actual KPI values in the Actual Numbers Input Sheet
2️⃣ Add monthly targets in the Target Sheet
3️⃣ Enter historical data in the Previous Year Number Sheet
4️⃣ Define or update KPIs in the KPI Definition Sheet
5️⃣ Select the required month from the Dashboard Sheet
6️⃣ Instantly review MTD & YTD performance with visual indicators
No macros, no complex setup, and no external tools required.
👥 Who Can Benefit from This Business Intelligence KPI Dashboard in Excel
🏢 Business Owners & Entrepreneurs – Track overall business health easily
📊 Management Teams – Monitor strategic KPIs and performance goals
⚙️ Operations Teams – Identify inefficiencies and process bottlenecks
💰 Finance Teams – Analyze cost, revenue, and performance variance
📈 Sales & Marketing Teams – Monitor sales targets and campaign performance
🧑💼 Analysts & Consultants – Deliver professional KPI reporting to clients
Whether you are a startup, SME, or large organization, this dashboard adapts perfectly to your needs.
Click here to read the Detailed blog post
Watch the step-by-step video tutorial:


Reviews
There are no reviews yet.