In today’s fast-moving business world, companies cannot rely on guesswork to drive growth. Sales performance, deal pipelines, revenue forecasting, and lead effectiveness must be tracked continuously to stay competitive. However, many organizations still depend on static spreadsheets and disconnected reports that make analysis slow and inefficient.
That’s where the Business Development Dashboard in Power BI becomes a game-changing solution.
This ready-to-use Power BI dashboard transforms raw business data into powerful visual insights, helping organizations monitor revenue performance, analyze deal progress, and identify growth opportunities instantly. Instead of spending hours preparing reports, decision-makers gain real-time visibility through interactive visuals and automated analytics.
Whether you manage sales teams, oversee revenue operations, or lead strategic planning, this dashboard enables faster decisions and smarter business development strategies.
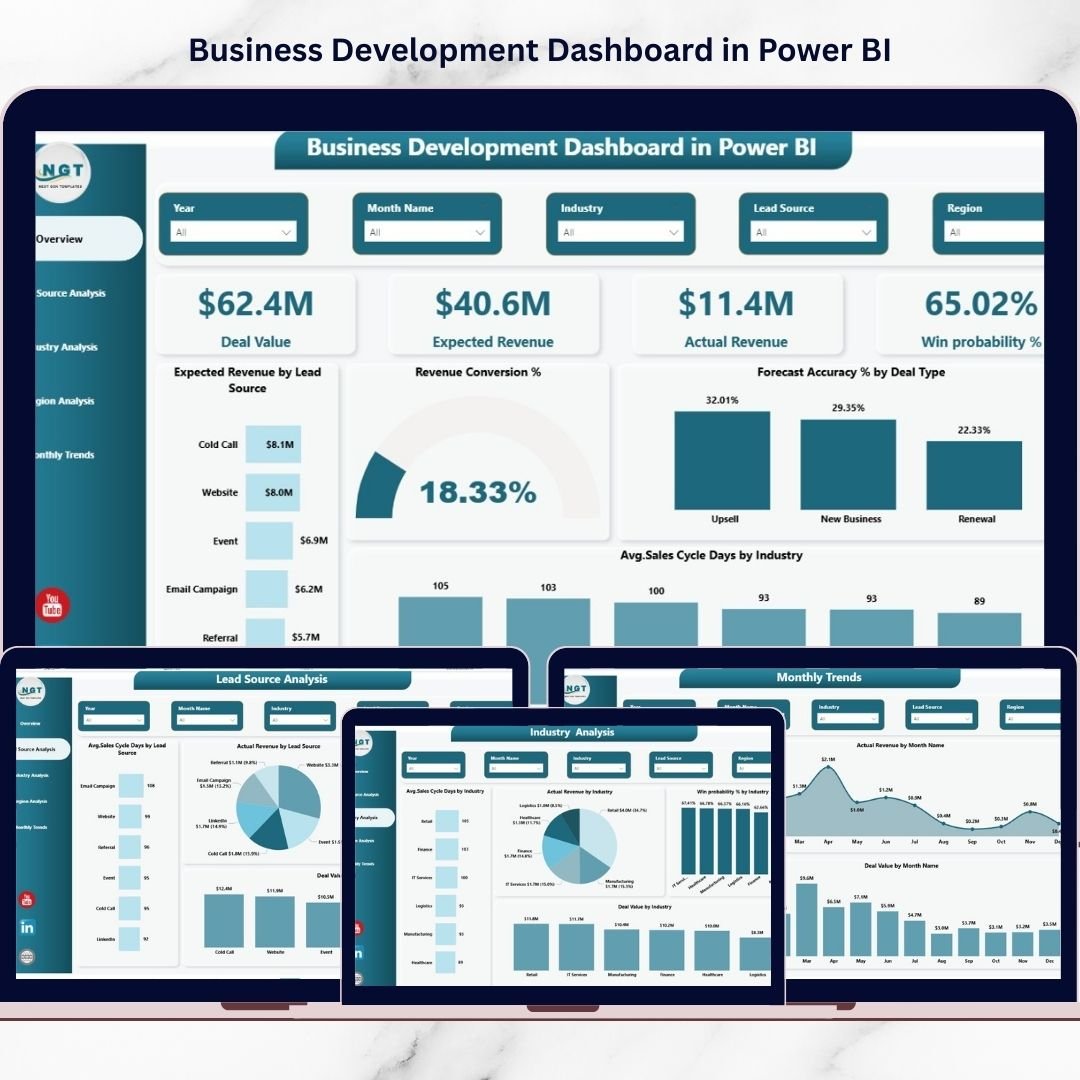
🚀 Key Features of Business Development Dashboard in Power BI
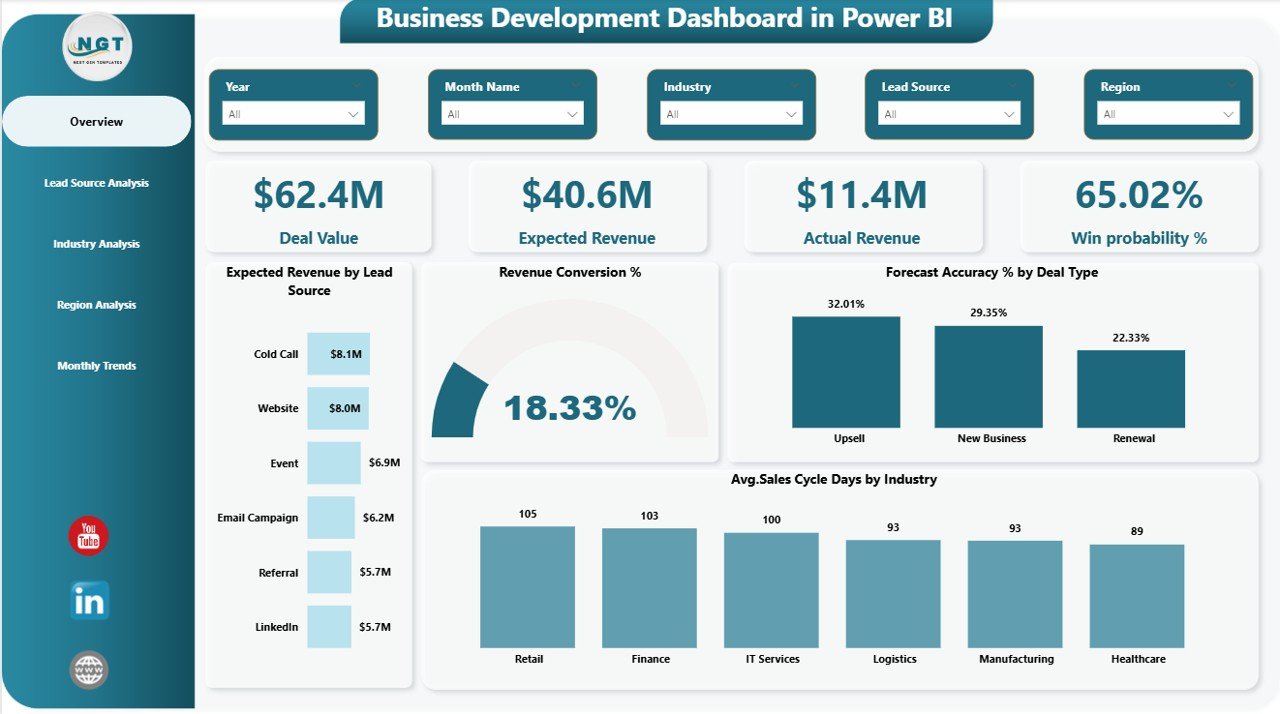
✅ Interactive KPI cards showing Deal Value, Expected Revenue, Actual Revenue, and Win Probability
✅ Five professionally designed analytical pages for complete performance monitoring
✅ Dynamic slicers and filters for instant data exploration
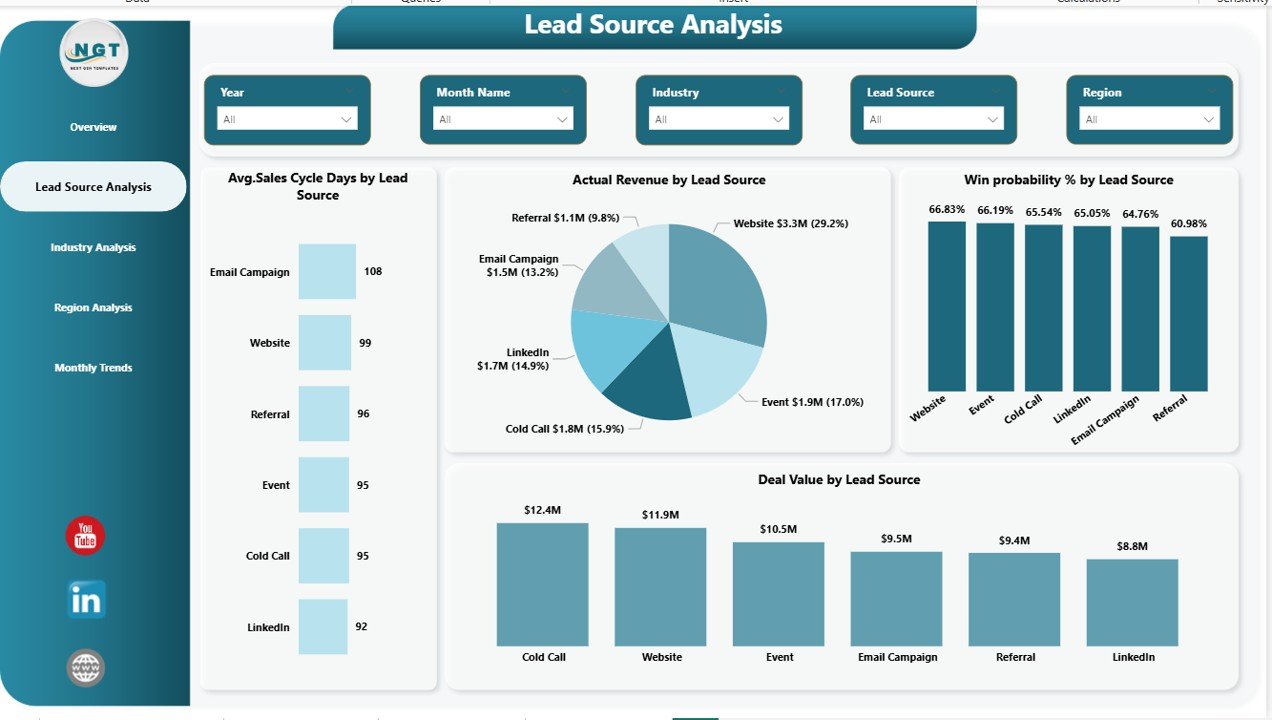
✅ Lead Source Analysis to identify high-performing marketing channels
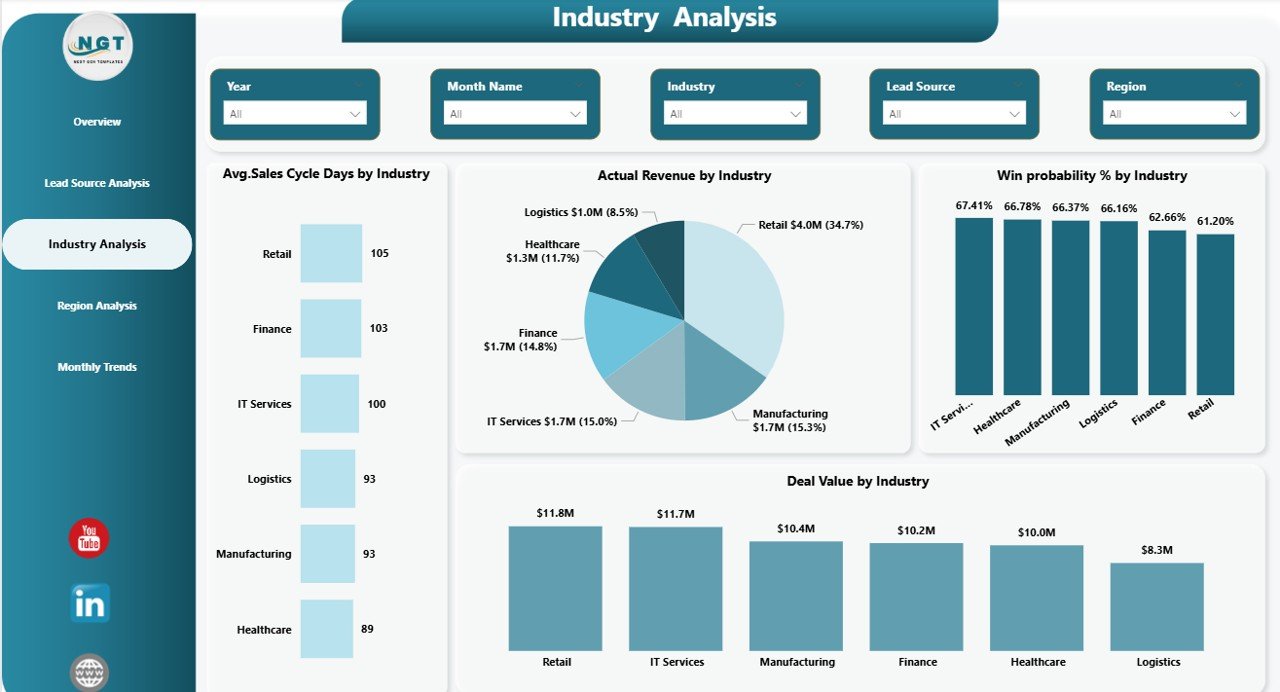
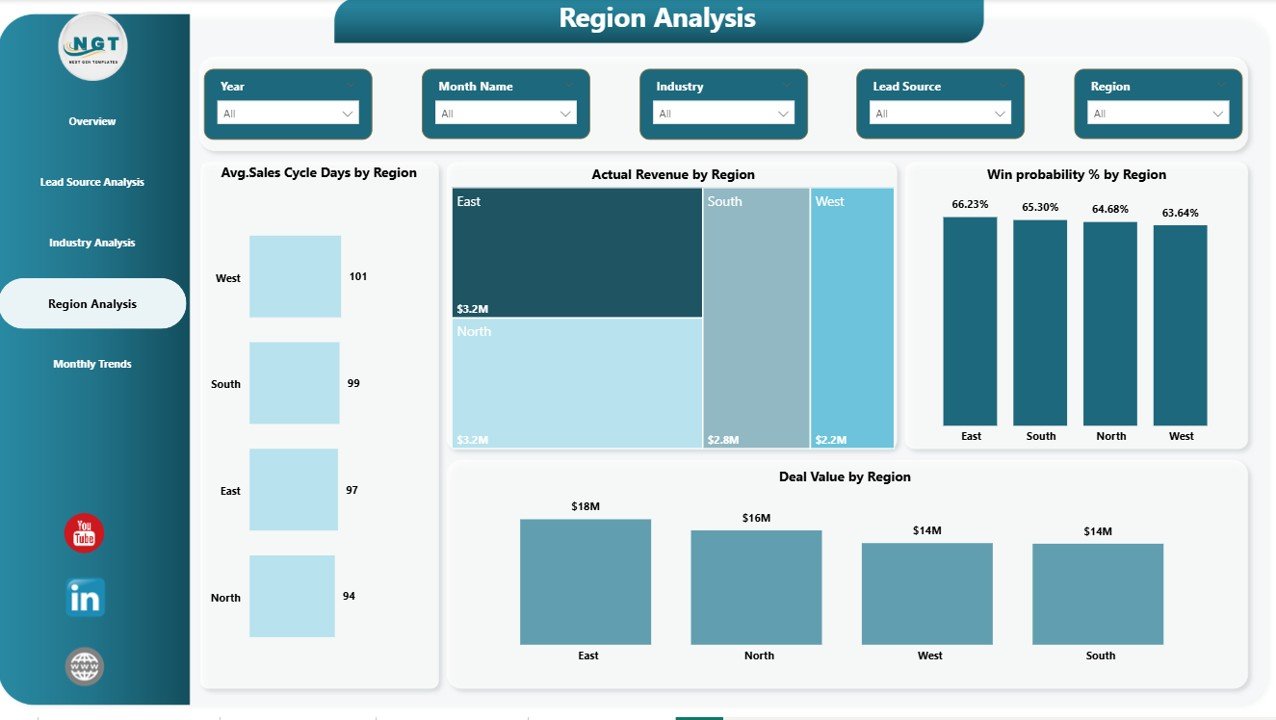
✅ Industry and Regional performance tracking for smarter resource allocation
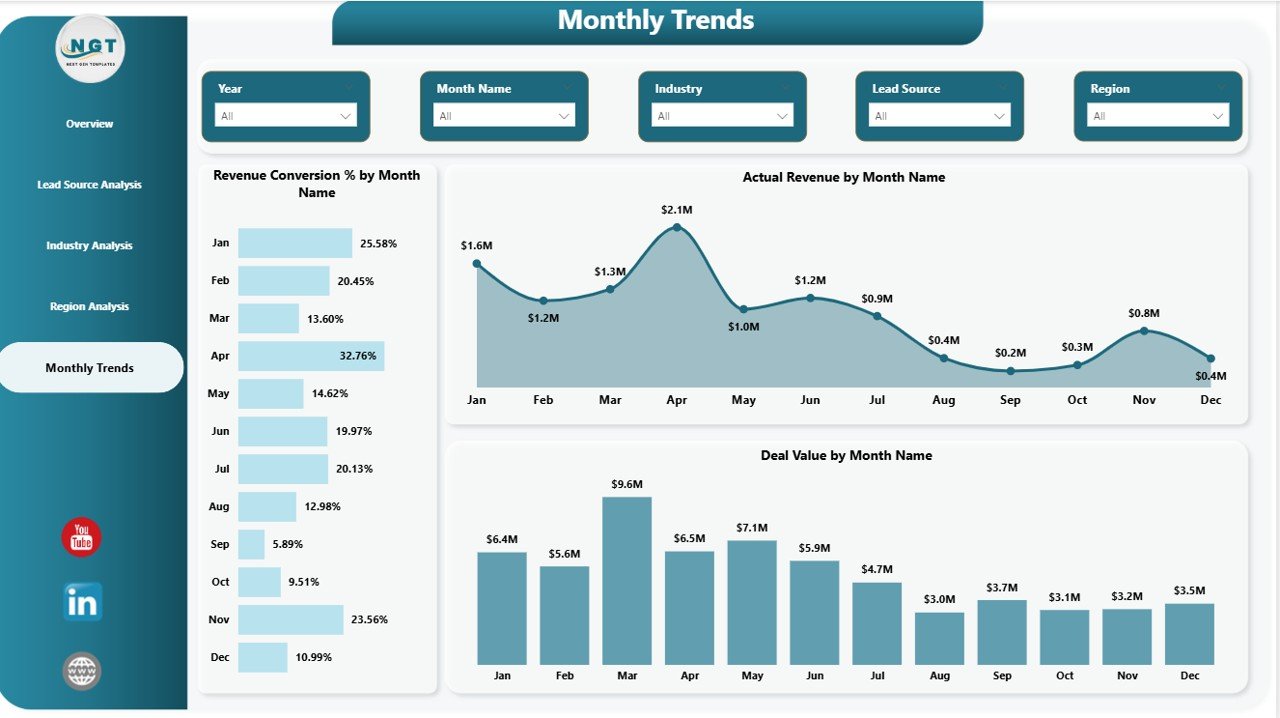
✅ Monthly trend analysis to monitor growth patterns over time
✅ Automated insights powered by Power BI visual analytics
✅ Clean and executive-ready dashboard layout
With these features, businesses can quickly understand performance without complex manual reporting.
📦 What’s Inside the Business Development Dashboard in Power BI
This digital product includes a fully structured and ready-to-use Power BI dashboard designed for real business scenarios.
Inside the template, you will get:
✔ Overview Page – Central performance hub with KPI cards and summary visuals
✔ Lead Source Analysis Page – Measure effectiveness of marketing channels
✔ Industry Analysis Page – Evaluate performance across industries
✔ Region Analysis Page – Analyze geographic sales performance
✔ Monthly Trends Page – Track revenue and deal progress over time
✔ Interactive charts and slicers for flexible analysis
✔ Organized data model for smooth performance tracking
Everything is professionally designed so you can start analyzing data immediately.
⚙️ How to Use the Business Development Dashboard in Power BI
Using this dashboard is simple and requires minimal setup.
1️⃣ Connect your Excel, CRM, or database file to Power BI
2️⃣ Refresh the dataset to load your business data
3️⃣ Use filters and slicers to analyze KPIs dynamically
4️⃣ Monitor deal pipelines, revenue trends, and win probability
5️⃣ Share insights with teams using Power BI Service
Within minutes, your business data converts into actionable insights that support better planning and forecasting.
👥 Who Can Benefit from This Business Development Dashboard in Power BI
This dashboard is ideal for professionals and organizations aiming to improve revenue visibility and decision-making:
✅ Sales Managers tracking pipeline performance
✅ Business Development Executives analyzing opportunities
✅ Marketing Teams evaluating lead sources
✅ Revenue Analysts monitoring KPIs
✅ Startup Founders managing growth metrics
✅ Senior Executives requiring strategic insights
✅ Consultants delivering data-driven recommendations
Because of its intuitive design, both technical and non-technical users can use the dashboard easily.
By implementing this dashboard, organizations gain clarity, improve forecasting accuracy, and create a data-driven culture. Instead of reacting late to performance issues, teams can identify trends early and act proactively.
The Business Development Dashboard in Power BI is not just a reporting tool — it is a strategic decision-making system that helps businesses scale efficiently and achieve sustainable growth.
Click here to read the Detailed blog post
Watch the step-by-step video tutorial:


