In today’s volatile business environment, disruptions are no longer rare events—they are inevitable. Cyberattacks, natural disasters, system failures, supply-chain disruptions, and operational shutdowns can strike without warning. When organizations are unprepared, the impact can be severe—extended downtime, financial losses, regulatory issues, and damaged reputation.
That is exactly why the Business Continuity Planning Dashboard in Power BI becomes a mission-critical decision-making tool 🚨.
This ready-to-use Power BI dashboard transforms scattered continuity data into a centralized, visual, and actionable intelligence system. Instead of relying on static reports and manual spreadsheets, leadership teams gain real-time visibility into preparedness, recovery performance, downtime impact, and financial exposure—all from one interactive dashboard.
Because this solution is built using Excel as a data source and Power BI for visualization, it remains flexible, scalable, and business-friendly for organizations of all sizes.
⭐ Key Features of Business Continuity Planning Dashboard in Power BI
This dashboard is designed for real-world continuity management—not just reporting.
🛡️ Centralized BCP Visibility – Monitor continuity readiness from one platform
⏱️ Recovery Time Tracking – Measure response and recovery efficiency
📉 Downtime Impact Analysis – Understand operational disruption clearly
💰 Financial Impact Monitoring – Track loss exposure instantly
🌍 Region & Business-Wise Analysis – Identify high-risk areas
⚠️ Risk Type Insights – Cyber, disaster, system, and supply-chain risks
📈 Monthly Trend Analysis – Monitor preparedness over time
🎛️ Interactive Power BI Slicers – Fast drill-down without complexity
📦 What’s Inside the Business Continuity Planning Dashboard in Power BI
This dashboard includes five well-structured analytical pages, each designed to answer critical continuity questions.
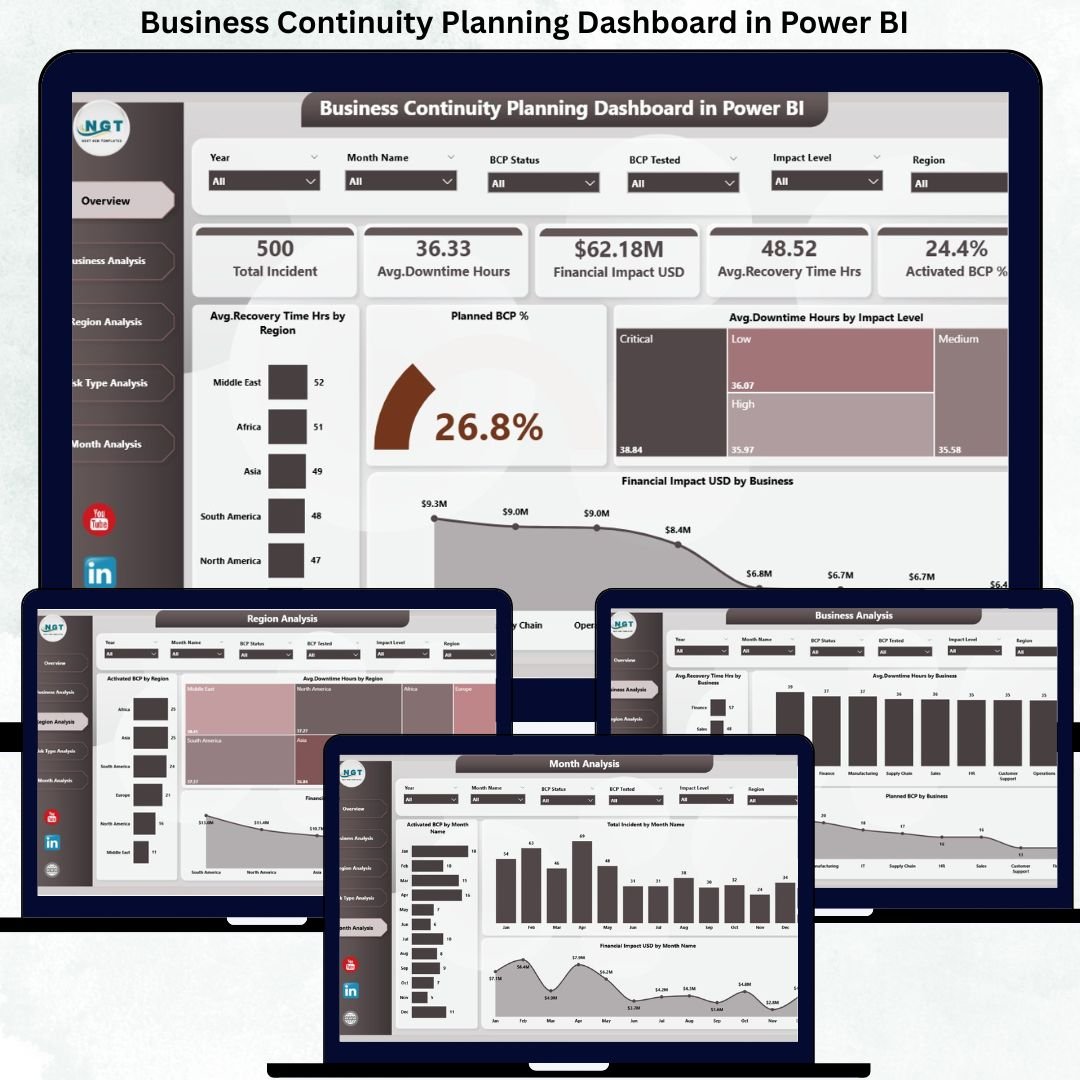
🏠 Overview Page – Enterprise-Level Continuity Snapshot
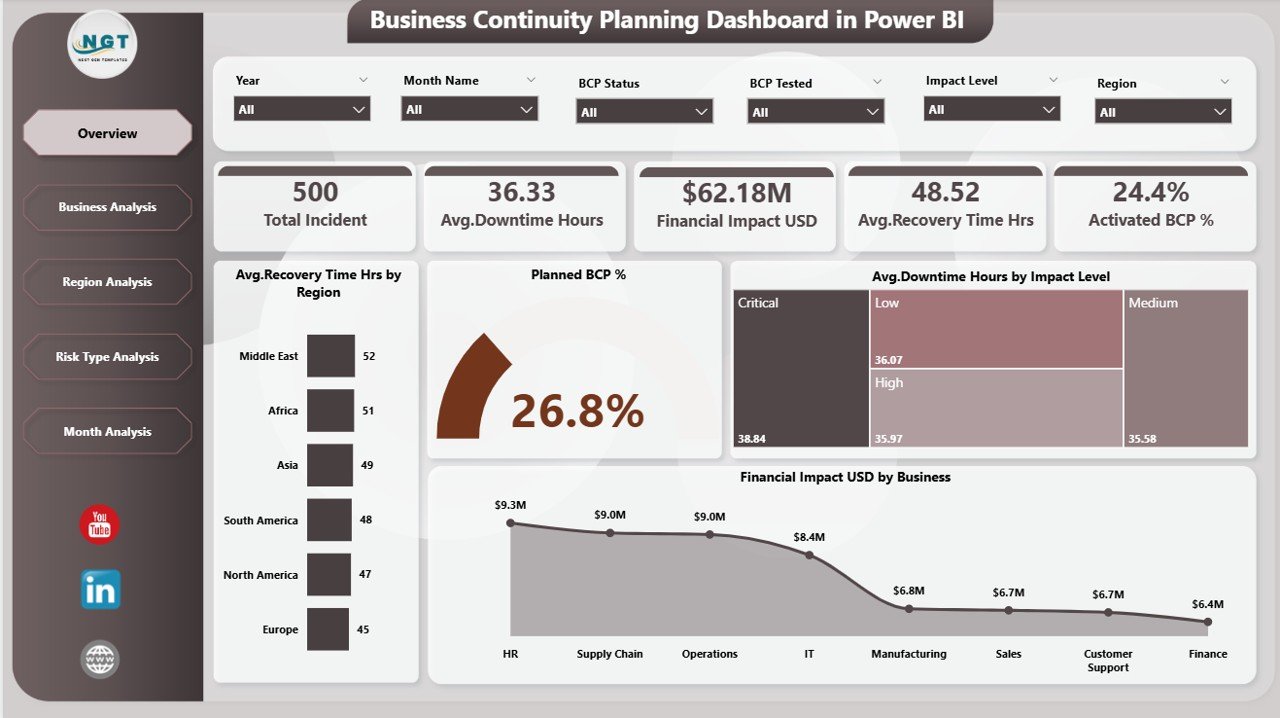
The Overview Page acts as the command center of the dashboard.
🎛️ Top Filters & KPI Cards
Users can filter data using:
-
🌍 Region
-
🏢 Business Unit
-
⚠️ Risk Type
-
📅 Time Period
Key KPI cards display:
-
⏱️ Average Recovery Time (Hours)
-
🛡️ Planned BCP %
-
⏳ Average Downtime Hours
-
💰 Total Financial Impact (USD)
📊 Key Visuals
-
Average Recovery Time by Region
-
Planned BCP %
-
Downtime by Impact Level
-
Financial Impact by Business
This page enables leaders to identify threats, exposure, and preparedness instantly.
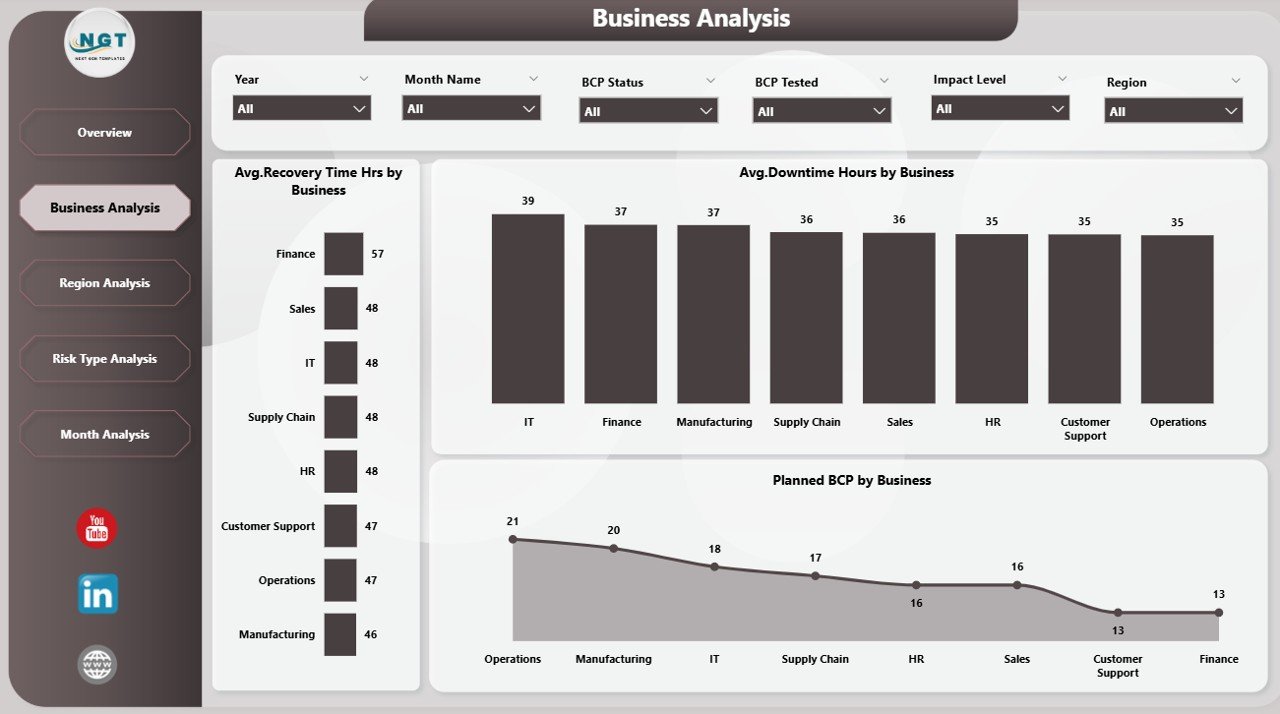
🏢 Business Analysis Page – Department-Level Risk Visibility
This page analyzes continuity performance across business units.
📊 Insights Covered
-
Recovery Time by Business
-
Planned BCP % by Business
-
Downtime Hours by Business
As a result, organizations can:
-
Identify weak continuity areas
-
Prioritize high-risk functions
-
Allocate resources strategically
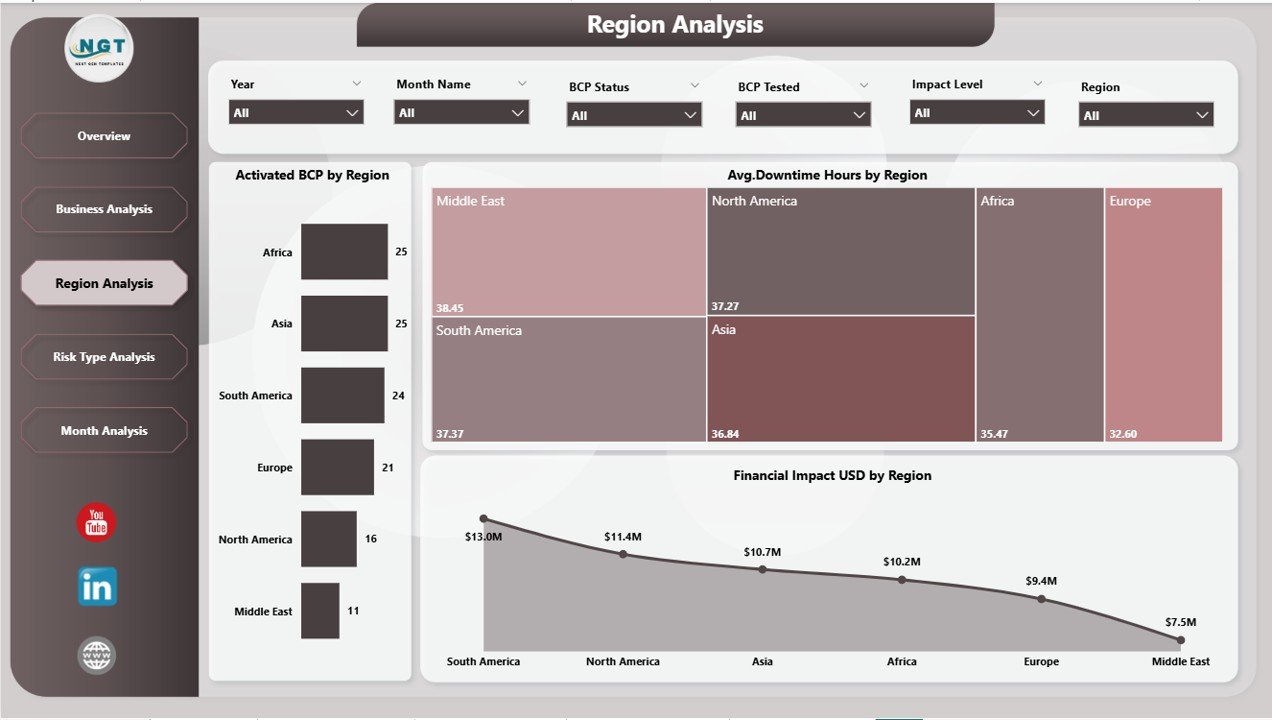
🌍 Region Analysis Page – Geographic Risk Exposure
The Region Analysis Page provides region-wise continuity insights.
📊 Key Charts
-
Active BCP by Region
-
Downtime Hours by Region
-
Financial Impact by Region
This page helps leadership strengthen regional resilience and preparedness.
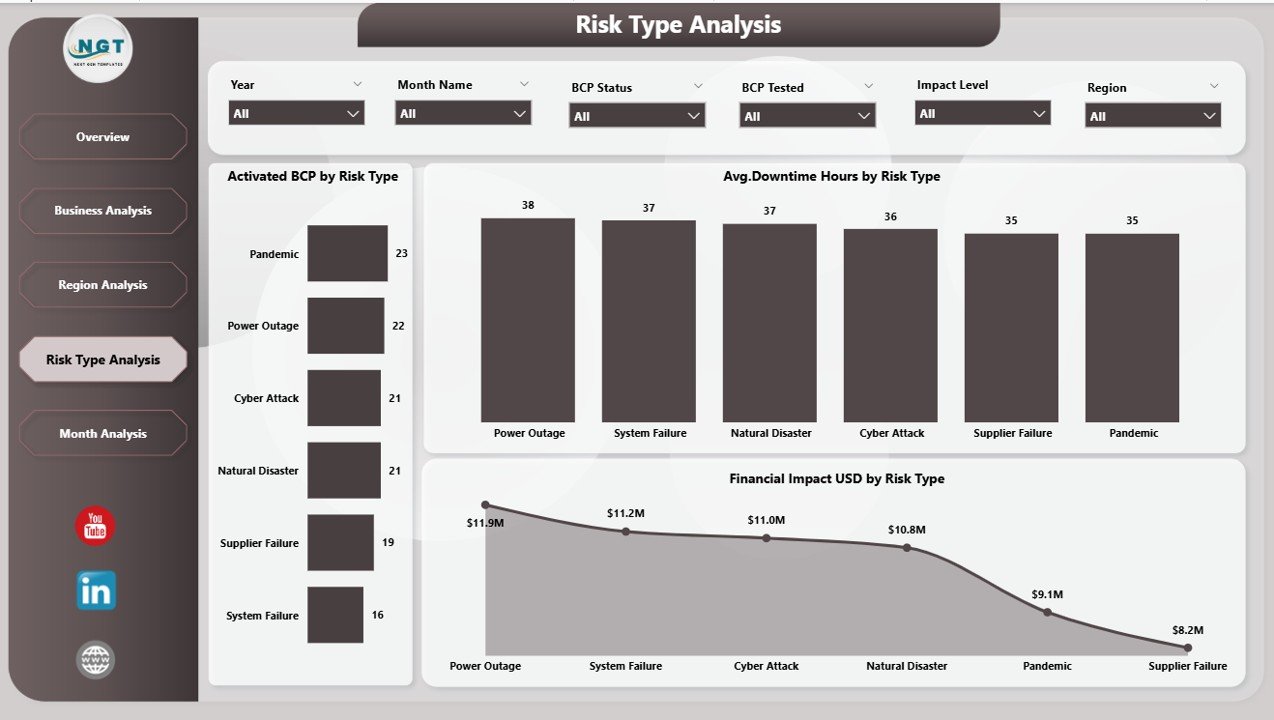
⚠️ Risk Type Analysis Page – Threat-Focused Planning
Not all risks behave the same. Therefore, this page breaks down continuity data by risk category.
📊 Risk Types Covered
-
Cybersecurity
-
Natural Disasters
-
System Failures
-
Supply Chain Disruptions
-
Operational Risks
📈 Charts Included
-
Active BCP by Risk Type
-
Downtime by Risk Type
-
Financial Impact by Risk Type
This allows teams to build targeted mitigation and recovery strategies.
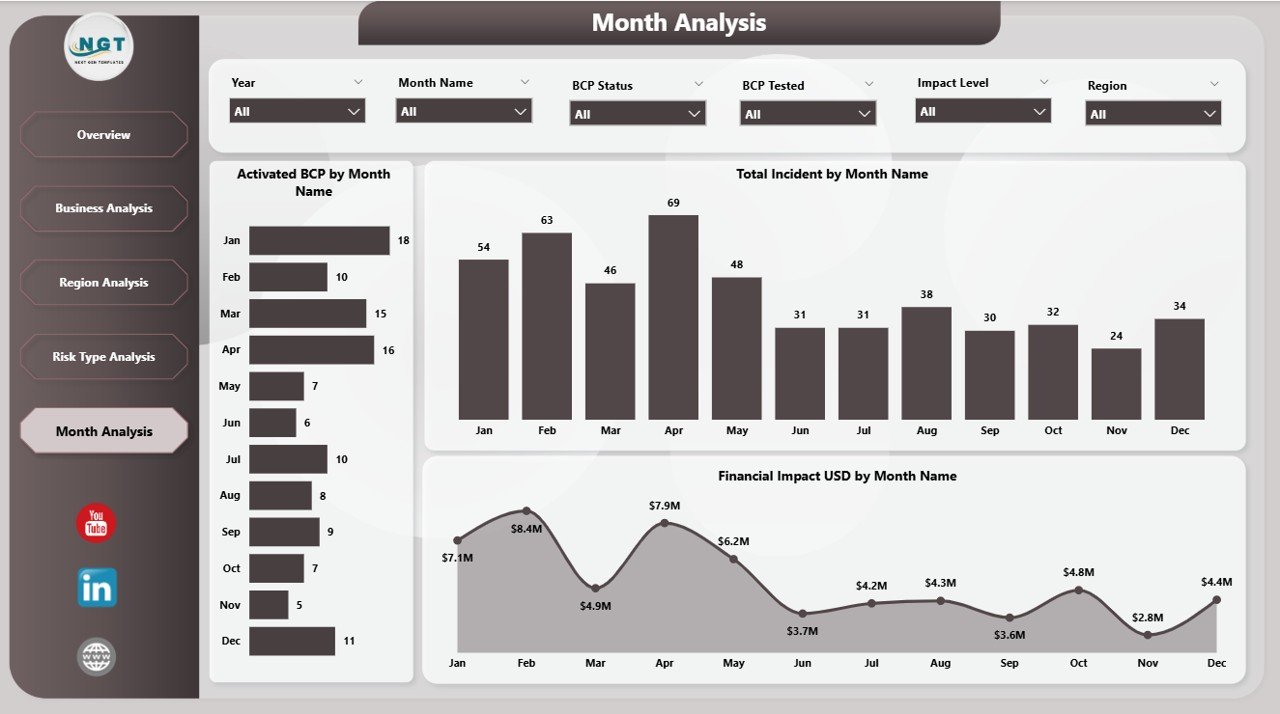
📅 Monthly Trends Page – Preparedness Over Time
The Monthly Trends Page tracks continuity performance over time.
📊 Charts Included
-
Active BCP by Month
-
Incident Count by Month
-
Financial Impact by Month
Trend analysis helps organizations:
-
Identify seasonal risk patterns
-
Measure improvement over time
-
Stay proactive instead of reactive
⚙️ How to Use the Business Continuity Planning Dashboard
1️⃣ Update continuity data in Excel
2️⃣ Refresh the Power BI dashboard
3️⃣ Use slicers to filter by region, risk, or business
4️⃣ Review KPIs, trends, and impact visuals
5️⃣ Take proactive continuity decisions
No advanced Power BI skills required.
👥 Who Can Benefit from This Dashboard
-
Business Continuity Managers
-
Risk & Compliance Teams
-
IT Disaster Recovery Teams
-
Operations Managers
-
Senior Leadership
-
Audit & Governance Teams
Any organization serious about resilience and preparedness benefits immediately.
### Click here to read the Detailed blog post
📺 Visit our YouTube channel to learn step-by-step video tutorials
👉 https://youtube.com/@PKAnExcelExpert


Reviews
There are no reviews yet.