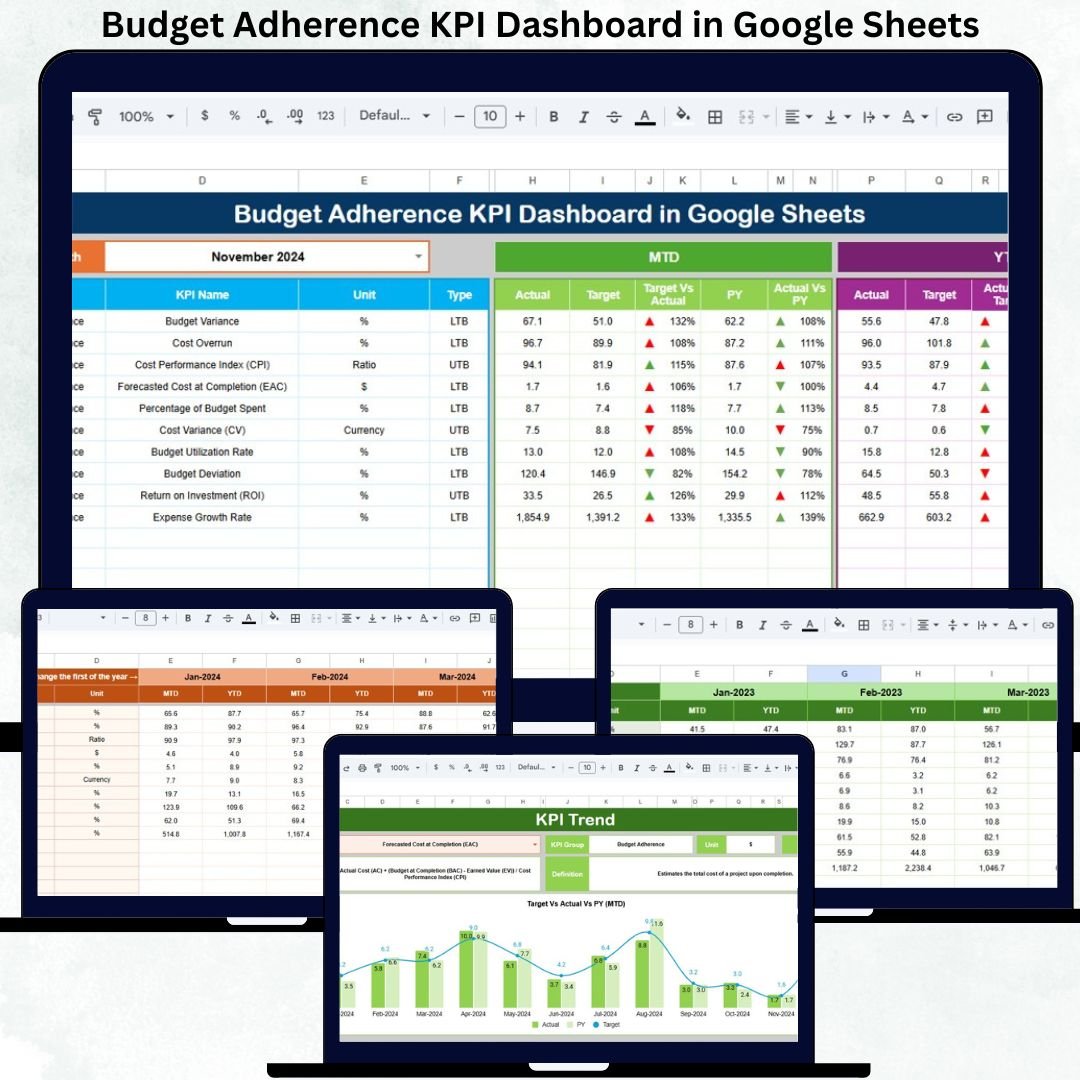
Every business wants to stay on budget, avoid financial surprises, and improve spending discipline. But when monthly expenses are tracked through scattered spreadsheets or manual reports, financial teams lose visibility. Departments overspend without realizing it, leaders miss early warning signs, and forecasting becomes unreliable. The Budget Adherence KPI Dashboard in Google Sheets solves all these challenges with a complete, automated, and easy-to-use financial monitoring system.
This dashboard converts raw numbers into clear visuals, KPI cards, variances, comparisons, and trend insights—helping teams understand budget performance instantly. Whether you are analyzing department spending, monitoring operational costs, or reviewing yearly trends, this Google Sheets dashboard gives you real-time financial clarity. With interactive dropdowns, structured data sheets, and fully automated calculations, users save hours of manual work every month.
✨ Key Features of the Budget Adherence KPI Dashboard in Google Sheets
📊 1. Real-Time MTD & YTD KPI Tracking
Users can instantly monitor Month-to-Date and Year-to-Date Actuals, Targets, and Previous Year values. The dashboard updates automatically when you select a month, giving you instant clarity on budget performance.
📈 2. Variance Analysis with Automatic Indicators
Every KPI includes Target vs Actual and Previous Year vs Actual comparisons. Conditional formatting arrows quickly show if performance improved or declined—green for positive trends, red for potential risks.
🧮 3. Structured Worksheets for Clean Financial Reporting
All data is organized into clear sheets: Dashboard, KPI Trend, Actuals, Targets, Previous Year, and KPI Definitions. This ensures consistency and eliminates reporting errors.
🔄 4. Single-Click Month Selection
Just change the month using the dropdown in Cell D3, and the entire dashboard refreshes instantly. No formulas or manual adjustments required.
📘 5. Easy-to-Understand KPI Definitions
The KPI Trend Sheet explains every KPI clearly—its group, unit, type (LTB/UTB), formula, and meaning. This is especially helpful for new team members or non-finance users.
📦 What’s Inside the Budget Adherence KPI Dashboard in Google Sheets
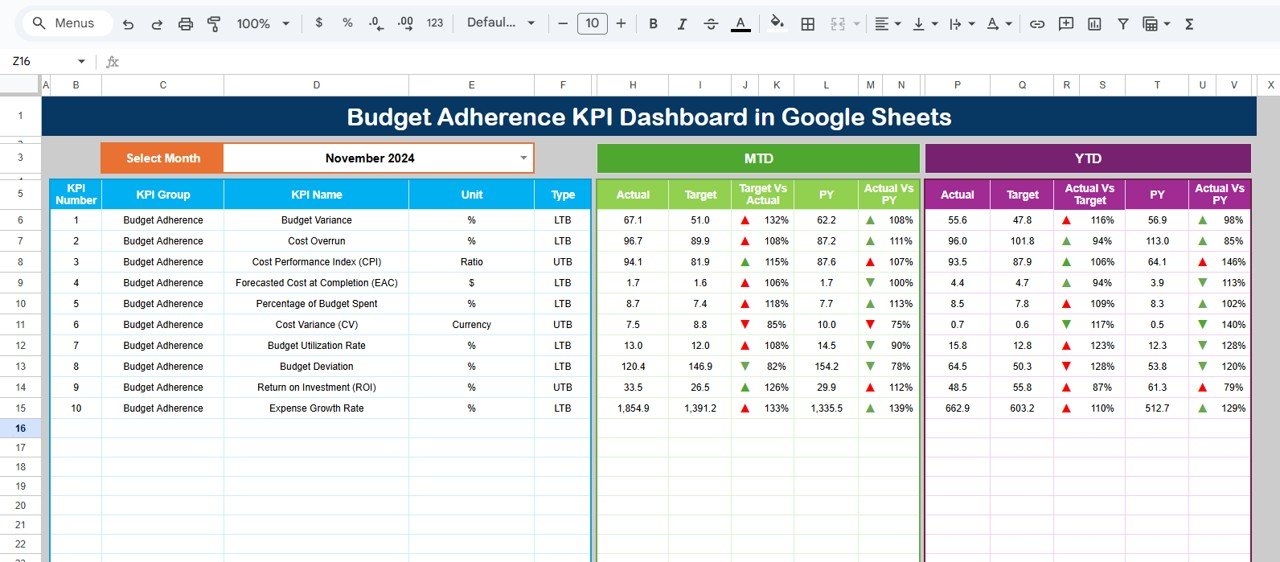
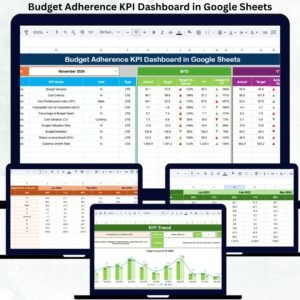
🖥️ Dashboard Sheet Tab (Main Page)
The dashboard provides a real-time financial snapshot. It displays:
-
MTD Actual vs Target
-
MTD Actual vs Previous Year
-
YTD Actual vs Target
-
YTD Actual vs Previous Year
-
Variance trends with indicators
Leaders can instantly see where budgets align, where overspending occurs, and which areas need corrective action.
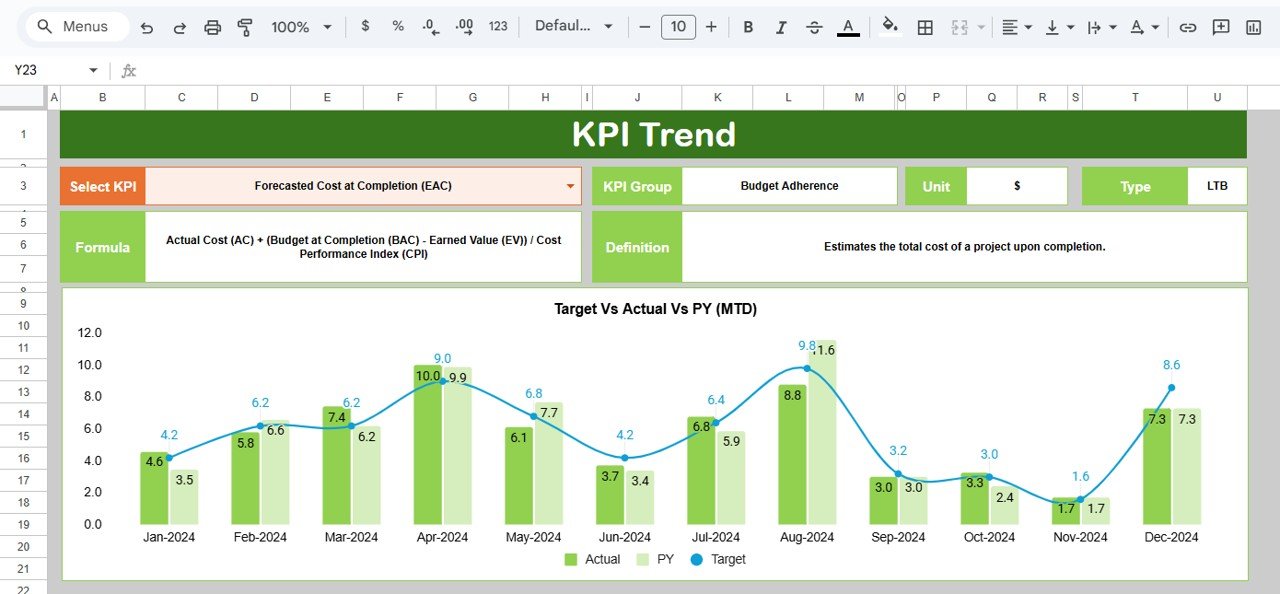
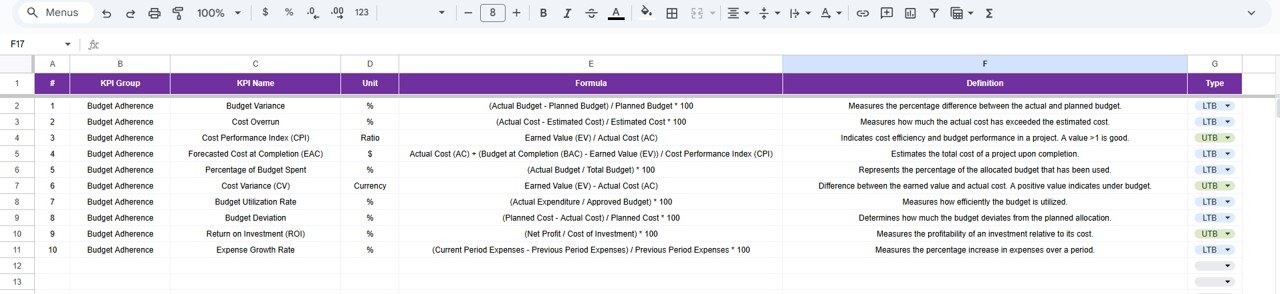
📉 KPI Trend Sheet Tab
Users choose a KPI from the dropdown to view:
-
KPI Group
-
Unit
-
KPI Type (UTB / LTB)
-
Formula
-
Short Definition
This sheet helps users understand financial metrics deeply and track long-term behavior.
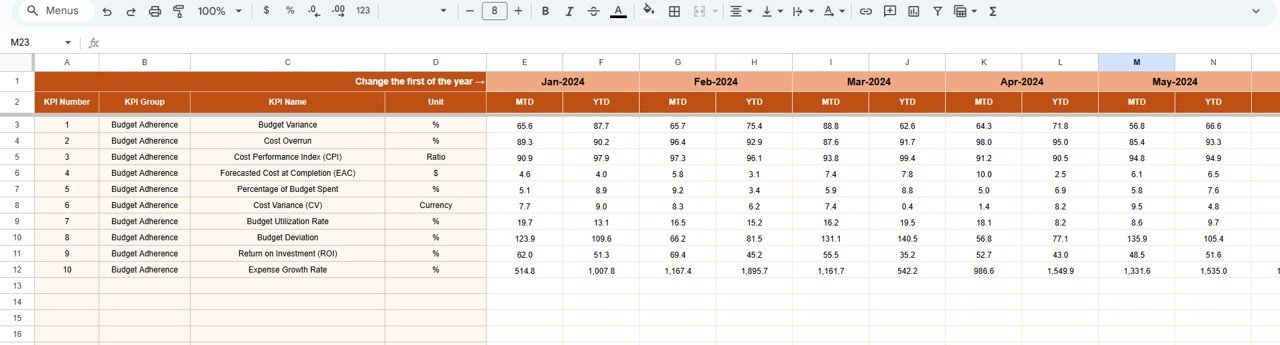
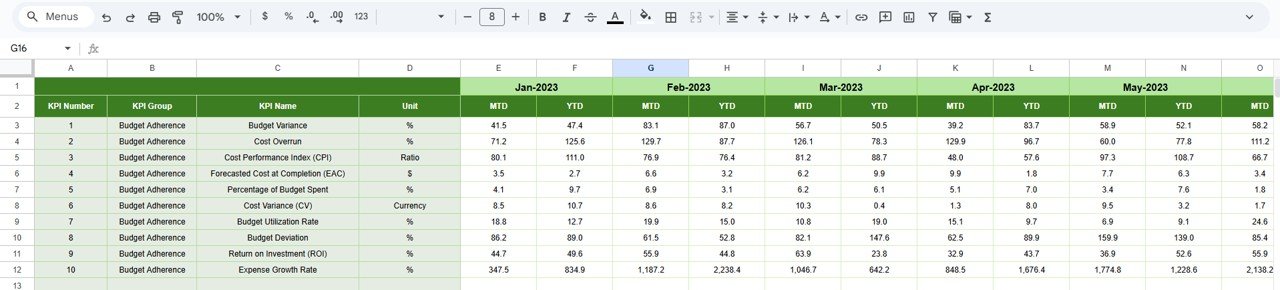
📋 Actual Number Sheet Tab
Enter actual financial numbers here. Users select the financial year’s starting month in Cell E1 and input MTD/YTD values. This sheet powers the entire dashboard with accurate data.
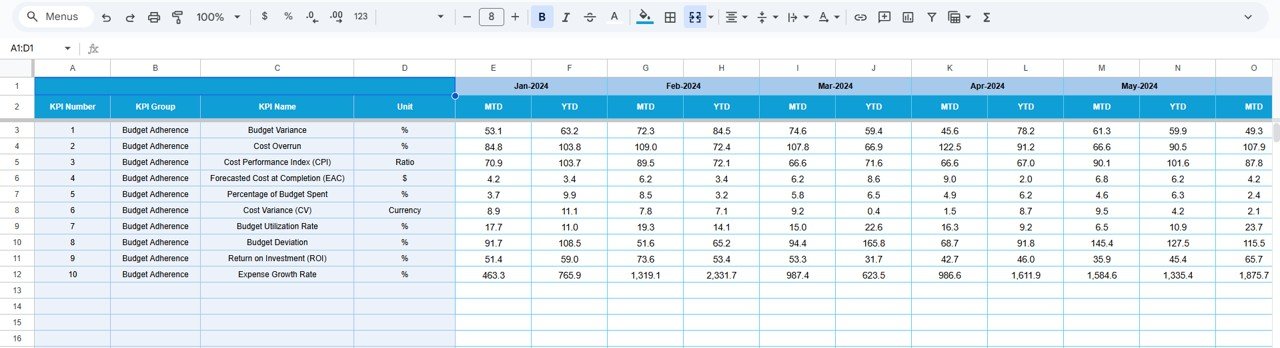
🎯 Target Sheet Tab
This section stores monthly targets. The dashboard compares Actual vs Target values automatically—making financial control easier and more transparent.
📆 Previous Year Sheet Tab
Enter last year’s numbers for accurate YOY comparisons. This helps teams identify spending growth, cost spikes, or improvement trends.
📘 KPI Definition Sheet Tab
A master table containing KPI formulas, descriptions, units, and groups. Clean documentation ensures accuracy across all financial reporting.
🛠️ How to Use the Budget Adherence KPI Dashboard in Google Sheets
1️⃣ Enter Actual Numbers Regularly
Weekly or monthly updates keep reports accurate and meaningful.
2️⃣ Set Department-Wise Financial Targets
Targets guide spending discipline and help departments stay within limits.
3️⃣ Compare Variances at the Start of Each Month
Negative variances highlight risk areas and overspending trends.
4️⃣ Analyze KPI Trends for Smarter Decisions
Identify patterns and adjust future budgets accordingly.
5️⃣ Use Previous Year Data for Forecasting
YOY comparisons support stronger planning and better cost control.
🎯 Who Can Benefit from This Budget Adherence KPI Dashboard
💼 Finance Teams & CFOs
Monitor costs, detect variances, and ensure financial stability.
🏢 Department Heads
Understand spending patterns and maintain budget discipline.
📊 Project Managers
Track project-wise budget utilization and reduce cost overruns.
🚀 Business Owners & Startups
Make informed decisions using clear financial insights.
👥 Non-Financial Teams
Even beginners can understand the dashboard easily due to its simple design.
### Click here to read the Detailed blog post
Watch the step-by-step video tutorial:


Reviews
There are no reviews yet.