Tracking broadcasting performance without a structured system can lead to missed insights, poor decision-making, and inconsistent growth. Managing multiple KPIs manually across reports only adds complexity and delays.
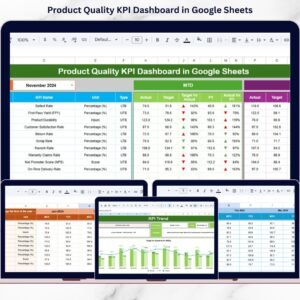
Introducing the Broadcasting KPI Scorecard in Google Sheets – a powerful, ready-to-use template designed to help you track, analyze, and optimize your broadcasting performance with ease.
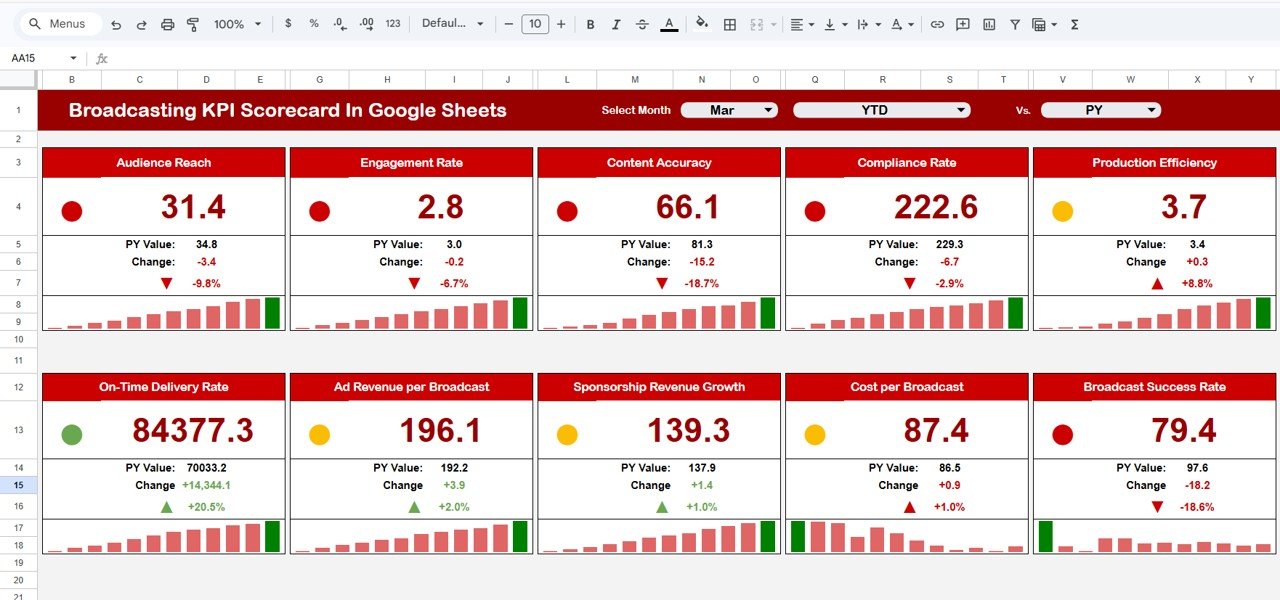
This cloud-based scorecard transforms raw data into clear, actionable insights. It allows you to monitor Month-to-Date (MTD) and Year-to-Date (YTD) performance, compare actual vs target values, and instantly identify performance gaps using intuitive visual indicators.
Whether you manage TV broadcasting, radio channels, or digital media platforms, this scorecard gives you complete visibility into your operations and performance trends.
🚀 Key Features of Broadcasting KPI Scorecard in Google Sheets
📊 Interactive KPI Scorecard – Track all KPIs in one centralized dashboard
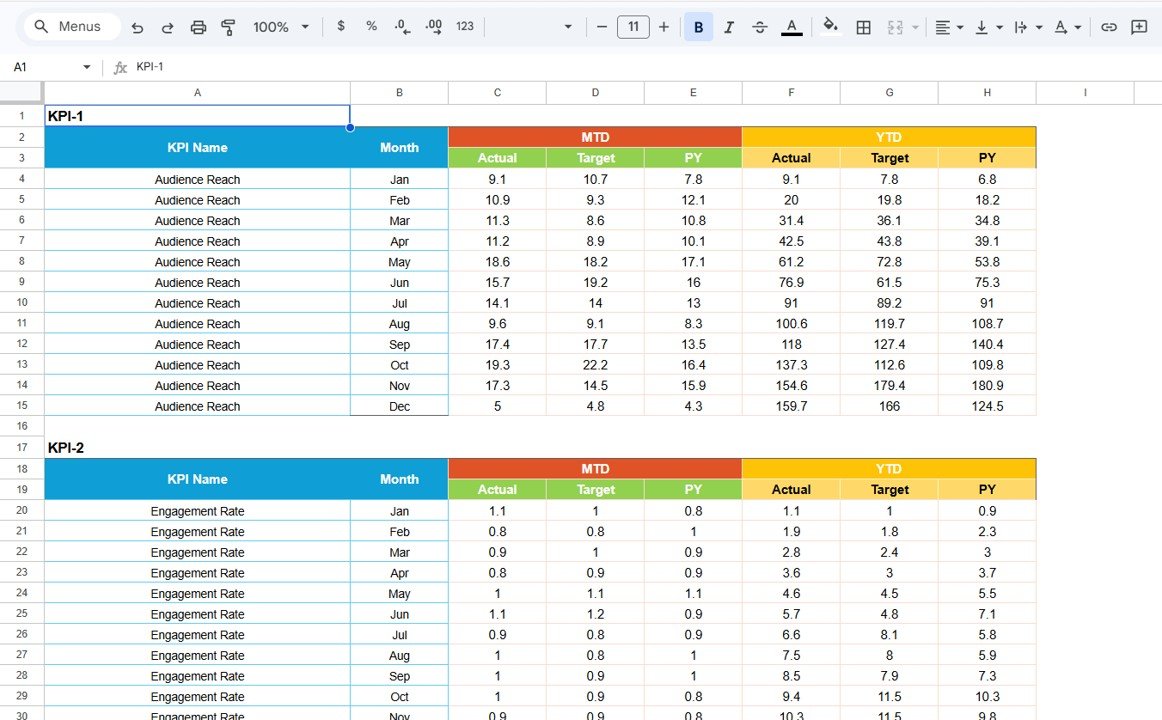
📅 MTD & YTD Analysis – Compare performance across different time periods
🎯 Actual vs Target Comparison – Measure performance accuracy easily
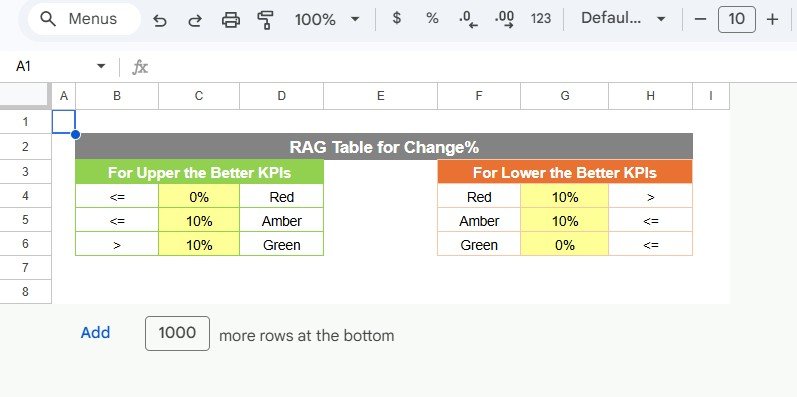
🎨 Color-Coded Indicators – Instantly identify performance status
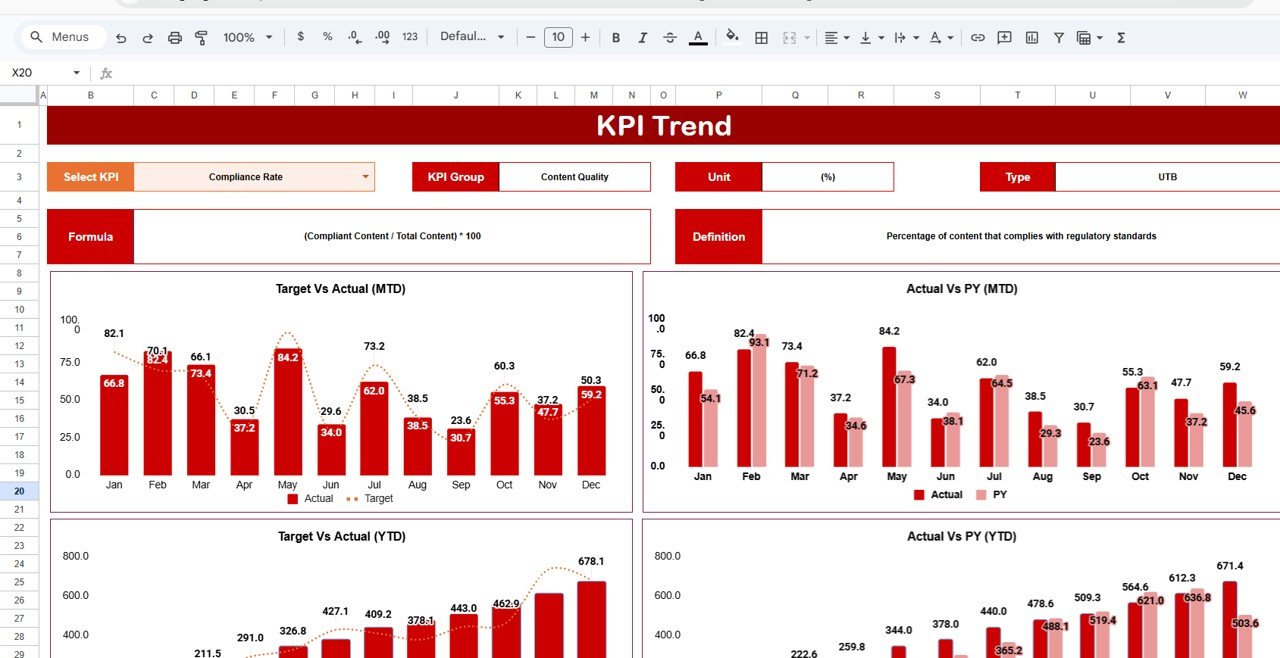
📈 Trend Analysis Charts – Monitor KPI trends over time
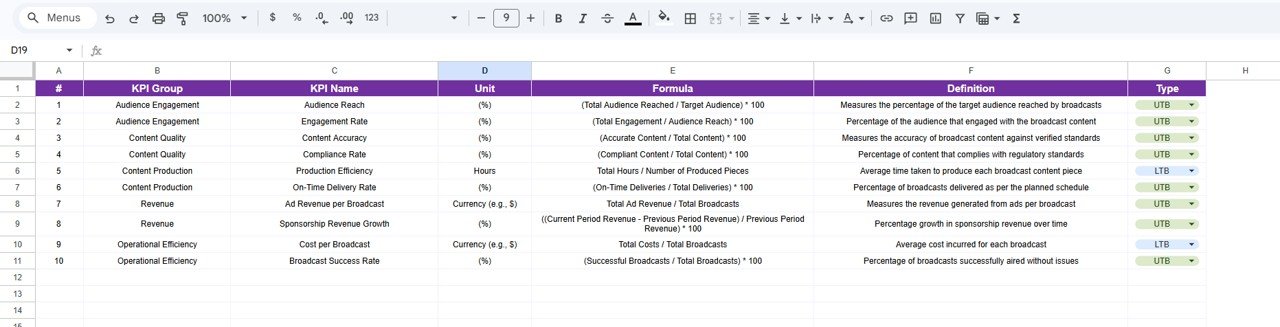
📘 Detailed KPI Definitions – Understand KPIs with formulas and explanations
📥 Structured Data Input – Easily enter and update KPI data
🌐 Cloud-Based Access – Collaborate and access from anywhere
📦 What’s Inside the Broadcasting KPI Scorecard in Google Sheets
This template includes 4 well-structured and easy-to-use worksheets:
📊 Scorecard Sheet – View all KPIs with MTD and YTD comparisons in one place
📈 KPI Trend Sheet – Analyze individual KPI performance and trends
📥 Input Data Sheet – Enter actual KPI values and targets
📘 KPI Definition Sheet – Maintain KPI details including formulas, units, and types
Additionally, the scorecard includes dropdown controls, automated calculations, and visual indicators to simplify KPI tracking and analysis.
⚙️ How to Use the Broadcasting KPI Scorecard in Google Sheets
Getting started is quick and simple:
1️⃣ Enter KPI Data – Input actual values and targets
2️⃣ Select Time Period – Choose month, MTD, or YTD view
3️⃣ Review Scorecard – Instantly analyze KPI performance
4️⃣ Analyze Trends – Use KPI Trend sheet for deeper insights
5️⃣ Take Action – Optimize strategies based on insights
👉 Within minutes, you can transform your broadcasting data into actionable performance insights.
👥 Who Can Benefit from This Broadcasting KPI Scorecard in Google Sheets
This scorecard is ideal for professionals in the broadcasting and media industry:
📺 Broadcast Managers – Monitor channel performance and KPIs
📻 Radio & Media Teams – Track audience engagement and operations
📊 Data Analysts – Perform detailed KPI analysis
📢 Marketing Teams – Optimize campaigns based on performance data
🏢 Media Organizations – Improve reporting and decision-making
👉 In short, anyone managing broadcasting performance can benefit from this tool.
With its intuitive design, real-time collaboration, and powerful analytics, this scorecard helps you improve performance tracking, enhance decision-making, and drive better results.
Stop relying on scattered reports and manual tracking.
👉 Download now and take control of your broadcasting KPIs like a pro! 🚀