In today’s competitive broadcasting world, success depends on how well you can track your performance. Whether you manage a TV station, radio network, or digital streaming platform — having the right insights at the right time can make all the difference. The Broadcasting KPI Scorecard in Excel is a professionally designed, ready-to-use template that helps media organizations monitor, visualize, and analyze performance with ease.
Built entirely in Microsoft Excel, this powerful tool consolidates data across programming, marketing, operations, and finance — turning raw numbers into actionable insights. No complex software or coding required!
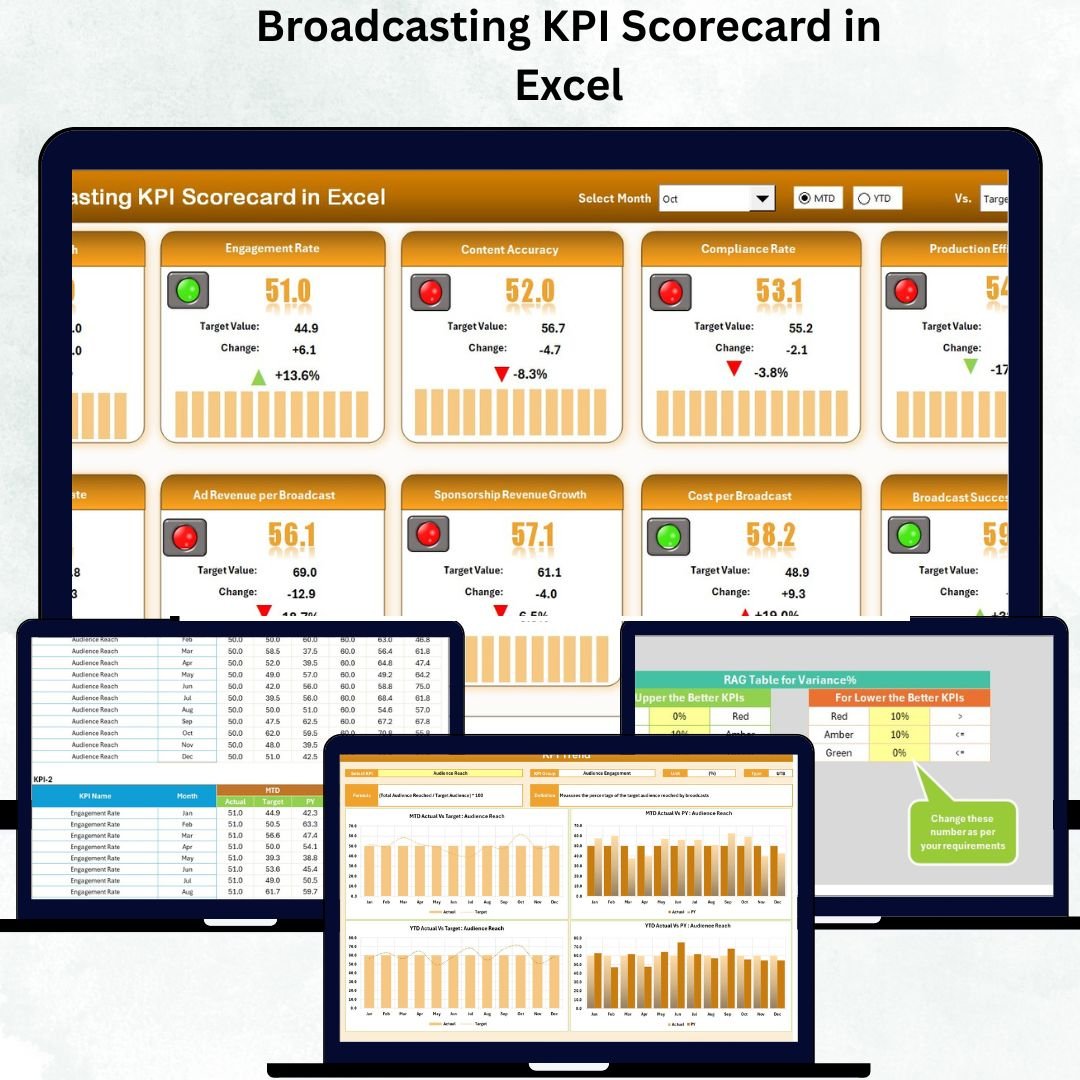
🎯 Key Features of Broadcasting KPI Scorecard in Excel
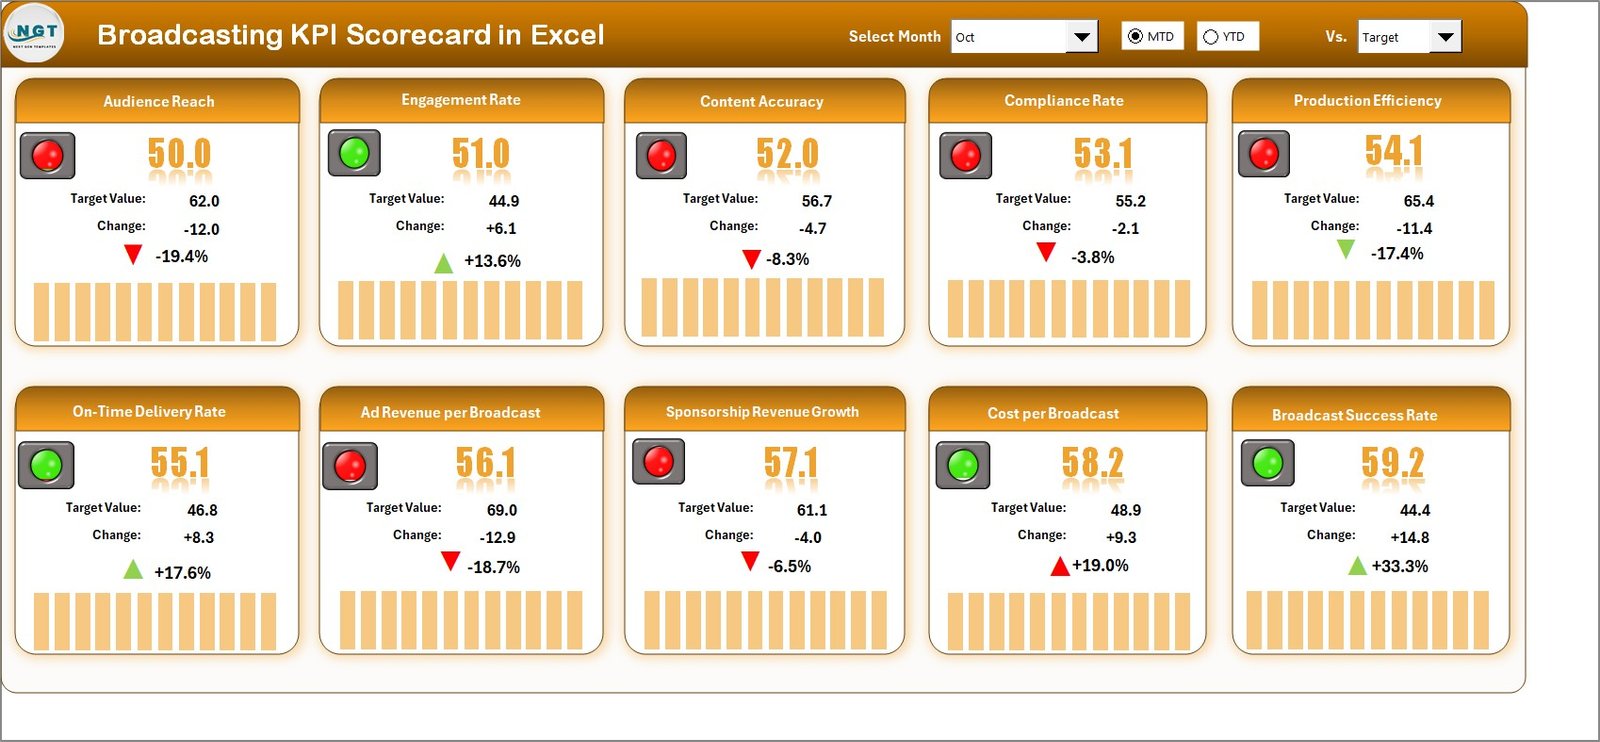
✨ Interactive Dashboard: Switch between months using a simple dropdown (cell D3). Instantly view MTD (Month-to-Date) and YTD (Year-to-Date) KPIs with visual indicators.
📈 Actual vs Target Comparison: Track your achievements against set goals and previous year’s performance.
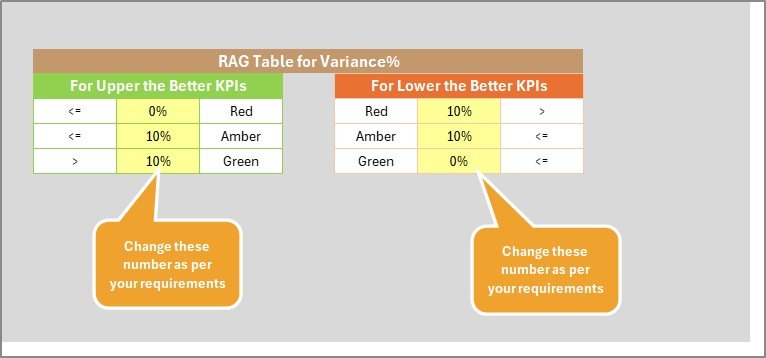
🟢🔴 Conditional Formatting: Up/down arrows and color-coded visuals highlight trends automatically.
📊 Comprehensive Analysis: Review performance across programming, operations, finance, and marketing.
🧩 Fully Customizable: Add, remove, or modify KPIs as per your organization’s unique requirements.
🚀 No Extra Software: 100% Excel-based — simple, secure, and compatible with all Excel versions.
🔍 Drill-Down Insights: Easily explore KPI trends, spot performance gaps, and identify improvement areas.
📂 User-Friendly Navigation: Clickable buttons connect all sheets for smooth access.
This scorecard turns complex data into a visual story — perfect for management reports, review meetings, and monthly presentations.
📘 What’s Inside the Broadcasting KPI Scorecard in Excel
The workbook includes 7 organized worksheets, each crafted to serve a specific analytical purpose:
1️⃣ Home Sheet: Central navigation panel with buttons to jump between Dashboard, Trend, and Input sheets.
2️⃣ Dashboard Sheet: The main hub that displays MTD and YTD results, Actual vs Target, and PY data with conditional formatting.
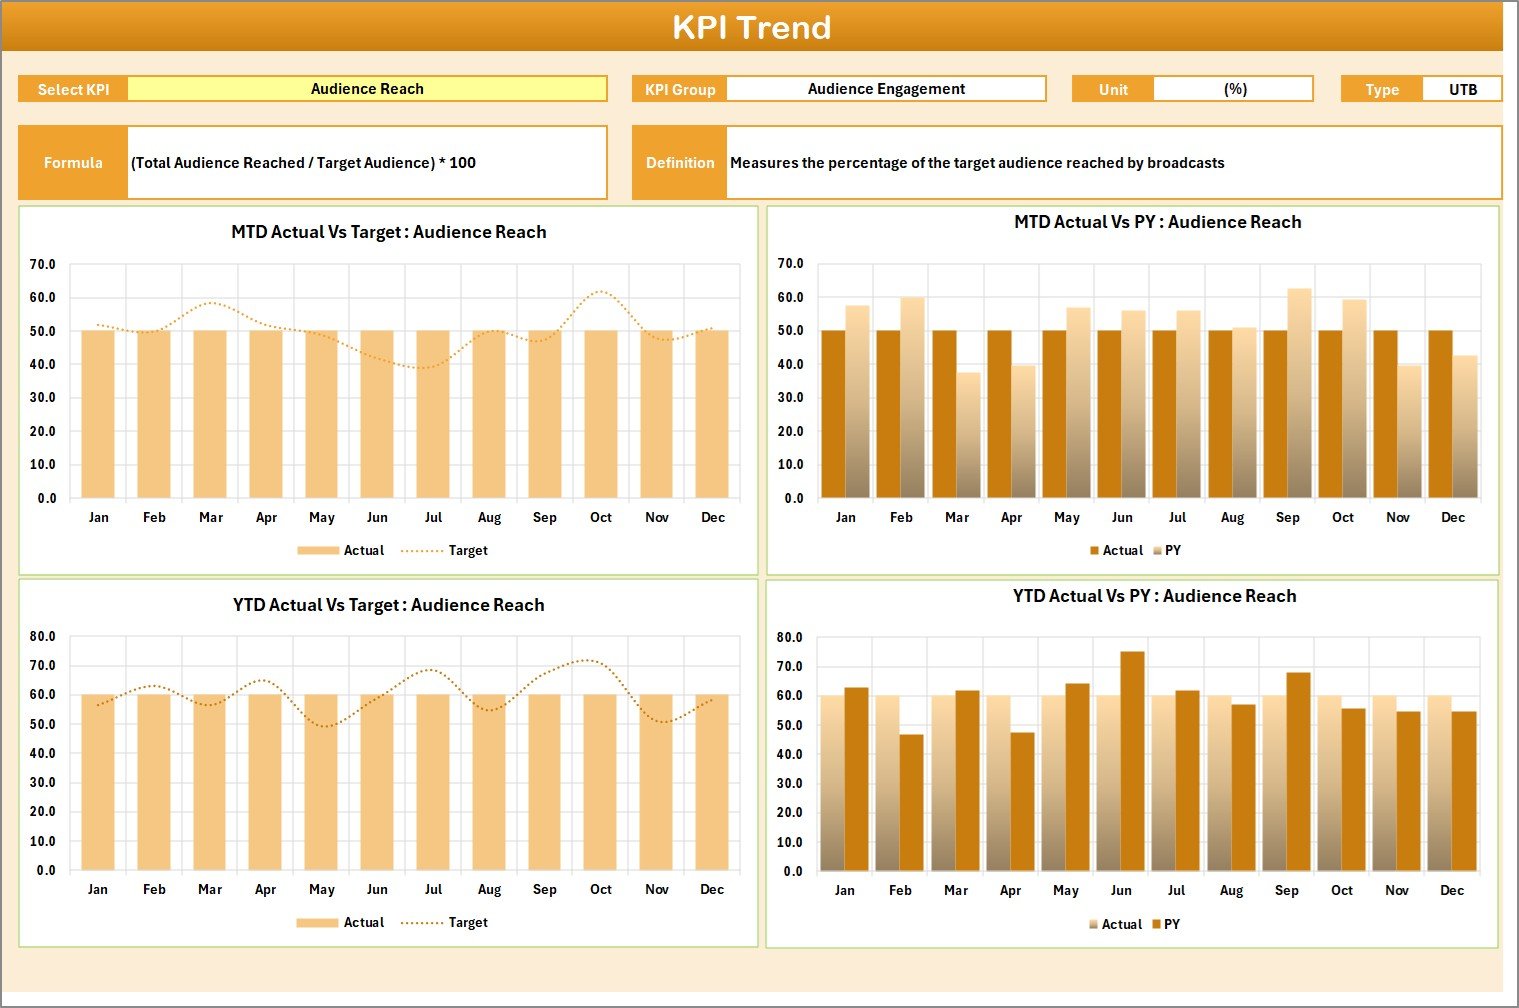
3️⃣ KPI Trend Sheet: Select a KPI (from a dropdown in cell C3) to view dynamic charts showing Actual, Target, and PY performance.
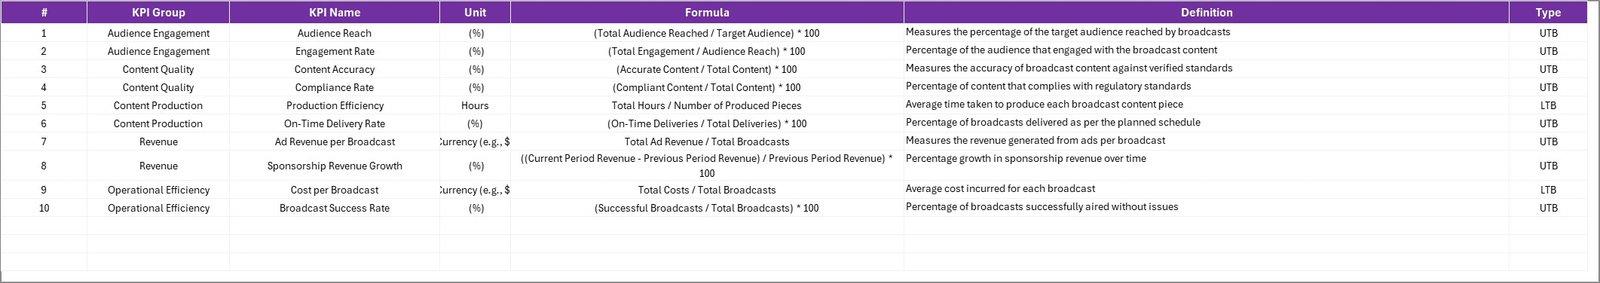
4️⃣ KPI Definition Sheet: Lists every KPI with details such as Group, Unit, Formula, Type (UTB/LTB), and Definition.
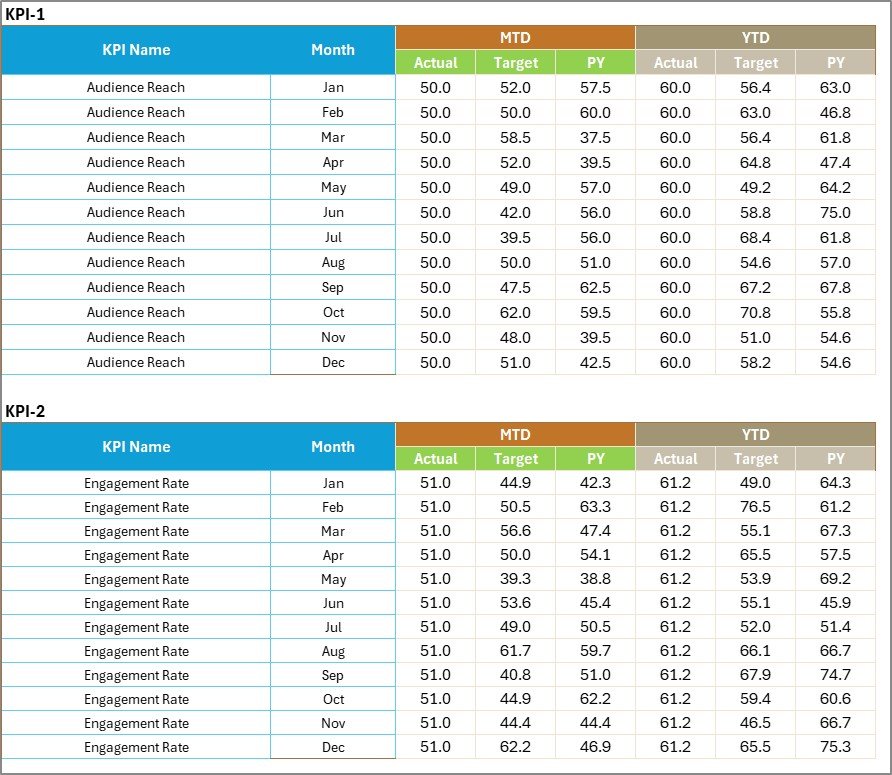
5️⃣ Target Sheet: Store monthly target data for all key performance indicators.
6️⃣ Actual Data Sheet: Input monthly actual performance values.
7️⃣ Previous Year Sheet: Maintain PY data for benchmarking.
Together, these sheets create a robust analytical ecosystem that simplifies tracking and empowers data-driven decisions.
🧠 How to Use the Broadcasting KPI Scorecard in Excel
✅ Step 1: Enter all KPI details in the KPI Definition sheet (Group, Unit, Type, Formula, etc.).
✅ Step 2: Fill Target, Actual, and Previous Year data sheets with monthly figures.
✅ Step 3: Select the month from the dropdown (cell D3) on the Dashboard sheet.
✅ Step 4: Review all charts and indicators to evaluate performance.
✅ Step 5: Go to the KPI Trend sheet for detailed month-wise trend analysis.
Within minutes, you’ll have a real-time, visually engaging scorecard showing exactly where your broadcasting business stands.
👥 Who Can Benefit from This Broadcasting KPI Scorecard in Excel
🎬 TV & Radio Broadcasters: Track viewership ratings, ad revenue, and airtime performance.
📡 Digital Streaming Platforms: Monitor content engagement and audience retention.
💼 Media Managers & Executives: Get a consolidated overview of all KPIs for strategic decision-making.
📊 Financial & Marketing Teams: Measure profitability, campaign ROI, and cost efficiency.
🧑💻 Data Analysts & M&E Teams: Simplify reporting and visualization without external tools.
🏢 Small & Mid-Sized Networks: Save money by using an affordable, Excel-based solution instead of complex BI software.
This tool ensures every department works with consistent data — building transparency, efficiency, and accountability across your organization.


Reviews
There are no reviews yet.